
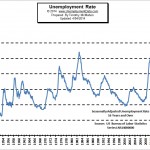
The U.S. Bureau of Labor Statistics (BLS) released the June Unemployment figures on July 3rd. The Seasonally Adjusted Unemployment Rate was 6.1% down from 6.3% in May. The Unadjusted Unemployment rate was the exact opposite 6.3% in June and 6.1% May. So was the unemployment rate up or down?
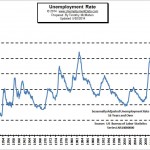
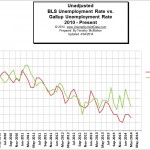
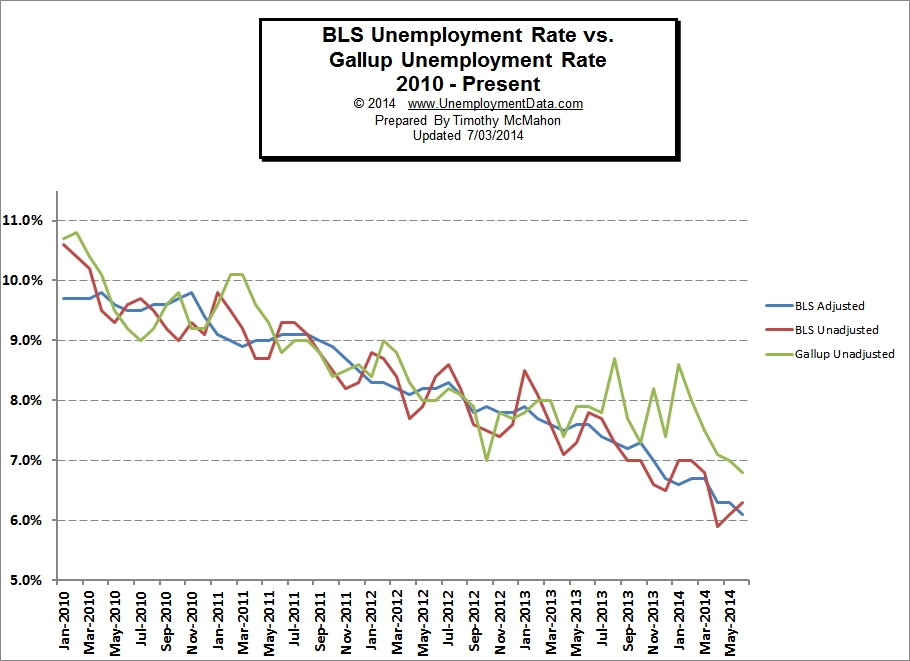 According to the Gallup poll people both adjusted and unadjusted were down. The unadjusted rate was 6.8% down from 7.0% in May and the adjusted unemployment rate was 6.5% down from 7.2% in May. As we can see from the chart to the left for almost a year now Gallup numbers have diverged drastically from the BLS numbers by roughly a full percent. but this month the divergence narrowed a bit to “only” 1/2 percent. For more information see:
Current US Unemployment Rate: 6.1% BLS or 6.5% Gallup
U-6 Unemployment
U-6 includes all classes of unemployed even those considered “marginally attached” and/or part-time for economic reasons. In other words, those who [Read more…] about BLS Releases June Unemployment- 6.1%
 Source


 Before you panic, you need to take a step back and come up with a game plan. How much money is in the bank? Do you have enough money to pay your mortgage and other bills for the next few months? Did you receive a severance package? Are you eligible for unemployment compensation? Either way you need to cut your expenses to the bone. Evaluate ongoing subscriptions, stop eating out, going to movies, etc.
 As many people discover the advantages of taking classes online, more top-tier universities, such as Harvard, Yale and MIT are providing “MOOC’s” or massive open online courses . These online lectures are often available free of charge. Stanford has the most popular free course: Introduction to “AI” with 160,000 students from 190 countries.