![]()
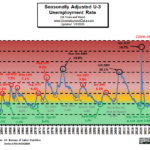
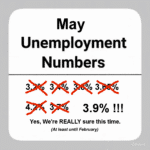
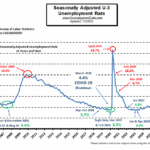
- Seasonally Adjusted U-3 is 4.2% down from 4.3%
- Unadjusted U-3 is 4.4% up from 4.1%
- Unadjusted U-6 is 8.2% up from 7.7%
- Labor Force Participation is 61.5% down from 61.8%
- Unadjusted Employment rose from 159.398 million to 159.830 million
- Next Update: August 7th, 2026
Summary:
Despite the Adjusted U-3 being DOWN, this report is weaker than the headline unemployment rate suggests. Although the decline in unemployment looks encouraging at first glance, we can see that the Unadjusted numbers are actually up and Labor Force Participation is down, which tends to skew the appearance of the U-3. Another factor making the U-3 number look better is the BLS revising the previous employment numbers down, so this month’s gains look bigger.
The good news
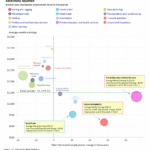
- Companies are still reluctant to lay off workers.
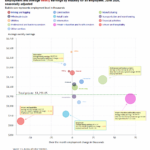
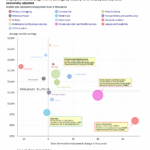
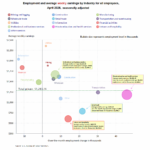
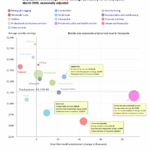
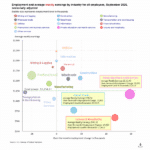
- Wage growth remains reasonably healthy.
- Professional and business services, healthcare, and social assistance continued adding jobs.
According to the Commissioner of the U.S. Bureau of Labor Statistics:
“Both total nonfarm payroll employment (+57,000) and the unemployment rate (4.2 percent) changed little in June, the U.S. Bureau of Labor Statistics reported today. Employment continued to trend up in professional and business services, social assistance, and health care. Leisure and hospitality lost jobs…
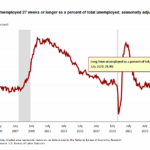
The number of long-term unemployed (those jobless for 27 weeks or more) changed little at 1.9 million in June but is up by 286,000 over the year. The long-term unemployed accounted for 27.3 percent of all unemployed people in June.“
As usual, they are talking about “Seasonally Adjusted Jobs”.
Looking at the Unadjusted Establishment Survey report, we see…
Last month, the BLS reported employment of 158.726 million for April, which they have adjusted down to 158.713 million a decrease of 13,000. Original May numbers were 159.467 million, adjusted to 159.398 million, a decrease of 69,000 for a combined decrease of 82,000. But based on the revised numbers, employment is still up by 1.117 million since April.