The U.S. Bureau of Labor Statistics (BLS) released its May
employment / unemployment report on June 5th, 2026.
Employment / Unemployment
![]()
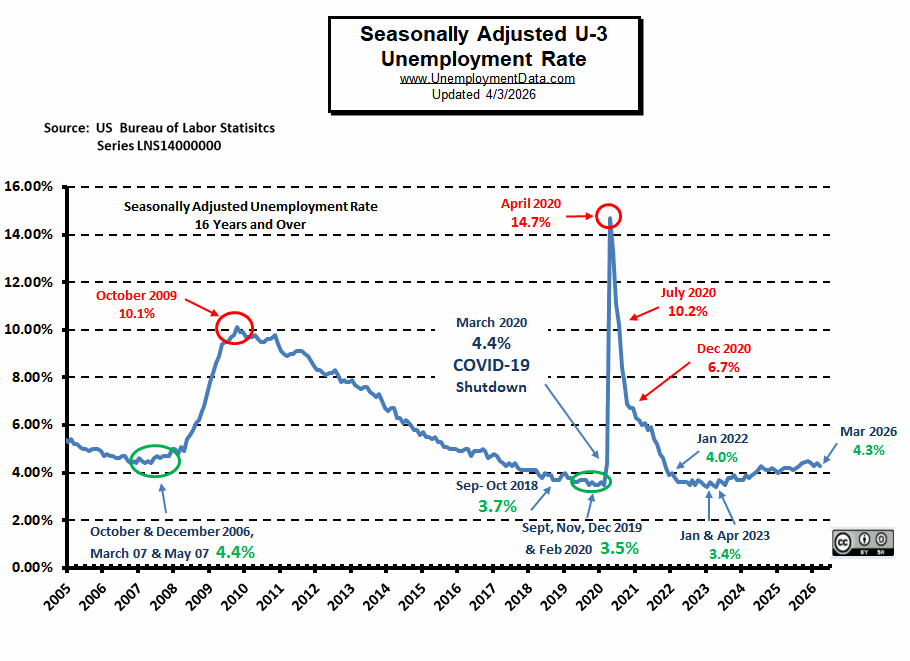
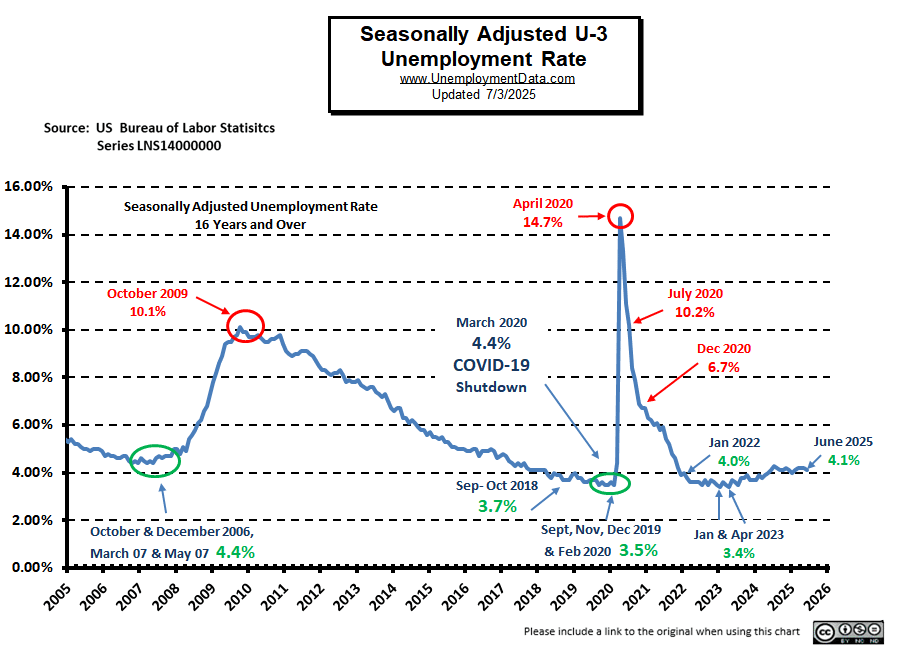
- Seasonally Adjusted U-3 is 4.3% Unchanged
- Unadjusted U-3 is 4.1% up from 4.0%
- Unadjusted U-6 is 7.7% Unchanged
- Labor Force Participation is 61.8% Unchanged
- Unadjusted Employment rose from 158.726 million to 159.467 million
- Next Update: July 2nd, 2026
Summary:
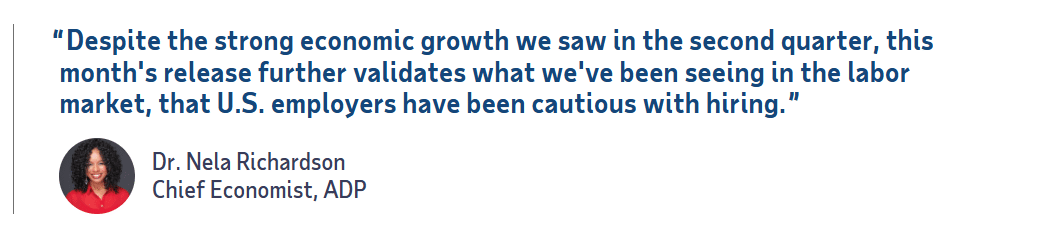
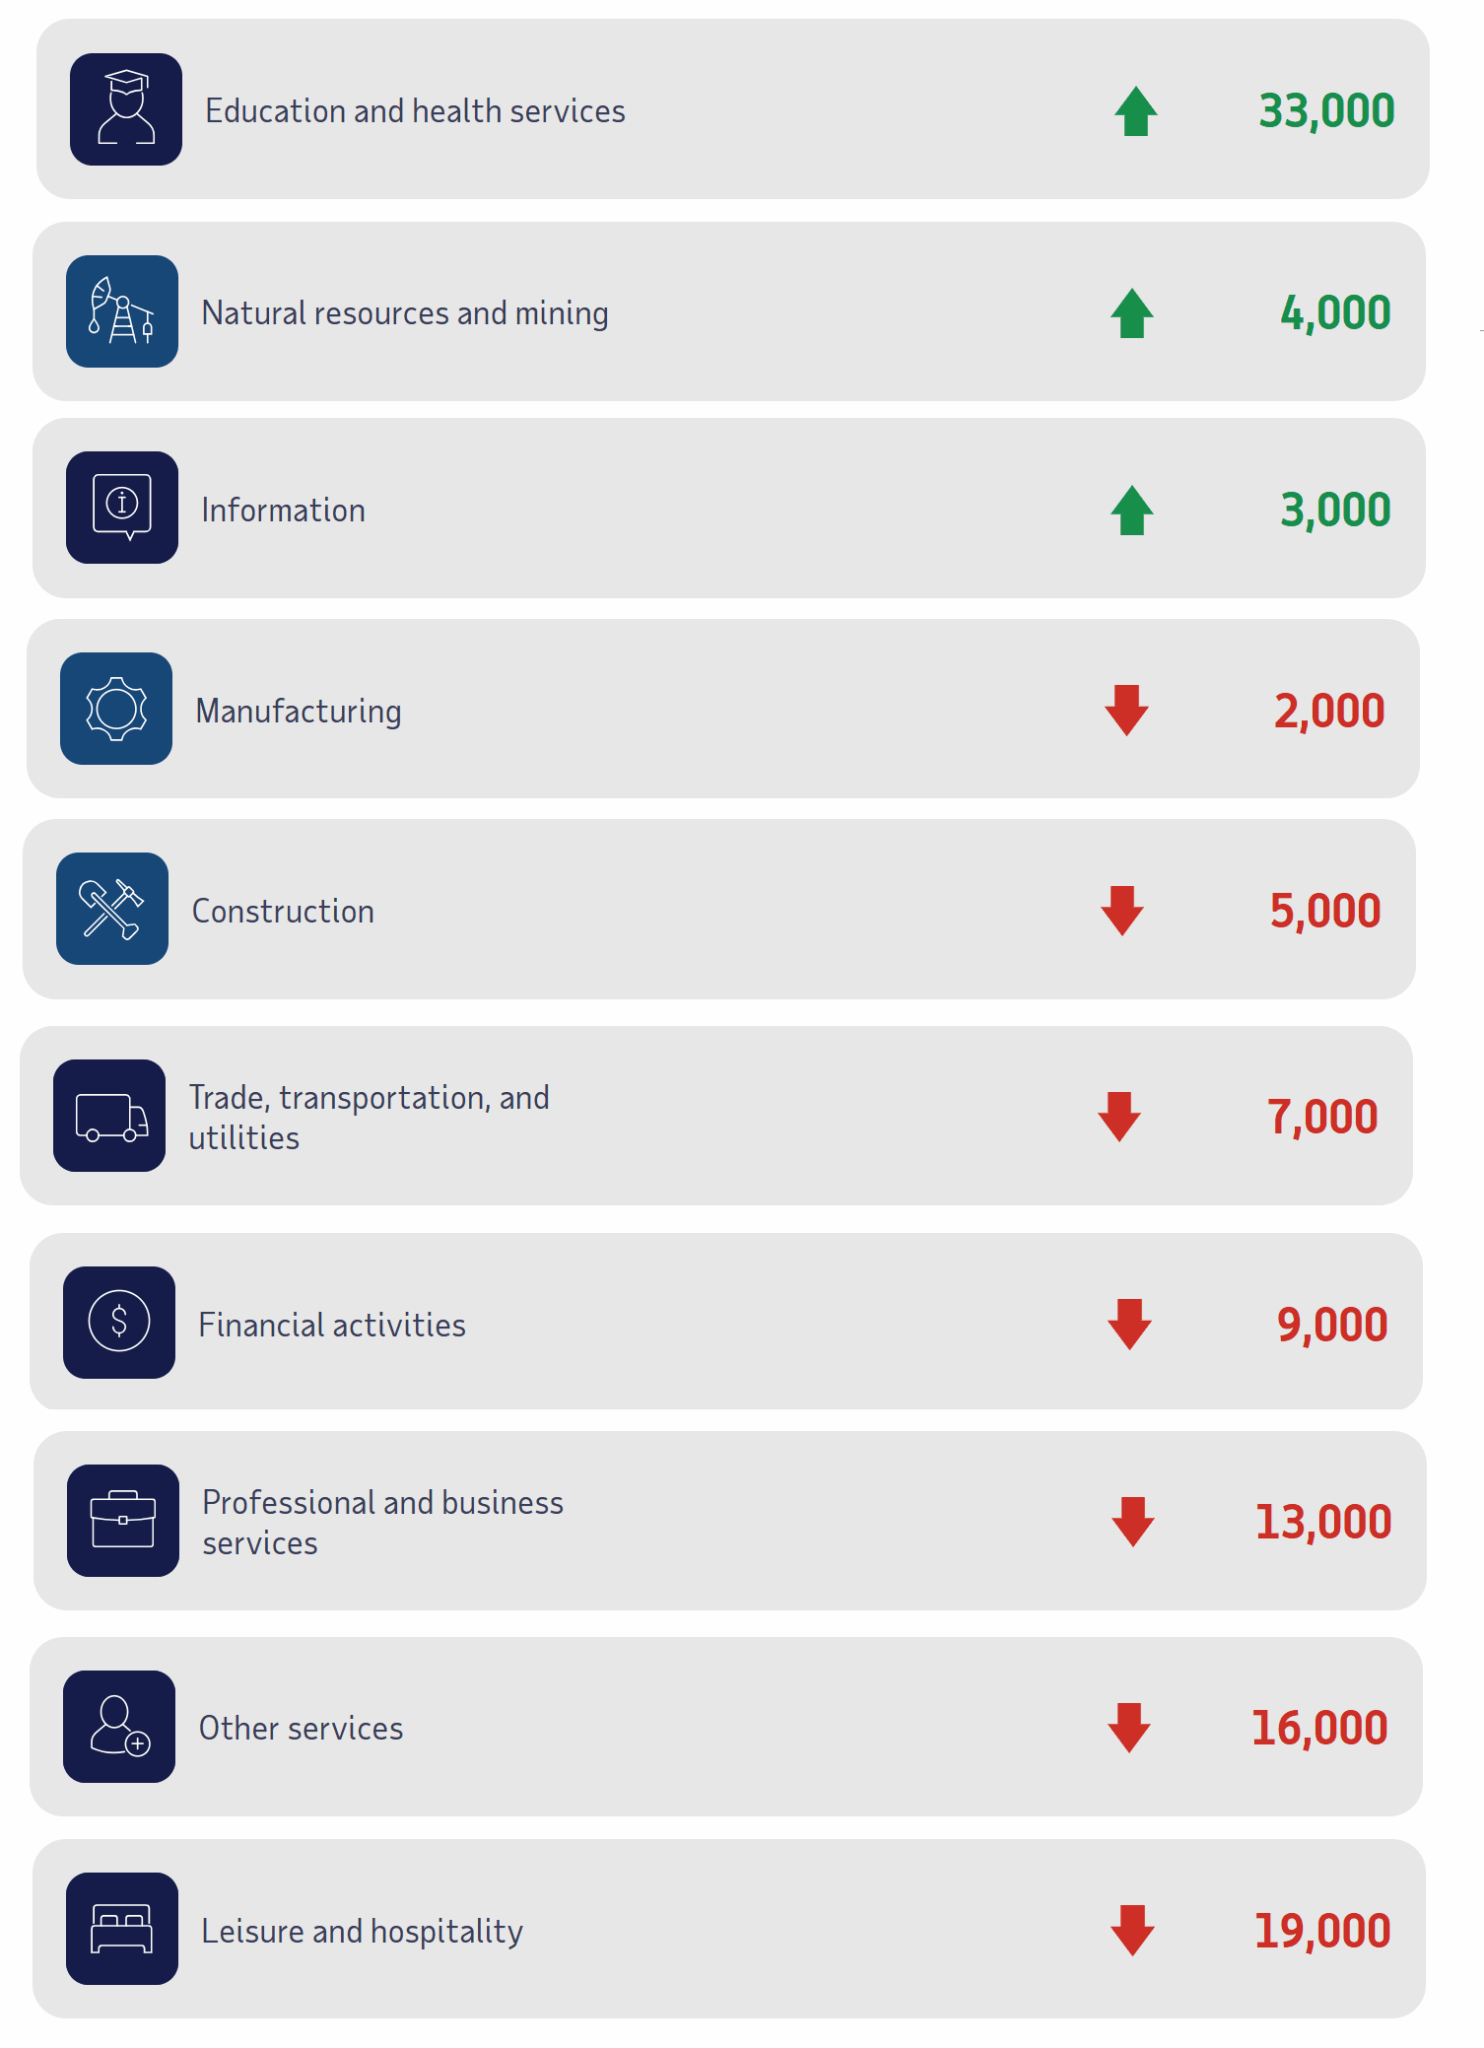
The jobs report came in much higher than expected, with an uncharacteristic adjustment upward for the previous month’s numbers (April). The biggest gainer was Leisure and hospitality, gaining 70,000 jobs. Job losses occurred in insurance carriers and related activities (-11,000) and commercial banking (-3,000).
According to the Commissioner of the U.S. Bureau of Labor Statistics:
“Total nonfarm payroll employment increased by 172,000 in May, and the unemployment rate was unchanged at 4.3 percent, the U.S. Bureau of Labor Statistics reported today. Job gains occurred in leisure and hospitality, local government, and health care. Employment in financial activities declined…
The number of people jobless less than 5 weeks declined by 286,000 to 2.2 million in May, largely offsetting an increase in the prior month. The number of long-term unemployed (those jobless for 27 weeks or more) was little changed over the month at 2.0 million but is up by 524,000 over the year. The long-term unemployed accounted for 27.5 percent of all unemployed people in May.”
So, despite declines in Government employment, overall employment still increased.
As usual, they are talking about “Seasonally Adjusted Jobs”.
Looking at the Unadjusted Establishment Survey report we see…
Originally, the BLS reported employment of 158.695 million for April, which they have since adjusted upward to 158.726 million, an increase of 31,000. Current May numbers are 159.467 million for an increase of 741,000 jobs based on their current numbers or +772,000 based on the original numbers.
Note: According to Politifact, “The federal workforce grew by about 4.8% during Biden’s term, increasing from 2.89 million in January 2021 to 3.02 million in January 2025.”
So, Trump has reduced the federal payroll by more than twice what it gained under Biden. Although this does reduce budget pressure, it also puts pressure on the job market for those who are seeking other employment. It is estimated that between 30-40% of these workers retired, while perhaps 10-15% were working spouses who chose to stay home rather than seek other employment.
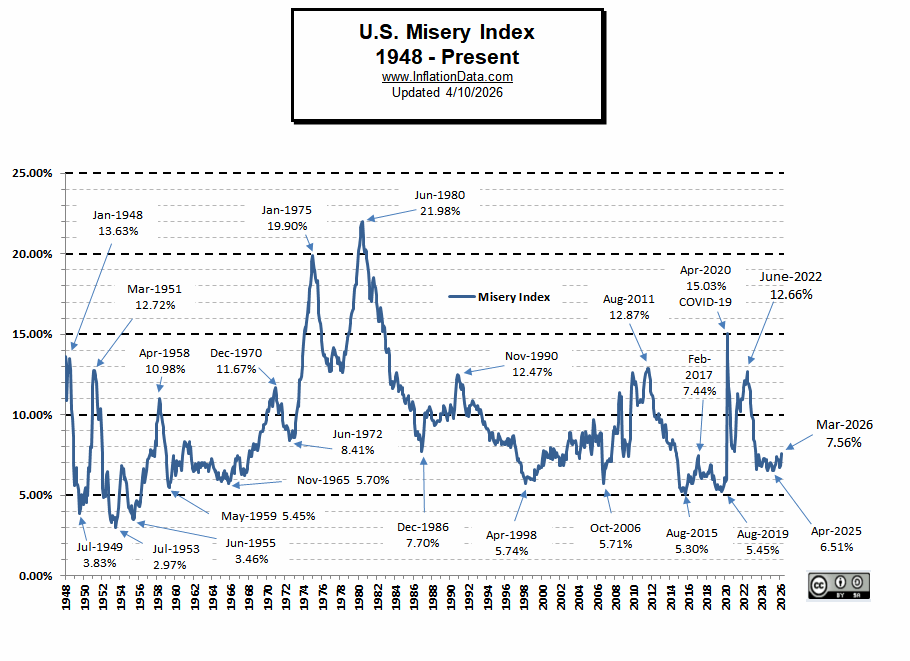 The Fed’s Impossible Position