
Inflation jumped to 3.3% in the latest CPI report, up sharply from 2.4% the prior month. This rapid increase comes on top of the gradual rise in unemployment since its 2023 lows. This leaves the Federal Reserve with no easy options.
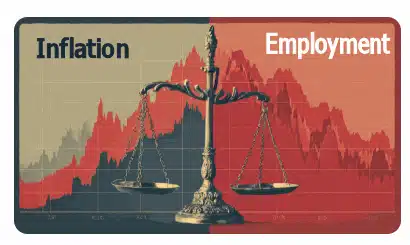
The FED’s Dual Mandate
This situation is making it increasingly difficult for the Federal Reserve to manage both sides of its dual mandate. The Fed is legally required to pursue two often competing goals: keeping inflation low and stable, and maintaining maximum employment. In normal times, these goals are two sides of a “see-saw”. Increasing the money supply reduces unemployment but increases inflation, and vice versa.
But when inflation surges at the same time the labor market begins to weaken, the Fed finds itself pulled in opposite directions with no clean policy solution. Economists have a word for this combination of stagnating growth, rising unemployment, and persistent inflation: stagflation. It is widely considered one of the most difficult economic environments for policymakers to navigate, as the tools used to fight inflation typically make unemployment worse. That is precisely where we find ourselves today.
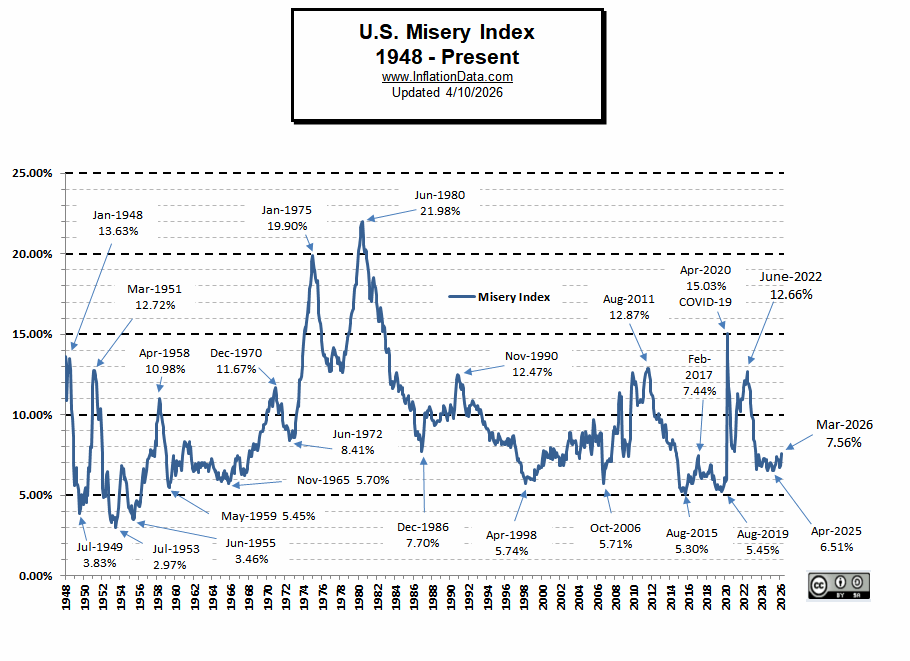
Misery Index Jumps to 7.56%
The human cost of rising inflation shows up clearly in the Misery Index, which simply adds the unemployment rate to the inflation rate to measure everyday economic stress. In March 2026, the Misery Index rose sharply from 6.81% to 7.56%, driven entirely by the surge in inflation. With unemployment at 4.30% and inflation at 3.26%, Americans are feeling the squeeze from both directions — higher prices at the same time the job market is quietly softening.
 The Fed’s Impossible Position
 The Fed’s Impossible Position
Because the Federal Reserve is responsible for both goals, when inflation rises, the Fed raises rates. When unemployment rises, the Fed cuts rates. The problem facing policymakers right now is that both metrics are moving in the wrong direction at the same time.
Markets are currently pricing in a 98% chance that the Fed holds rates steady in late April, with over a 90% probability that no rate cuts arrive until October at the earliest. Cutting into rising energy prices would risk reigniting inflation, while holding rates high too long risks allowing a weakening labor market to deteriorate further.
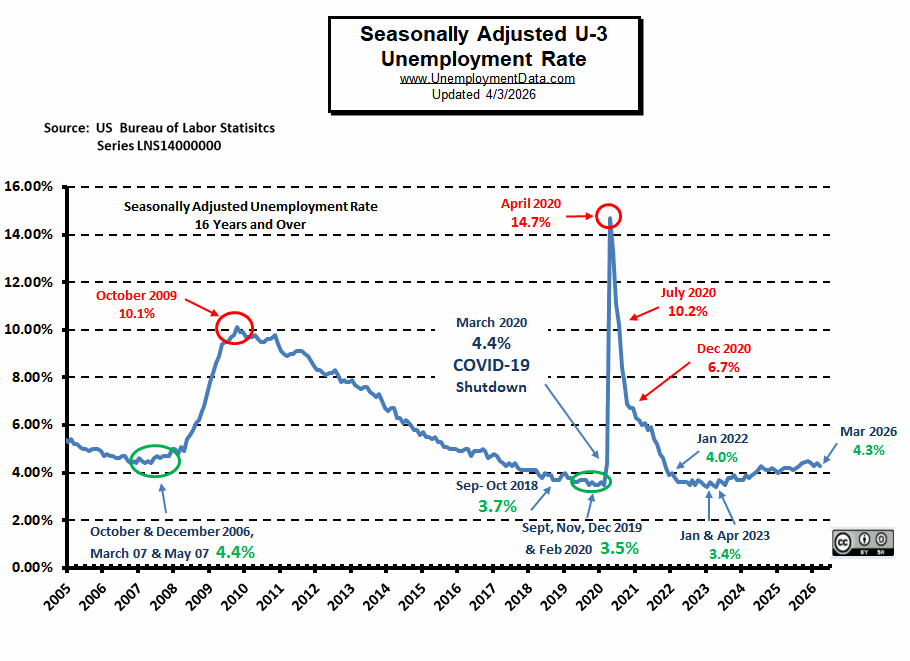
Labor Market Weakness Hiding in Plain Sight
On the surface, the unemployment rate appears relatively stable. But beneath that headline number, the data tells a more concerning story. Hiring is falling, job openings are declining, and the conditions for a more significant rise in unemployment are quietly building, in part due to increasing productivity created by AI. The one bright spot is the Deflationary forces created by AI.
Historically, it is falling asset prices that trigger layoffs — not the other way around. Once layoffs begin to pick up in an environment where hiring has already slowed, the unemployment rate can rise quickly and in a nonlinear fashion. That cycle has not yet been triggered, but the underlying conditions are moving in that direction.
A Late Business Cycle Warning
The combination of supply-driven inflation and a softening labor market is a hallmark of late business cycle environments. Energy prices, constrained by geopolitical supply pressures rather than surging demand, are pushing inflation higher at precisely the moment the economy can least afford it.
In past business cycles, this dynamic has preceded recessions. The Fed finds itself unable to ease policy to support employment without risking another inflation surge — a position that historically has made it difficult to avoid a meaningful rise in unemployment once the labor market begins to crack.
What to Watch
The unemployment rate remains the key indicator to monitor in the months ahead. If layoffs accelerate while hiring remains depressed, the unemployment rate could rise faster than many expect. The Fed’s ability to respond will be constrained as long as inflation remains elevated, meaning the labor market may bear the brunt of a policy environment that has run out of easy options.
You might also like: