• Skip to primary navigation
  • Skip to main content
  • Skip to primary sidebar
  • Home
  • Contact us
  • Related Sites
    • InflationData.com
    • Financial Trend Forecaster
    • Your Family Finances
    • Elliott Wave University
    • Optio Money
  • About
    • Terms of Use
    • Disclaimer & Disclosure
    • Privacy Statement
  • Sitemap
    • 2009-2010 Posts
    • 2011 Posts

UnemploymentData.com

Your Source for Employment and Unemployment Data

Unemployment
  • Charts
    • Current Unemployment Rate Chart
    • Current Employment (Chart and Data)
    • Current Employment vs Unemployment Chart
    • Historical Employment Data
    • Employment Population Ratio
    • Misery Index
  • Unemployment
    • Historical Unemployment Rate Tables
    • What Is U-6 Unemployment?
    • Unadjusted vs. Seasonally Adjusted U-3 Unemployment Rate
    • BLS vs. Gallup Unemployment Numbers
    • Current U-6 Unemployment Rate
    • What is the Labor Force Participation Rate?
    • What is the Real Unemployment Rate?
  • Employment
    • Current Employment (Chart and Data)
    • Historical Employment Data
    • Contacting a Live Person at the State Employment Commission
      • How to Talk to a Live Person at the Virginia Unemployment Commission
      • Florida’s FLUID Unemployment Program
    • Benefits
      • Insurance
      • Retirement
    • Careers
    • Employment Costs
    • Experience
    • Government
    • Job Hunting
      • Interview
      • Resume
  • Education
    • Skills
  • General
    • Small Business
      • Outsourcing
    • Success
  • Search
You are here: Home / Archives for Unemployment

Unemployment

May Unemployment Data

June 5, 2015 by Tim McMahon

unemployment_rate_May_2015The U.S. Bureau of Labor Statistics (BLS) released the newest unemployment data for May 2015 on Friday June 5th. According to the BLS, the current “Seasonally Adjusted” Unemployment Rate for May is 5.5% up from April’s 5.4%. The BLS reported the “Unadjusted” Unemployment Rate is 5.3% which is lower than October’s unadjusted 5.5% and January’s 6.1% but up from April’s 5.1%.  See Current Unemployment Chart for more information.
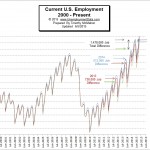
U.S. Employment-2000- May 2015The BLS “preliminary estimates” for the employment situation for the month of May 2015 include 142.420 million jobs reported for May 2015. That was up 970,000 from April. But at the same time they revised the numbers for April down by 12,000. See Current Employment Commentary for more information.
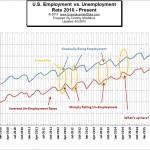
Employment vs UnemploymentWhen looking at employment vs. unemployment  you would think that they would simply be the inverse of each other. Flip one over and you have the other. But the U.S. Bureau of Labor Statistics (BLS) actually uses two entirely different surveys to calculate them. So by [Read more…] about May Unemployment Data

Filed Under: Unemployment Tagged With: employment, unemployment

March 2015 Unemployment Flat

April 3, 2015 by Tim McMahon

The U.S. Bureau of Labor Statistics (BLS) released the March Unemployment figures on Friday April 3rd. According to the BLS the Current Unemployment Rate (Seasonally adjusted) for March was 5.5% unchanged from February. The Unadjusted Unemployment rate however fell from 5.8% to 5.6%. However, according to Gallup the Unadjusted Unemployment rate was actually 6.5% and the U-6 unemployment rate was 15.6% down from 16.1% in February.

Unemployment Numbers According to Gallup


Unadjusted U-3 Unadjusted U-6
BLS 5.6% 11.0%
Gallup 6.5% 15.6%
Difference 0.9% 4.7%

Once again the BLS numbers are quite a bit different than the [Read more…] about March 2015 Unemployment Flat

Filed Under: Unemployment Tagged With: 2015, BLS, Data, March, unemployment

100,000 Layoffs and Counting: Is this the New Normal?

March 19, 2015 by Guest Contributor

Oil JobsThis time a year ago, the oil industry’s biggest problem was finding a way to deal with the “retirement tsunami” about to crash down on it as older oilfield workers hung up their cork boots to enjoy freedom-55. Now, with oil prices still in the doldrums, many of those same workers are lucky to be hanging onto their jobs, while others have been booted from the payroll as an ugly wave of layoffs takes hold.

One of the worst-affected areas is [Read more…] about 100,000 Layoffs and Counting: Is this the New Normal?

Filed Under: Unemployment Tagged With: employment, jobs, Oil

BLS Releases February Unemployment Numbers

March 6, 2015 by Tim McMahon

The U.S. Bureau of Labor Statistics (BLS) released the February Unemployment figures on Friday March 6th. According to the BLS the Current Unemployment Rate (Seasonally adjusted) for February was 5.5% down from 5.7% in January. Along the same lines we see the Unadjusted Unemployment rates fall from 6.1% to 5.8%.  However, according to Gallup the Unadjusted Unemployment rate was actually 6.7% and the U-6 unemployment rate was 16.1%.

Unemployment Numbers According to Gallup


Unadjusted U-3 Unadjusted U-6
BLS 5.8% 11.4%
Gallup 6.7% 16.1%
Difference 0.9% 4.7%

Once again the BLS numbers are quite a bit different than the [Read more…] about BLS Releases February Unemployment Numbers

Filed Under: Unemployment Tagged With: employment, unemployment

The Big Lie – Part 2

February 13, 2015 by Elliott Wave International

Last week we published an article titled Gallup Head Says Unemployment Rate is “A Big Lie” in it we said that, the big news is that Jim Clifton the CEO of Gallup said that unemployment is really closer to 9%. Here’s what he said:

There’s no other way to say this. The official unemployment rate, which cruelly overlooks the suffering of the long-term and often permanently unemployed as well as the depressingly underemployed, amounts to a Big Lie.

Today the editors of Elliott Wave International look at the implications of that statement and how it relates to inflation and deflation. ~Tim McMahon, editor

The “Big Lie” About the U.S. Jobs Picture

Some 30 million people are either out of work or severely underemployed

By Elliott Wave International

Editor’s note: You’ll find the text version of the story below the video.

Get Your FREE Special Report: What You Need to Know
NOW About Protecting Yourself from Deflation »

The financial media has recently featured stories with an upbeat outlook for the U.S. economy.

For example: The economy is on track for “the fastest growth in a decade” (Associated Press), and “Experts expect jobs aplenty in ’15” (USA Today).

This upbeat tone is related to December’s U.S. jobless rate of 5.6%, its lowest since June 2008.

But [Read more…] about The Big Lie – Part 2

Filed Under: Unemployment Tagged With: 5.6% Jobless, Deflation, Lie, unemployment

A Changing Economy = Changing Job Opportunities

November 10, 2014 by John Mauldin

​In a recent issue of Outside the Box author John Mauldin told a story of life when he was growing up and how it created an opportunity for him to earn some extra money while he was going to college. But today things have changed so much that young people today don’t even understand what he is talking about.

With technology changing so rapidly, if you want a good job, it is critical that you keep up… and so with that lets look at life in 1958 from John’s perspective.  ~Tim McMahon, editor [Read more…] about A Changing Economy = Changing Job Opportunities

Filed Under: Unemployment

BLS Releases August Unemployment: 6.1% Down from 6.2% in July

September 6, 2014 by Tim McMahon

The U.S. Bureau of Labor Statistics (BLS) released the August Unemployment figures on September 5th. The Seasonally Adjusted Unemployment Rate was 6.2% up from 6.1% in June. The Unadjusted Unemployment rate was also down from 6.5% in July to 6.3% in August.

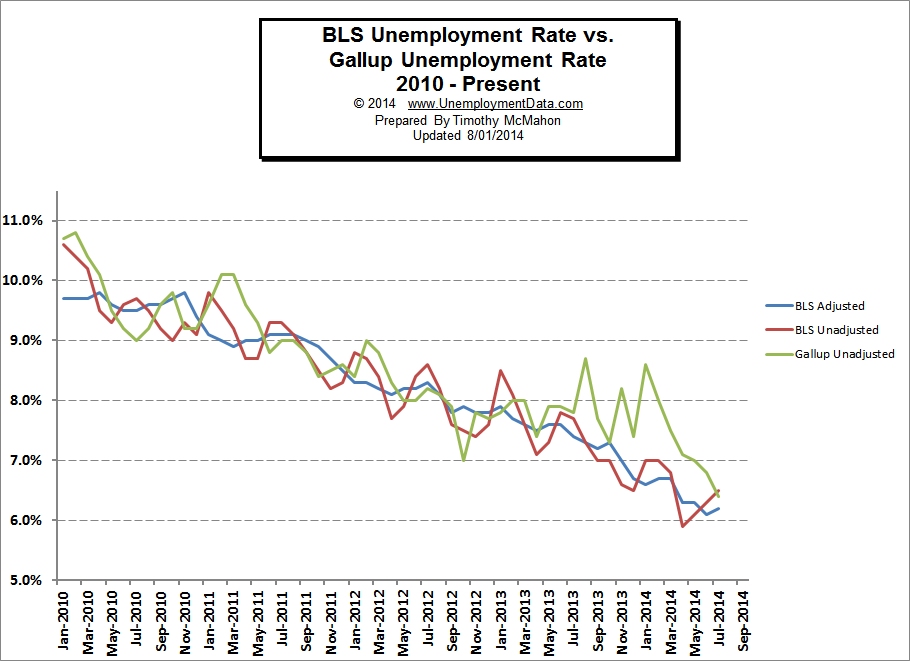
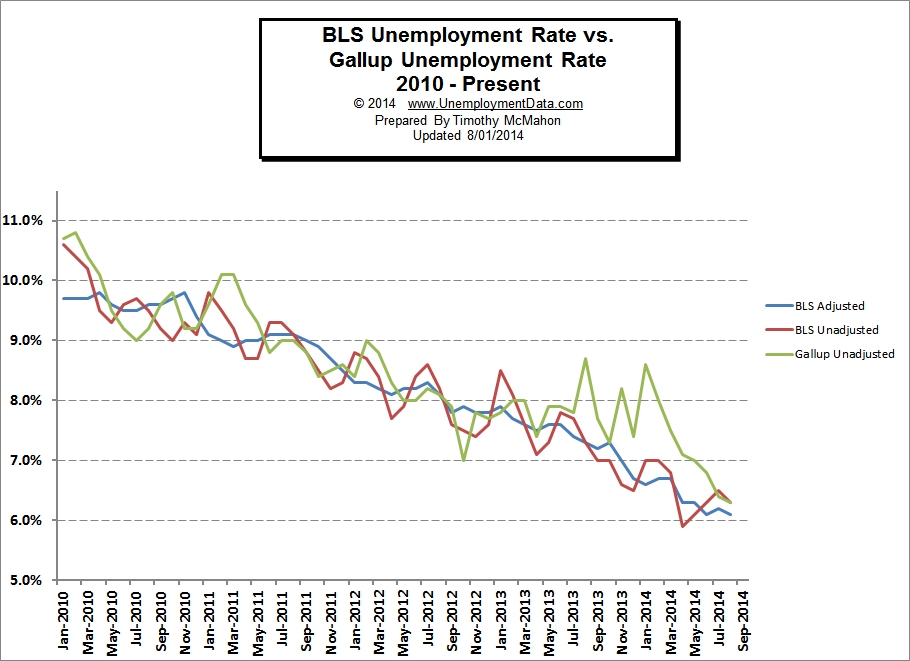
BLS vs GallupIn another rare occurrence, the BLS seasonally adjusted numbers are actually identical to the Gallup numbers for the first time since September 2011. In the interim the BLS has been lower than the Gallup numbers 24 times and Gallup has been lower 9 times. The average difference when the BLS is lower is  0.6% but when Gallup is lower the average has only been 0.3%. So in addition to BLS being lower more often it is also lower by more indicating some sort of bias to the downside. But perhaps the BLS is mending their ways since last month and this month have resulted in the BLS and Gallup being well within a normal margin of error. [Read more…] about BLS Releases August Unemployment: 6.1% Down from 6.2% in July

Filed Under: Unemployment

BLS Releases July Unemployment: 6.2% Up from 6.1% in June

August 1, 2014 by Tim McMahon

The U.S. Bureau of Labor Statistics (BLS) released the July Unemployment figures on August 1st. The Seasonally Adjusted Unemployment Rate was 6.2% up from 6.1% in June. The Unadjusted Unemployment rate was also up from 6.3% in June to 6.5% July. Of course the spin-doctors at the BLS said it was “virtually unchanged”.

BLS vs Gallup Unemployment NumbersIn a surprising turn of events, the unadjusted BLS numbers actually agree with the Gallup numbers with the rare occurrence that the BLS numbers are actually higher than the Gallup numbers for the first time in 17 months.

Of course, we shouldn’t get too excited because the “adjusted numbers” are still a bit on the low side and the smoke and mirrors coming out of the BLS have simply shifted to the Employment numbers.

Employment Numbers

According to the commissioner of the Bureau of Labor Statistics monthly report, “Total non-farm payroll employment increased by 209,000 in July, the same as its average monthly gain over the prior 12 months. In July, employment grew in professional and business services, manufacturing, retail trade, and construction.”

So we might begin to wonder if Employment went up, how did unemployment also go up? Of course, the [Read more…] about BLS Releases July Unemployment: 6.2% Up from 6.1% in June

Filed Under: Unemployment Tagged With: employment, unemployment

February’s US Unemployment Statistics [Infographic]

March 18, 2014 by Lisa McMahon

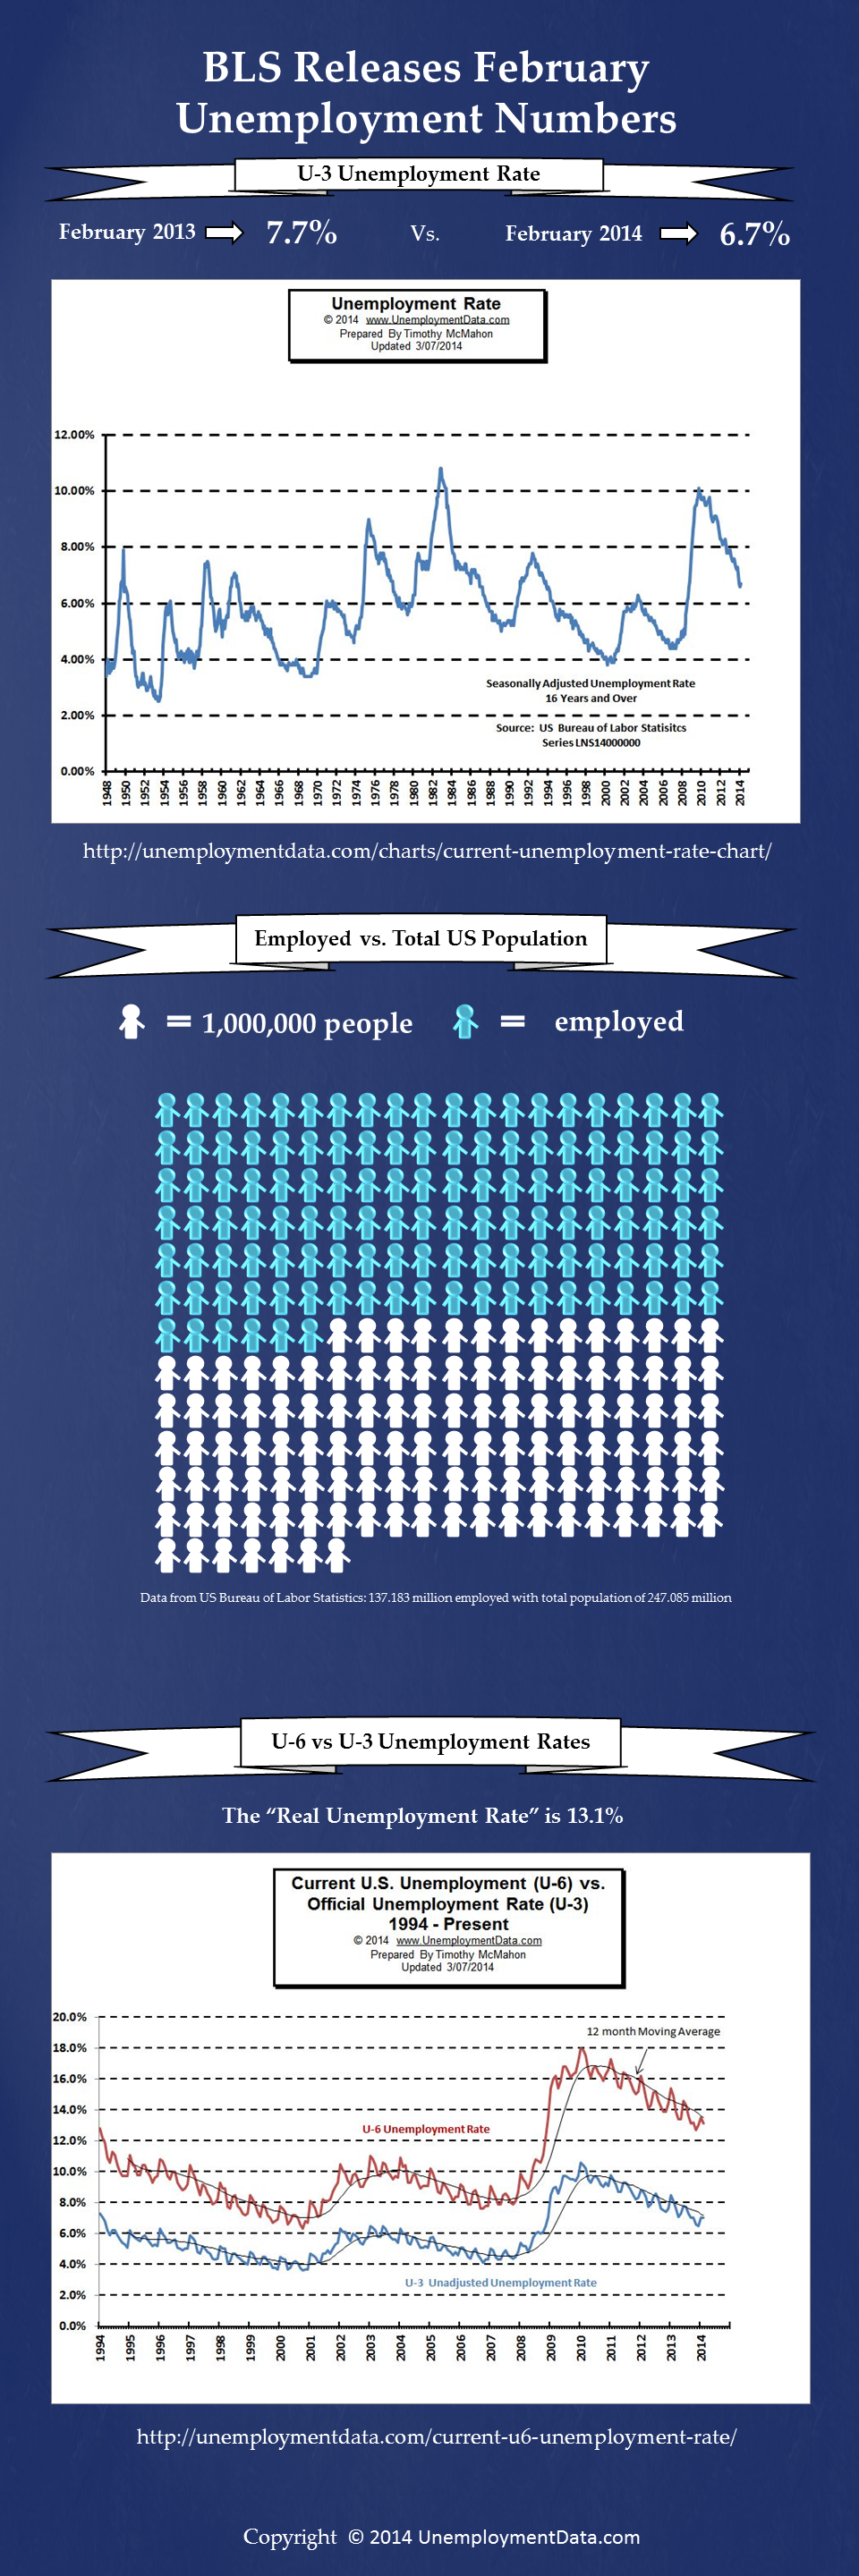
For those of you who are more visual thinkers and like to see pictures rather than read a bunch of numbers, here’s an infographic we’ve created to illustrate the important statistics for February 2014 from the US Bureau of Labor Statistics.

February 2014 US Unemployment statistics
Click for larger image. Permission is granted to share this image as long as it is not altered.

If you wish to embed this graphic on your own site, please use the following code:

<a href=”https://unemploymentdata.com”><img alt=”February 2014 US Unemployment statistics” src=”https://unemploymentdata.com/wp-content/uploads/2014/03/Feb2014Unemployment.png” width=”576″ height=”1728″ /></a>

Filed Under: Unemployment

BLS Releases February Unemployment Numbers

March 7, 2014 by Tim McMahon

Bureau of Labor Statistics Unemployment Data:

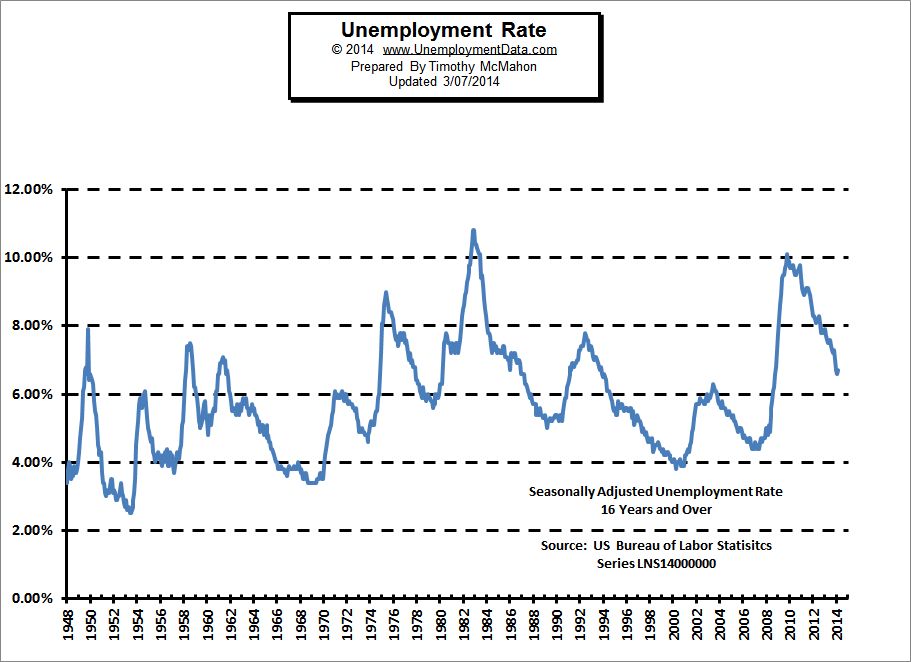
Current Unemployment Rate

The U.S. Bureau of Labor Statistics (BLS) released the Unemployment numbers today.  According to the government agency the current “Seasonally Adjusted Unemployment rate is 6.7% up slightly from January’s 6.6%. The unadjusted unemployment rate was unchanged at 7%. The broadest measure of unemployment which includes discouraged workers called U-6 was at 13.1% down from 13.5% last month.


Gallup Unemployment Data:

Amid concern about the reliability of the BLS numbers, four years ago, Gallup Poles decided to begin tracking unemployment numbers themselves. So we have an alternative to the Government numbers. According to Gallup the adjusted unemployment rate is 7.6% and the Unadjusted unemployment rate is 8.0%. But the real difference comes with the U-6  which Gallup calls the “Underemployment rate” at 17.5% it is a full 4.4% higher than the government sanctioned numbers. [Read more…] about BLS Releases February Unemployment Numbers

Filed Under: Unemployment

  • « Go to Previous Page
  • Page 1
  • Interim pages omitted …
  • Page 3
  • Page 4
  • Page 5
  • Page 6
  • Page 7
  • Interim pages omitted …
  • Page 9
  • Go to Next Page »

Primary Sidebar

Rate Any Stock In Seconds

Get a detailed stock report showing its true value, safety score, and ideal timing to buy. Plus, receive a color coded Buy, Sell, or Hold recommendation.

Get Your Free Stock Analysis Here.

Recent Posts

  • Will AI Really Destroy Jobs?
  • Jobs Report for August 2026
  • BLS Employment Report for July 2026
  • BLS Employment Situation Summary for June 2026
  • BLS Releases May 2026 Jobs Report

Search Site

Resources

  • Bureau of Labor Statistics Current Population Survey Monthly survey of households conducted by the Bureau of Census for BLS. It provides data on the labor force, employment, unemployment, etc.
  • Capital Professional Services Providing web design and development and Internet marketing services
  • Elliott Wave University Using the Elliott Wave Principle to improve investment performance
  • Financial Trend Forecaster Featuring Moore Inflation Predictor, NYSE Rate of Change and NASDAQ Rate of change
  • InflationData.com Inflation calculators, databases, etc.
  • Intergalactic Web Designers Web design and development services

Articles by Category

Articles by Date

Disclaimer

At UnemploymentData.com we are not registered investment advisors and do not provide any individualized advice. Past performance is not necessarily indicative of future performance and future accuracy and profitable results cannot be guaranteed.

Privacy & Terms of Use

Privacy Statement & Terms of Use

Do Not Sell My Information

Copyright © 2026 · News Pro on Capital Professional Services, LLC. All rights reserved · Log in