
The U.S. Bureau of Labor Statistics (BLS) released its
September employment / unemployment report on October 2nd, 2026.
Employment / Unemployment
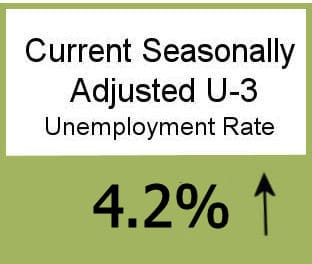
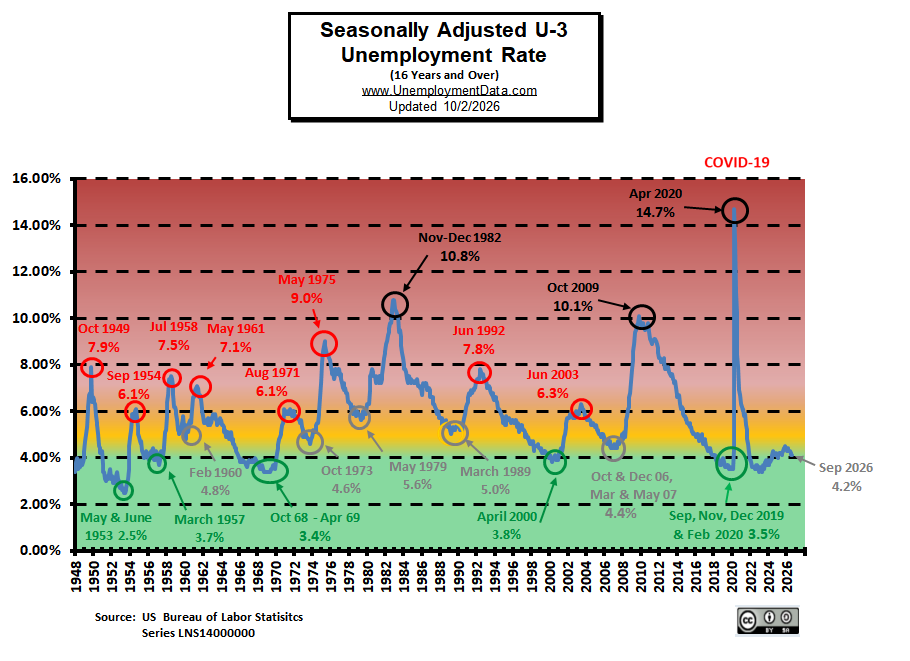
- Seasonally Adjusted U-3 is 4.2% up from 4.1%
- Unadjusted U-3 is 4.0% down from 4.3%
- Unadjusted U-6 is 7.3% down from 7.8%
- Labor Force Participation is 61.8% up from 61.6%
- Unadjusted Employment rose from 158.905 million to 159.238 million
- Next Update: November 6th, 2026
Summary:
The Adjusted U-3 was up for the month, but UNADJUSTED U-3 was Down. UNADJUSTED U-6 was down and Employment was UP. Some commentators were disappointed in the BLS report, but ADP economist Nela Richardson said, “It’s a strong report” regarding the ADP numbers. Over the past few months, there has been a surprising surge in employment among the less educated. (see below).
According to the Commissioner of the U.S. Bureau of Labor Statistics:
“Both nonfarm payroll employment (+29,000) and the unemployment rate (4.2 percent) changed little in September, the U.S. Bureau of Labor Statistics reported today. Employment in all major industries changed little over the month…
…Health care employment continued its upward trend in September (+17,000), but at a slower pace than the average monthly gain over the prior 12 months (+33,000). In September, employment continued to trend up in ambulatory health care services (+13,000) and in hospitals (+12,000), while nursing and residential care facilities lost jobs (-9,000).”
As usual, they are talking about “Seasonally Adjusted Jobs”.
Looking at the Unadjusted Establishment Survey report, we see…
The BLS is currently reporting a rise from 158.905 million to 159.238 million, or 333,000. But last month they originally reported employment was 158.880 million, so it actually rose from 158.880 to 159.238 million, or 358,000.
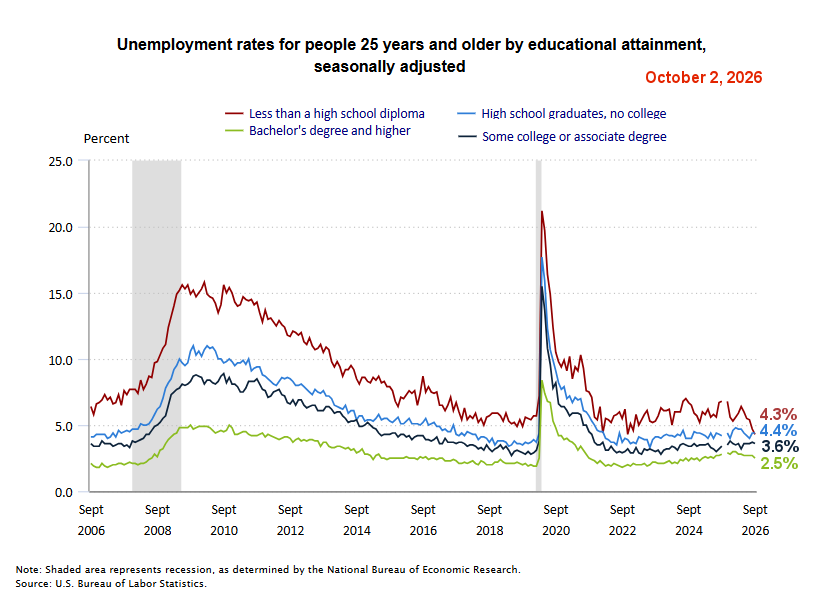
Unemployment by Education
This month one of the most interesting developments is the Unemployment by Education numbers. In September for the first time in 20 years (maybe ever) the unemployment rate for those with less than a Highschool diploma was actually lower (4.3%) than those with a Highschool diploma (4.4%). Note the massive decline in the Red Line in the chart below.
The only reason I can think of for this state of events is that the massive reduction in illegals has reduced the supply of uneducated labor. If the illegals were working “on the books” the unemployment rate would have stayed the same. But if they were working “off the books” and now the employers must hire someone “on the books” the unemployment rate would show what we see here. This will probably result in higher wages for those employed legally since the employers will be required to actually pay the mandated minimum wage.
Current Unemployment Rate Chart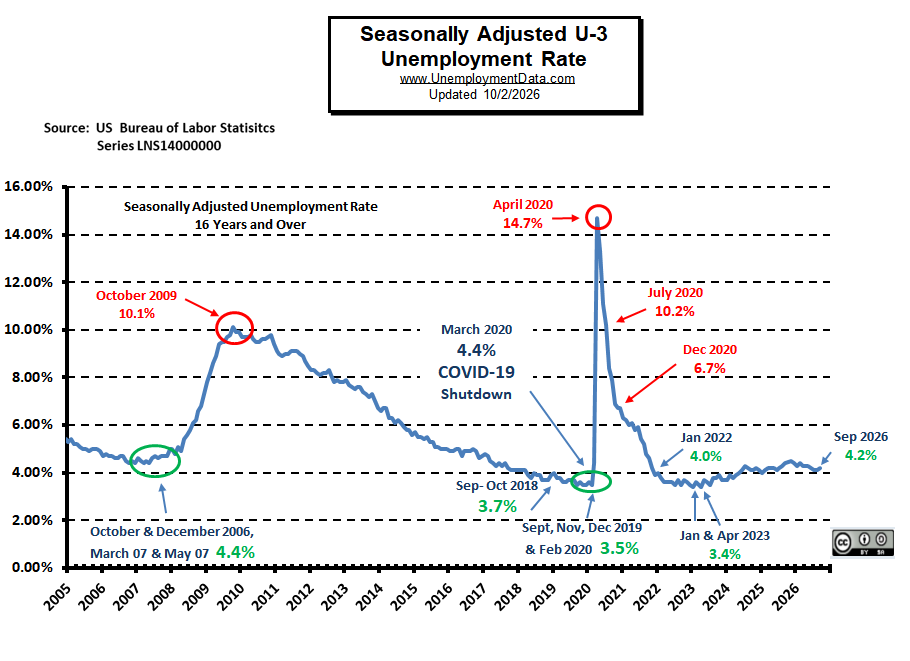
Current Employment Chart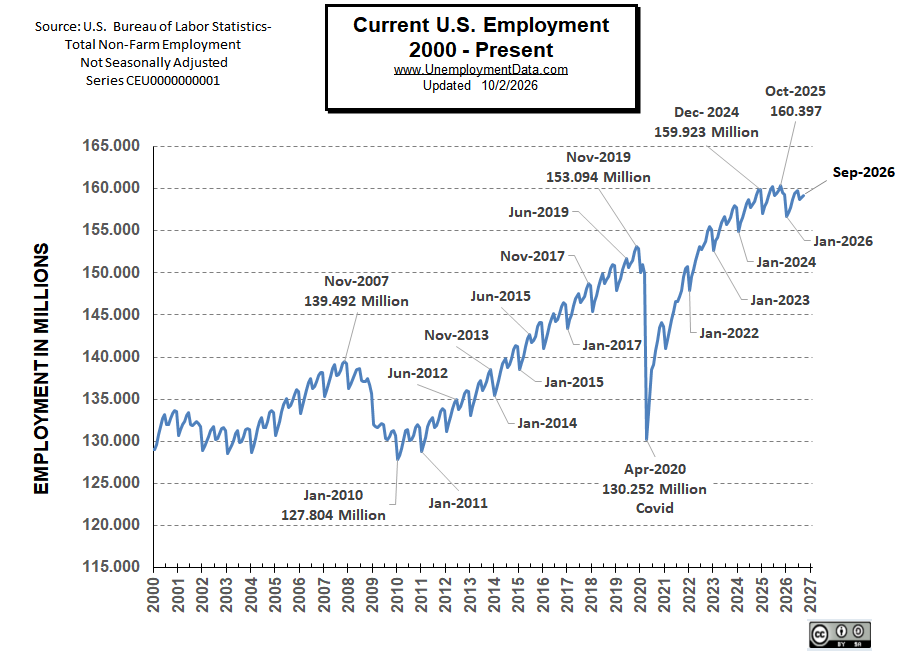
BLS: September 2026 Employment by Sector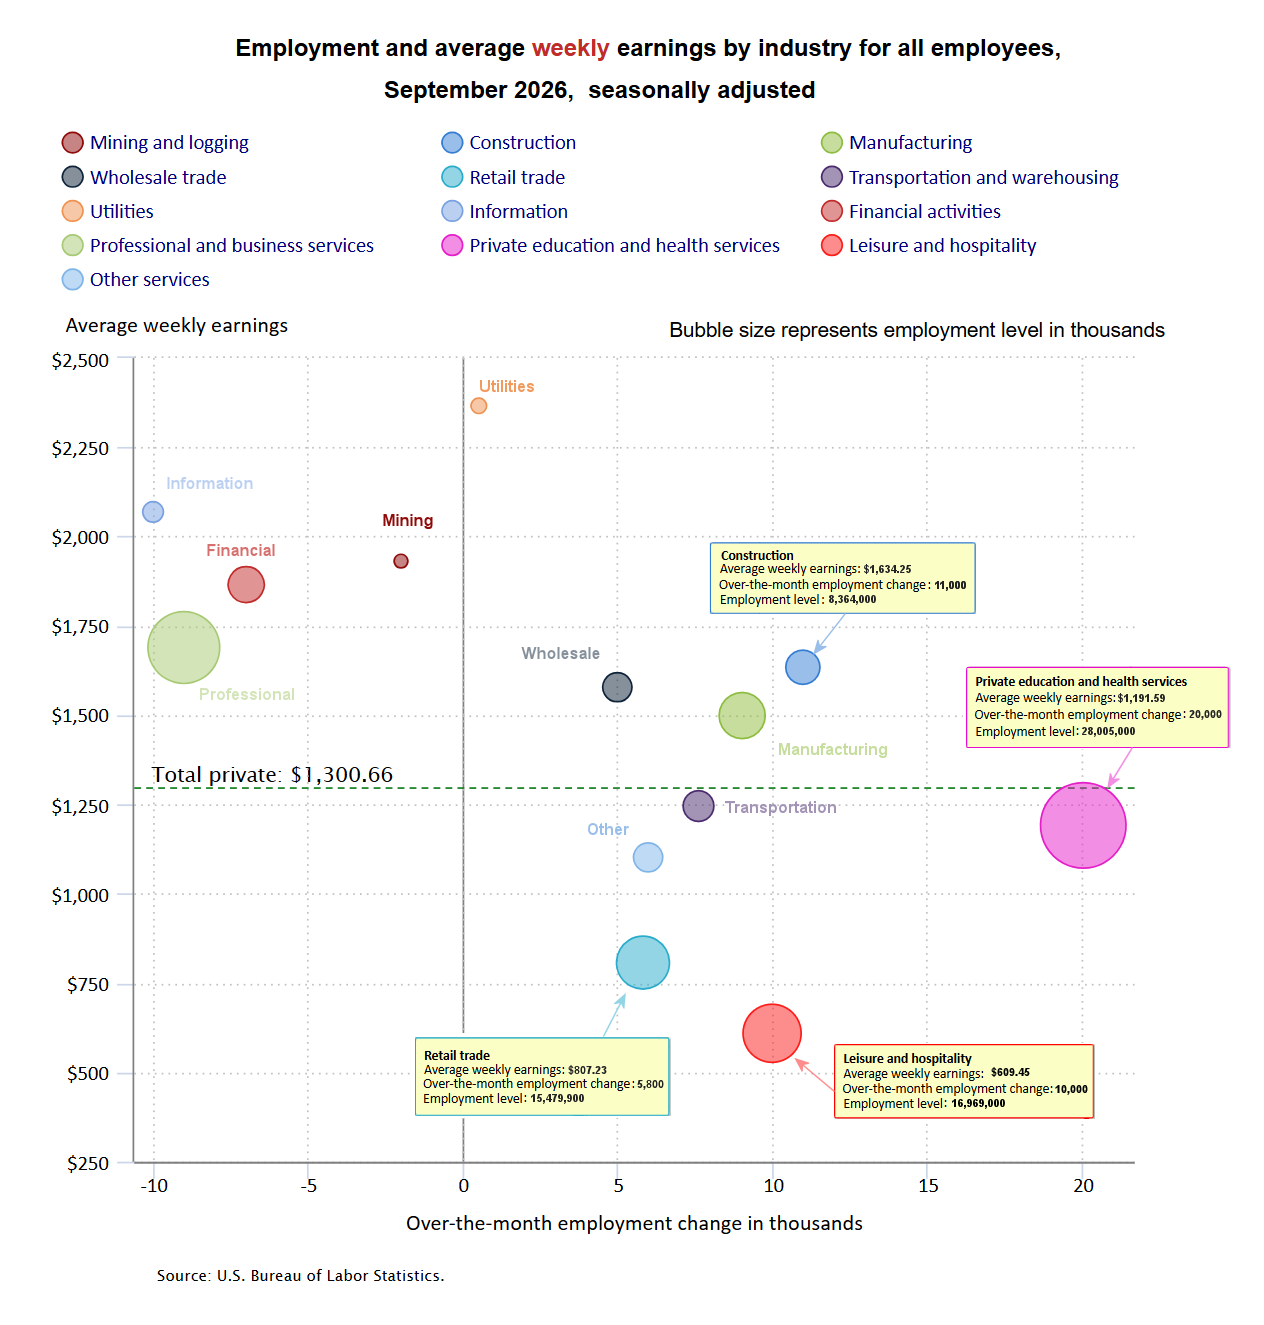
Looking at the above chart based on the BLS “Establishment Survey”, we can see that 4 sectors didn’t show employment growth in September. Information lost -10,000 jobs, Professional and Business Services lost -9,000 jobs, Financial Activities lost -7,000 jobs, and Mining and Logging lost -2,000 jobs. On the other hand, Education gained 20,000 jobs, Leisure and Hospitality gained 10,000 jobs, Retail gained 5,800 jobs and Construction gained 11,000 jobs.
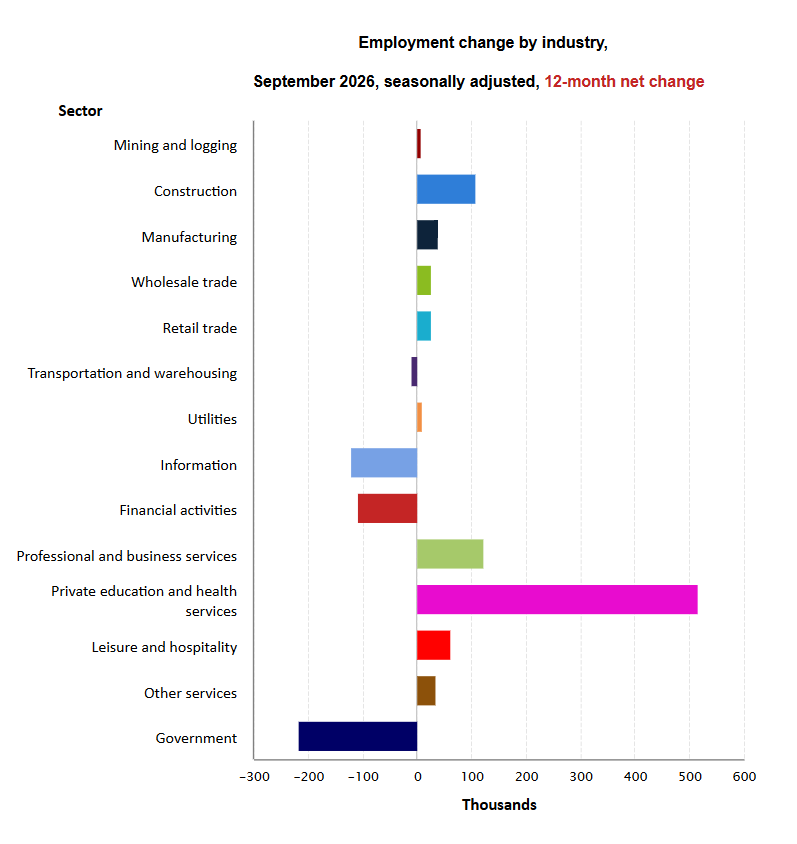
Looking at it on an annual basis we see the major gainer was Education and Health. And the biggest reduction was in Government:
BLS Average Weekly Wages
| Date | Average Weekly Wage |
|---|---|
| September 2026 | $1,300.66 |
| August 2026 | $1,298.94 |
| July 2026 | $1,291.05 |
| June 2026 | $1,289.34 |
| May 2026 | $1,285.91 |
| April 2026 | $1,283.16 |
| March 2026 | $1,277.37 |
| February 2026 | $1,278.36 |
| January 2026 | $1,274.25 |
| December 2025 | $1,266.08 |
| November 2025 | $1,269.10 |
| October 2025 | $1,260.27 |
| September 2025 | $1,255.14 |
| August 2025 | $1,252.40 |
| July 2025 | $1,247.27 |
| June 2025 | $1,243.51 |
| May 2025 | $1,240.78 |
| April 2025 | $1,238.92 |
| March 2025 | $1,234.96 |
| February 2025 | $1,229.15 |
| January 2025 | $1,222.14 |
| December 2024 | $1,224.17 |
| November 2024 | $1,221.08 |
| October 2024 | $1,212.73 |
| September 2024 | $1,212.16 |
| August 2024 | $1,208.05 |
| July 2024 | $1,199.74 |
| June 2024 | $1,200.84 |
| May 2024 | $1,196.73 |
| April 2024 | $1,188.79 |
| March 2024 | $1,191.96 |
| February 2024 | $1,187.49 |
| January 2024 | $1,178.87 |
| December 2023 | $1,179.58 |
| November 2023 | $1,175.45 |
| October 2023 | $1,168.94 |
| September 2023 | $1,169.94 |
| August 2023 | $1,165.82 |
| July 2023 | $1,161.06 |
| June 2023 | $1,158.94 |
| May 2023 | $1,152.40 |
| April 2023 | $1,149.99 |
| March 2023 | $1,144.49 |
| February 2023 | $1,143.68 |
| January 2023 | $1,142.49 |
| December 2022 | $1,133.14 |
| November 2022 | $1,132.29 |
| October 2022 | $1,131.42 |
| September 2022 | $1,126.92 |
| August 2022 | $1,119.18 |
| July 2022 | $1,118.96 |
| June 2022 | $1,113.77 |
| May 2022 | $1,110.66 |
| April 2022 | $1,105.82 |
| March 2022 | $1,103.46 |
| February 2022 | $1,097.91 |
| January 2022 | $1,090.20 |
| December 2021 | $1,095.51 |
| November 2021 | $1,086.80 |
| October 2021 | $1,080.56 |
| September 2021 | $1,078.10 |
| August 2021 | $1,071.14 |
| July 2021 | $1,066.97 |
| June 2021 | $1,062.79 |
| May 2021 | $1,061.31 |
| April 2021 | $1,054.68 |
| March 2021 | $1,048.05 |
| February 2021 | $1,039.73 |
| January 2021 | $1,047.55 |
| December 2020 | $1,040.87 |
| November 2020 | $1,031.47 |
| October 2020 | $1,027.99 |
| September 2020 | $1,026.95 |
| August 2020 | $1,023.30 |
| July 2020 | $1,016.89 |
| June 2020 | $1,016.55 |
| May 2020 | $1,031.28 |
| April 2020 | $1,027.37 |
| March 2020 | $979.69 |
| February 2020 | $978.92 |
| January 2020 | $975.15 |
BLS Employment Levels by Industry
September 2026, Seasonally Adjusted Employment
The following table shows Seasonally Adjusted numbers as presented by the BLS. So, because they are “Seasonally Adjusted” they do not always add up. For instance, the BLS says there was a 46,000 total monthly increase of 46k but if you subtract the numbers provided in August from the September numbers you get a 129k increase.
| Industry | Monthly Increase | Ave. Weekly Earnings | September Employment Level | August Employment Level |
|---|---|---|---|---|
| Total private | 46,000 | $1,300.66 | 135,717,000 | 135,588,000 |
| Mining and logging | -2,000 | $1,931.39 | 607,000 | 609,000 |
| Construction | 11,000 | $1,634.25 | 8,364,000 | 8,359,000 |
| Manufacturing | 9,000 | $1,498.95 | 12,652,000 | 12,638,000 |
| Retail trade | 5,800 | $807.23 | 15,479,900 | 15,488,200 |
| Transportation and warehousing | 7,600 | $1,245.64 | 6,608,700 | 6,606,300 |
| Information | -10,000 | $2,069.35 | 2,739,000 | 2,745,000 |
| Financial activities | -7,000 | $1,865.63 | 9,082,000 | 9,086,000 |
| Professional and business services | -9,000 | $1,689.30 | 22,482,000 | 22,527,000 |
| Private education and health services | 20,000 | $1,191.59 | 28,005,000 | 27,974,000 |
| Leisure and hospitality | 10,000 | $609.45 | 16,969,000 | 17,001,000 |
| Other services | 6,000 | $1,101.99 | 6,039,000 | 6,035,000 |
Source: BLS
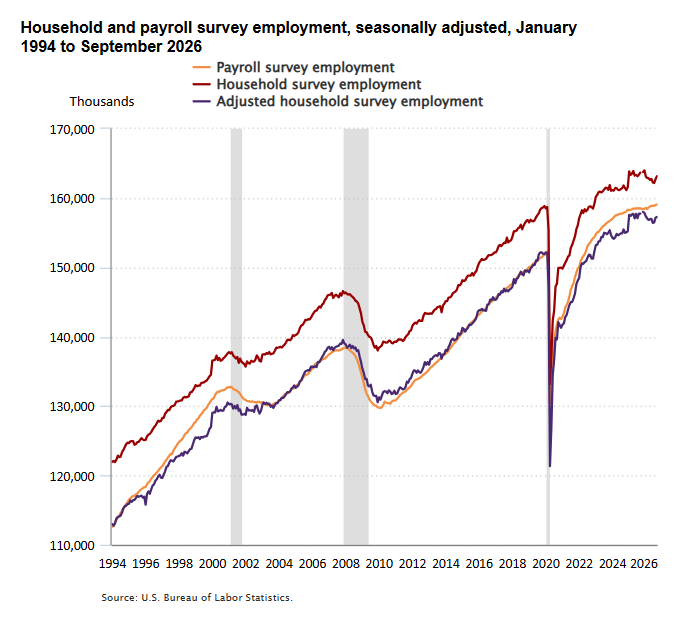
BLS Explanation Comparing employment from the BLS household and payroll surveys
The Bureau of Labor Statistics (BLS) has two monthly surveys that measure employment levels and trends: the Current Population Survey (CPS), also known as the household survey, and the Current Employment Statistics (CES) survey, also known as the payroll or establishment survey.
Both surveys are needed for a complete picture of the labor market.
The payroll survey (CES) is designed to measure employment, hours, and earnings in the nonfarm sector, with industry and geographic detail. The survey is best known for providing a highly reliable gauge of monthly change in nonfarm payroll employment. A representative sample of businesses in the U.S. provides the data for the payroll survey.
The household survey (CPS) is designed to measure the labor force status of the civilian noninstitutional population with demographic detail. The national unemployment rate is the best-known statistic produced from the household survey. The survey also provides a measure of employed people, one that includes agricultural workers and the self-employed. A representative sample of U.S. households provides the information for the household survey.
ADP® National Employment Report
ADP provides an independent (non-government) estimate of private-sector employment and pay, based on data derived from ADP client payrolls. According to ADP®, In collaboration with Stanford Digital Economy Lab.
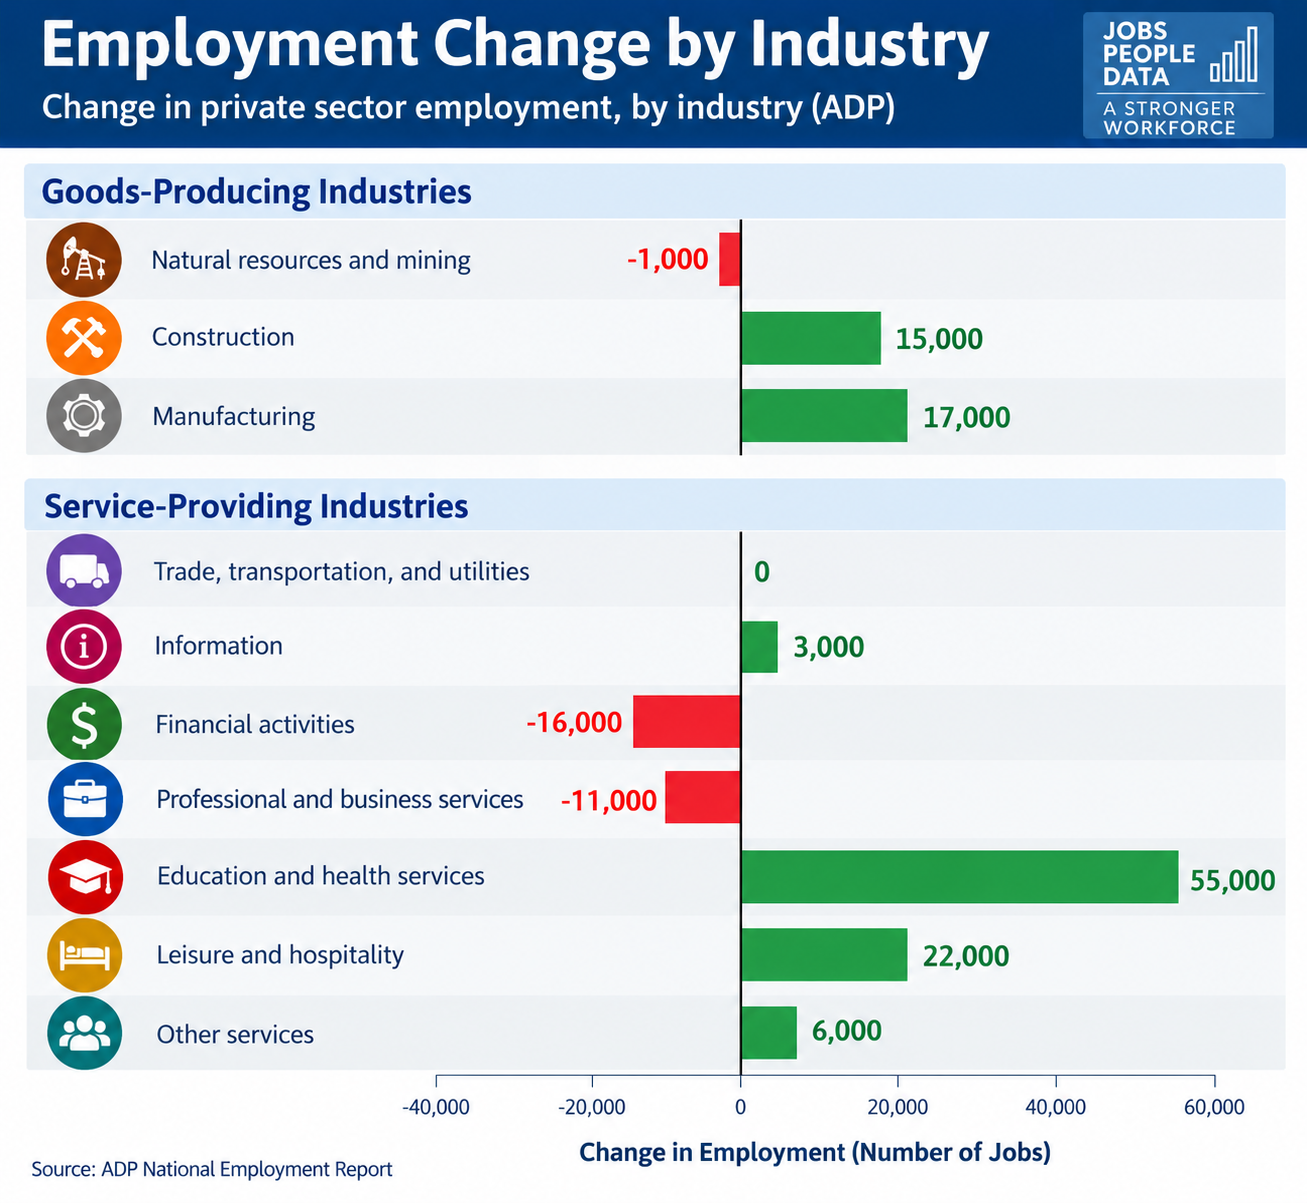
Private employers added 90,000 jobs in September
- Hiring accelerated for the first time since May, led by education and health care and leisure and hospitality. Financial activities and professional and business services showed weakness.

ADP Private Employment by Establishment Size
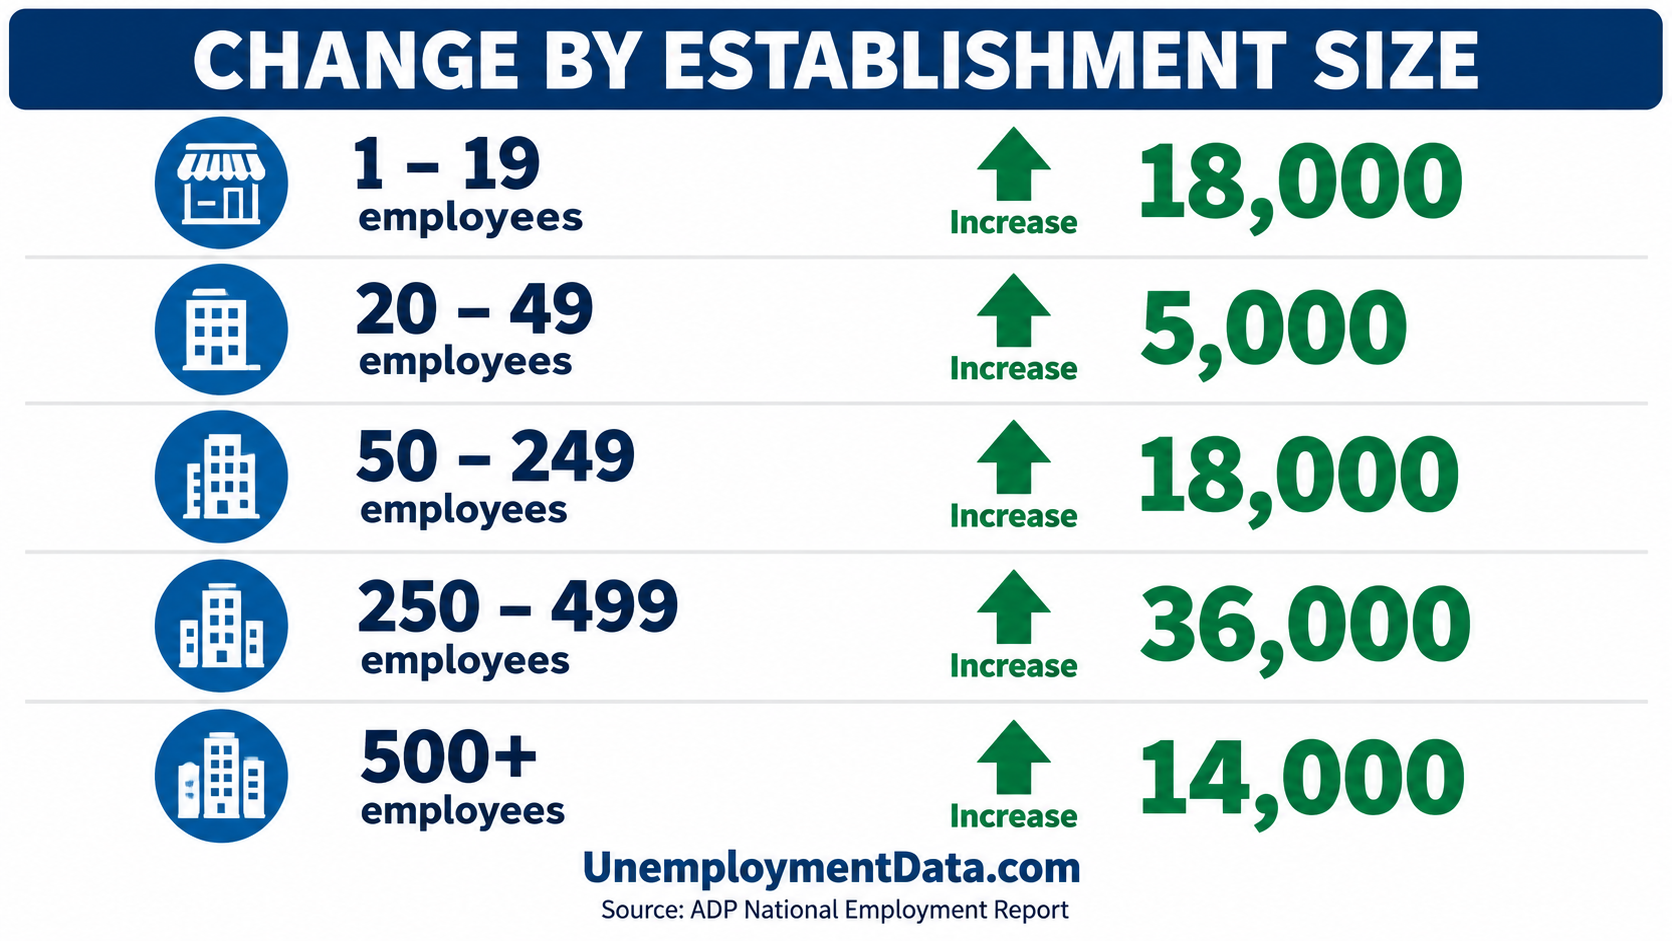
ADP Job Gainers / Losers
Seasonally Adjusted Unemployment Rate Chart 1948-Present
Less Than Full Employment
This chart compares employment levels with the (inverted) unemployment rate.
Full Employment is when everyone who wants a job has one. It is generally considered to be around 3%.
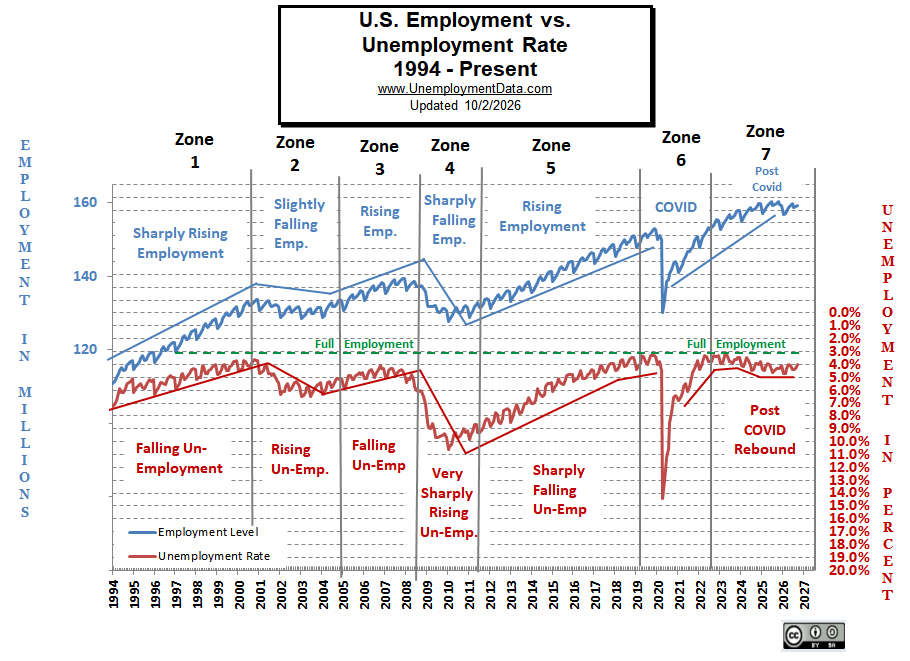
Note: Full employment is not considered to be at zero percent because even when employers are having difficulty finding employees, some people are still unemployed due to either:
- Structural unemployment (mismatch between worker skills and job requirements, i.e., not enough training) or
- Frictional unemployment. There will always be people who have quit or have lost a seasonal job and are in the process of getting a new job.
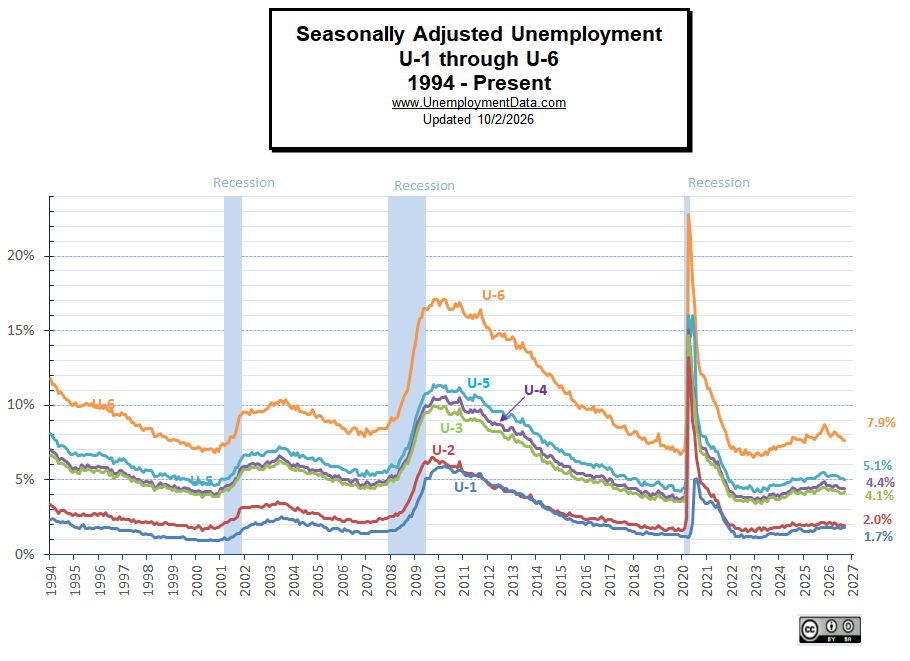
Seasonally Adjusted U1 through U6 Unemployment Rates
Labor Force Participation Rate
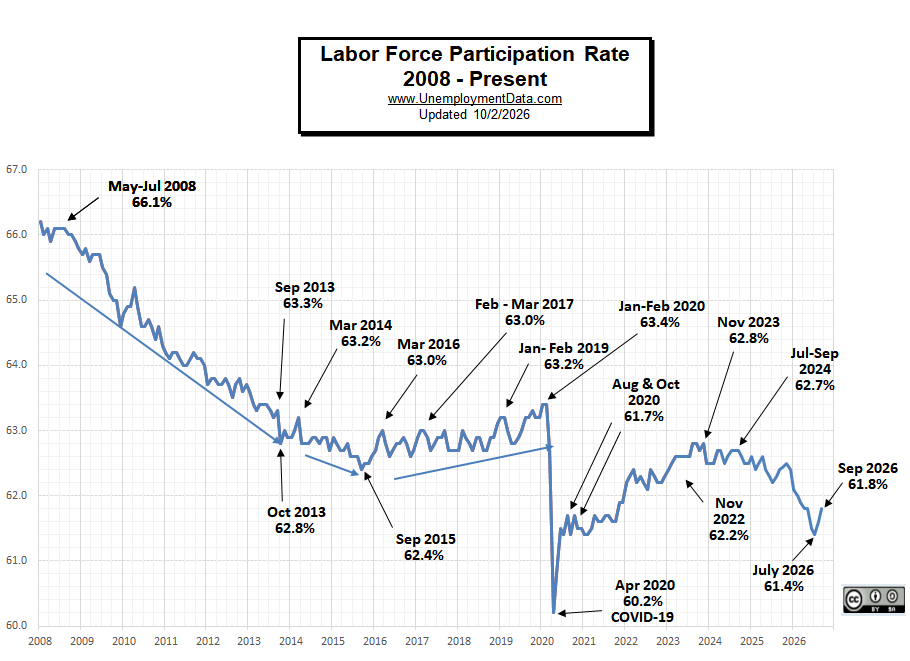
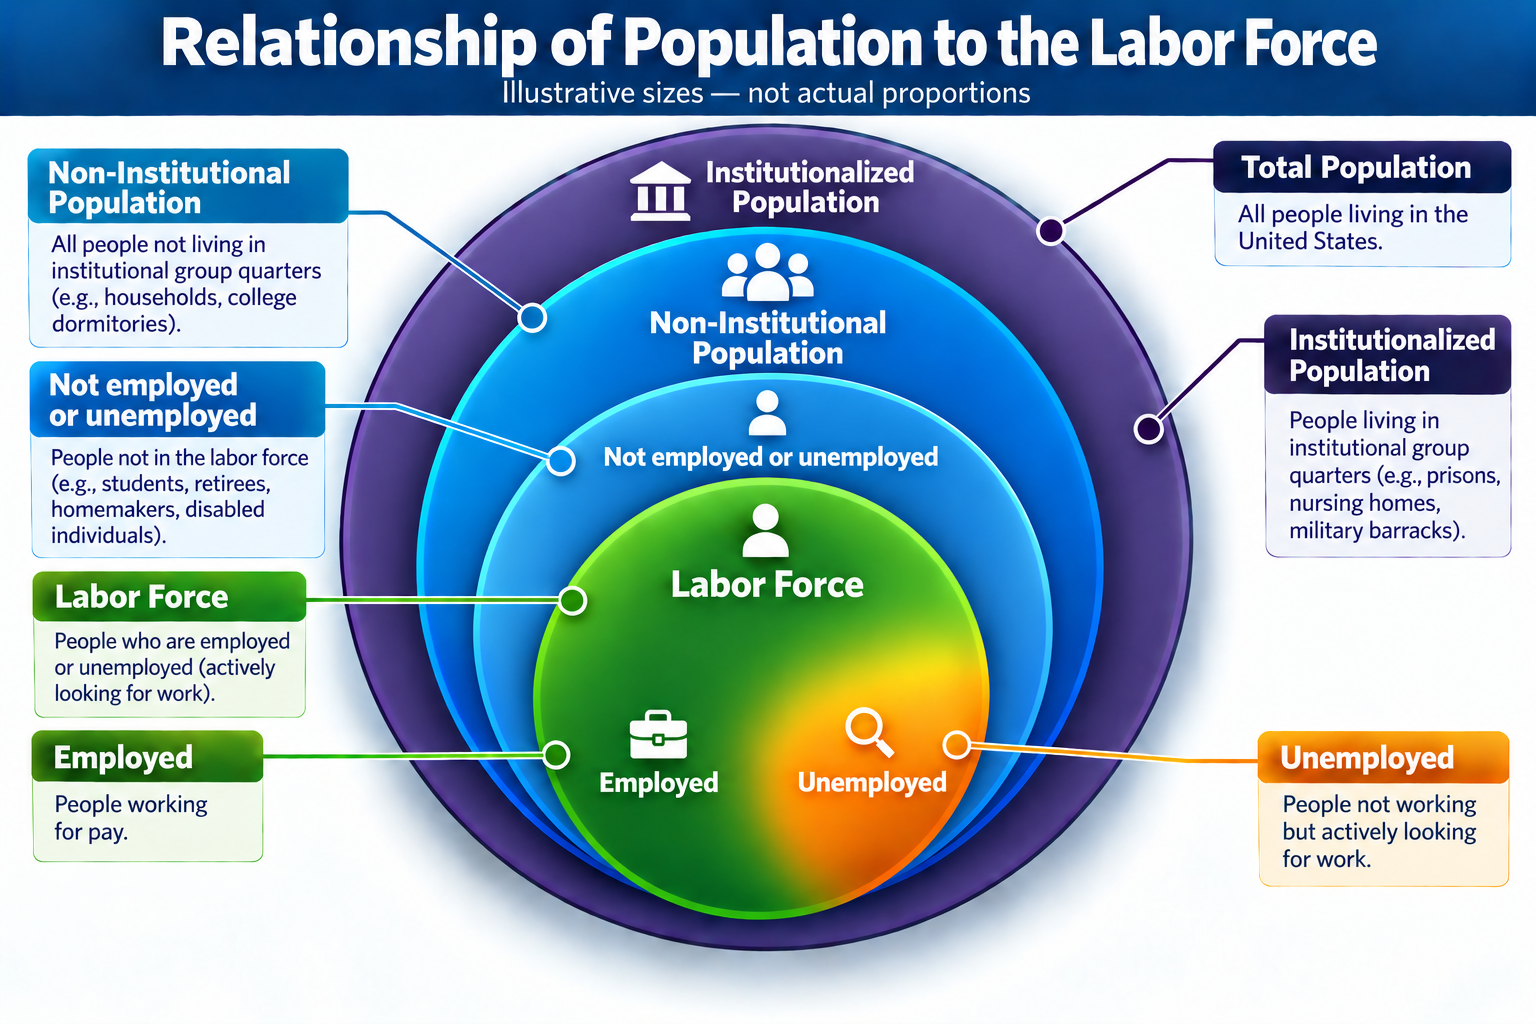
The Labor Force Participation Rate is the percentage of the Non-Institutional Population that makes up the Labor Force.
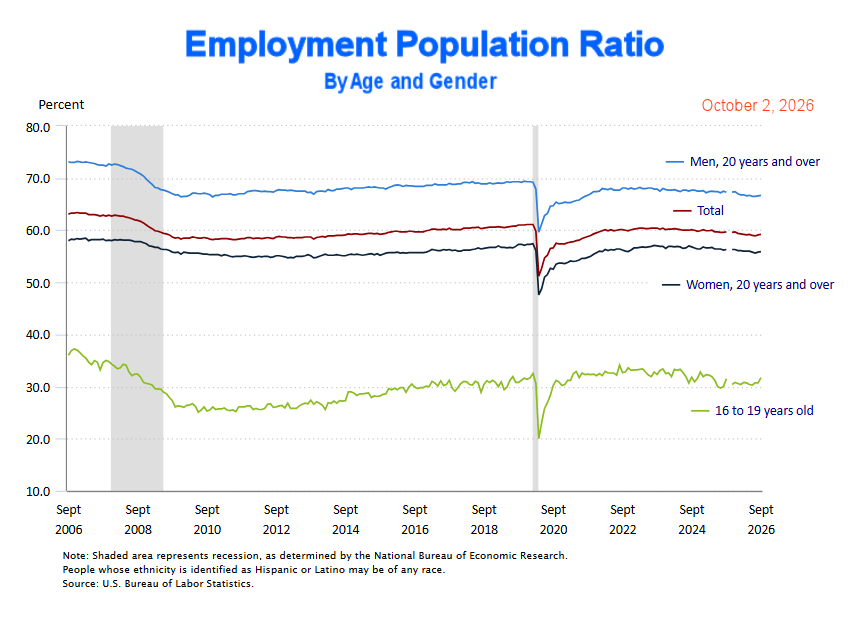
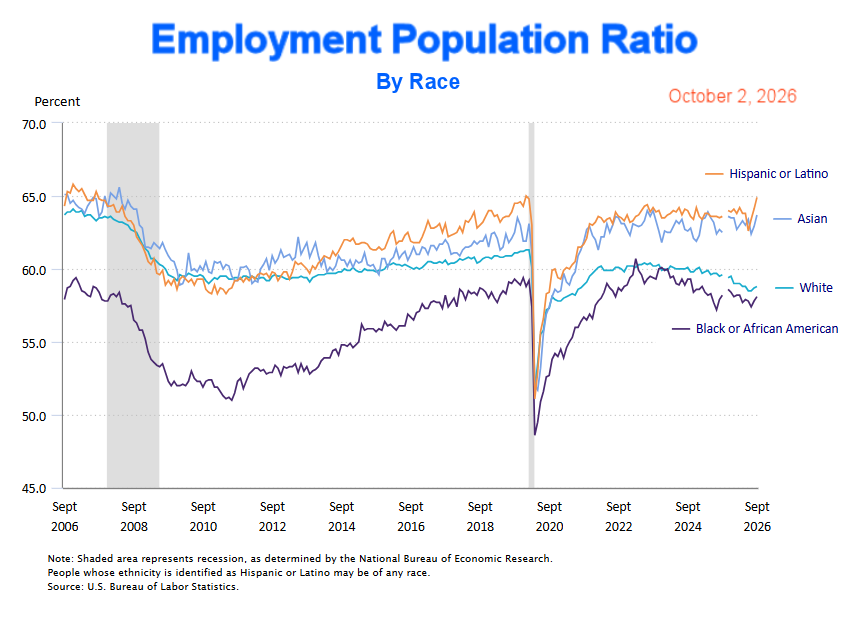
And the Employment – Population Ratio is the percentage of the Total Population that is Employed.
Employment-Population Ratio
By Gender and Age
Employment-Population Ratio by Race
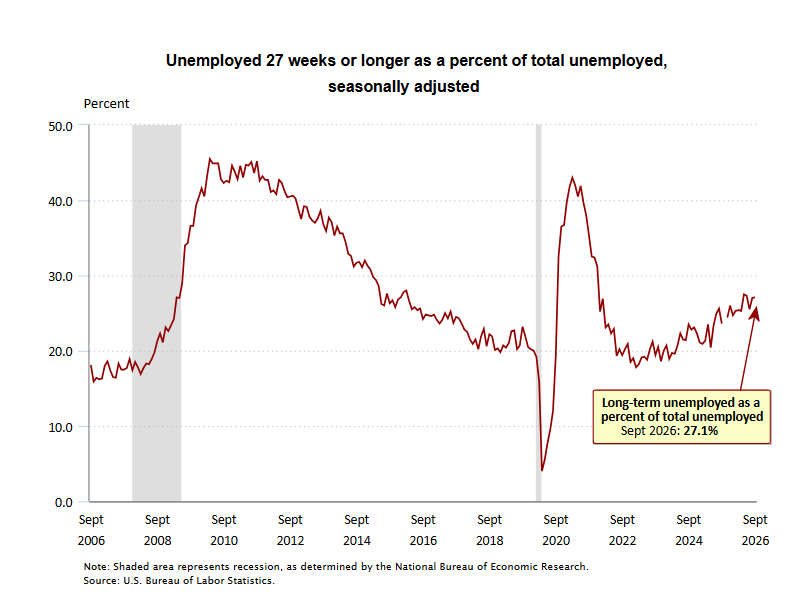
Percent Unemployed 27 weeks or Longer
Read more on UnemploymentData.com.
- Will AI Really Destroy Jobs?
- Jobs Report for August 2026
- Unemployment Rate Chart
- Employment Rate Chart and Data
From InflationData.com
- Fed Raises Rates Into Oil Inflation Shock
- Inflation Adjusted Gasoline and Oil Prices
- August Inflation Report
- Core Inflation, Trimmed Mean and Personal Consumption Expenditures
From Financial Trend Forecaster
- Moore Inflation Predictor
- NYSE ROC
- NASDAQ ROC
- ETH and BTC Buy Signal
- Can Scott Bessent Stop a Bond Market Debt Spiral?
- Nvidia’s $500 Billion AI Financing Strategy Could Reshape the AI Industry
- We May Already Be Living in the Singularity
- Ethereum Generates a “BUY” Signal
- Fed Holds Rates Again, But Three Officials Wanted a Hike
- How Affordable Was the 1950s American Dream?
- What Is the K-Shaped Economy? Everything You Need to Know
- The Hidden Cost of “Free” Healthcare and College in Scandinavia
- This Widely Held Belief About the Trade Deficit Is Wrong
- 46% of U.S. Household Assets Are Now in Stocks
- MSTR (Strategy) following it’s Elliott wave script?
From OptioMoney

Leave a Reply