
Every month when the jobs report comes out, I dig past the headline number to see what’s happening underneath. This month the most interesting story isn’t the headline number at all. It’s the Unemployment by Education data.
In September, the seasonally adjusted unemployment rate for people 25 and older without a high school diploma fell to 4.3%. Meanwhile, the rate for high school graduates with no college held at 4.4%.
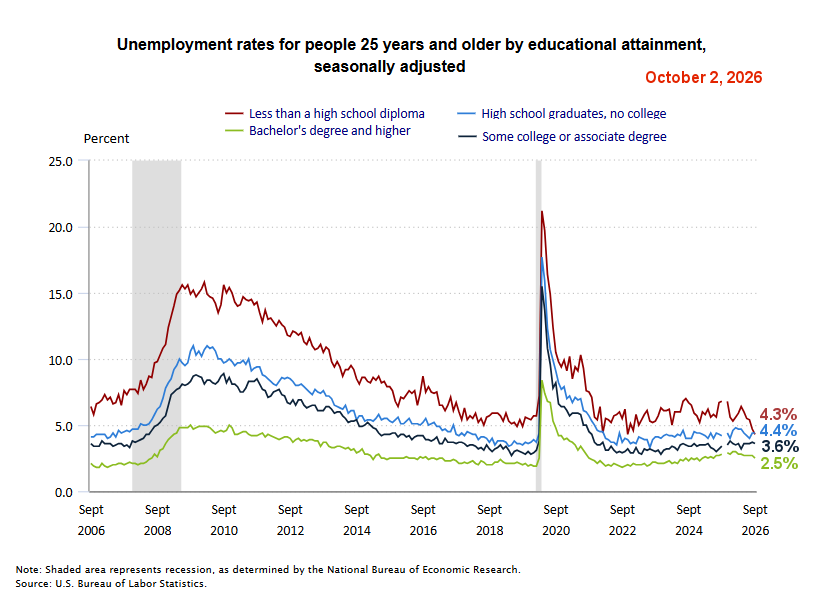
Think about that for a minute. People who didn’t finish high school now have a lower unemployment rate than people who did finish high school. That’s not supposed to happen. Historically, the less-than-high-school group has had the highest unemployment rate of any education level, usually by a wide margin. In September 2006, for example, the unemployment rate was 6.4% for those without a diploma compared with 4.1% for high school graduates.
The two lines have crossed only rarely. The last time was a brief blip in February 2022, when the rate for those without a diploma dipped to 4.3% versus 4.5% for high school grads. But that crossing came during the post-COVID hiring frenzy. This one is coming in a much cooler job market, which makes it far more interesting.
Note the massive decline in the red line in the chart below.
How Fast Did It Fall?
This wasn’t a gradual drift. A year ago, in September 2025, the rate for those without a diploma was 6.8%. As recently as April, it was 6.4%. Since then it has fallen every single month: 6.0% in May, 5.5% in June, 5.4% in July, 4.7% in August, and now 4.3%.
According to the BLS, 4.3% matches the lowest reading of the past five years, last seen in November 2022.
Here’s where every education level stood in September 2026:
• Less than high school: 4.3% (down from 6.8% a year ago)
• High school graduates, no college: 4.4% (up from 4.2%)
• Some college or associate degree: 3.6% (up from 3.4%)
• Bachelor’s degree and higher: 2.5% (down from 2.8%)
So the bottom rung of the education ladder improved dramatically while the middle rungs actually got slightly worse.
What’s Behind It?
Here’s where the underlying numbers get interesting. The number of people without a H.S. diploma in the labor force dropped from 8.87 million a year ago to 8.04 million. That’s a decline of more than 830,000 people, or about 9%. The number employed fell by about 580,000, and the number unemployed fell by about 250,000. Meanwhile, the high school graduate labor force barely budged.
In other words, the unemployment rate didn’t fall because a flood of new jobs suddenly appeared for dropouts. It fell because the pool of workers competing for those jobs shrank.
The only reason I can think of for this is that the massive reduction in illegal immigrants has reduced the supply of uneducated labor. Fewer people are competing for low-skill jobs, so those who remain find work more easily. In addition to those official numbers, many of the workers who left were likely working “off the books.” So, employers who still need roofers, landscapers, and dishwashers have to hire someone legally, on the books.
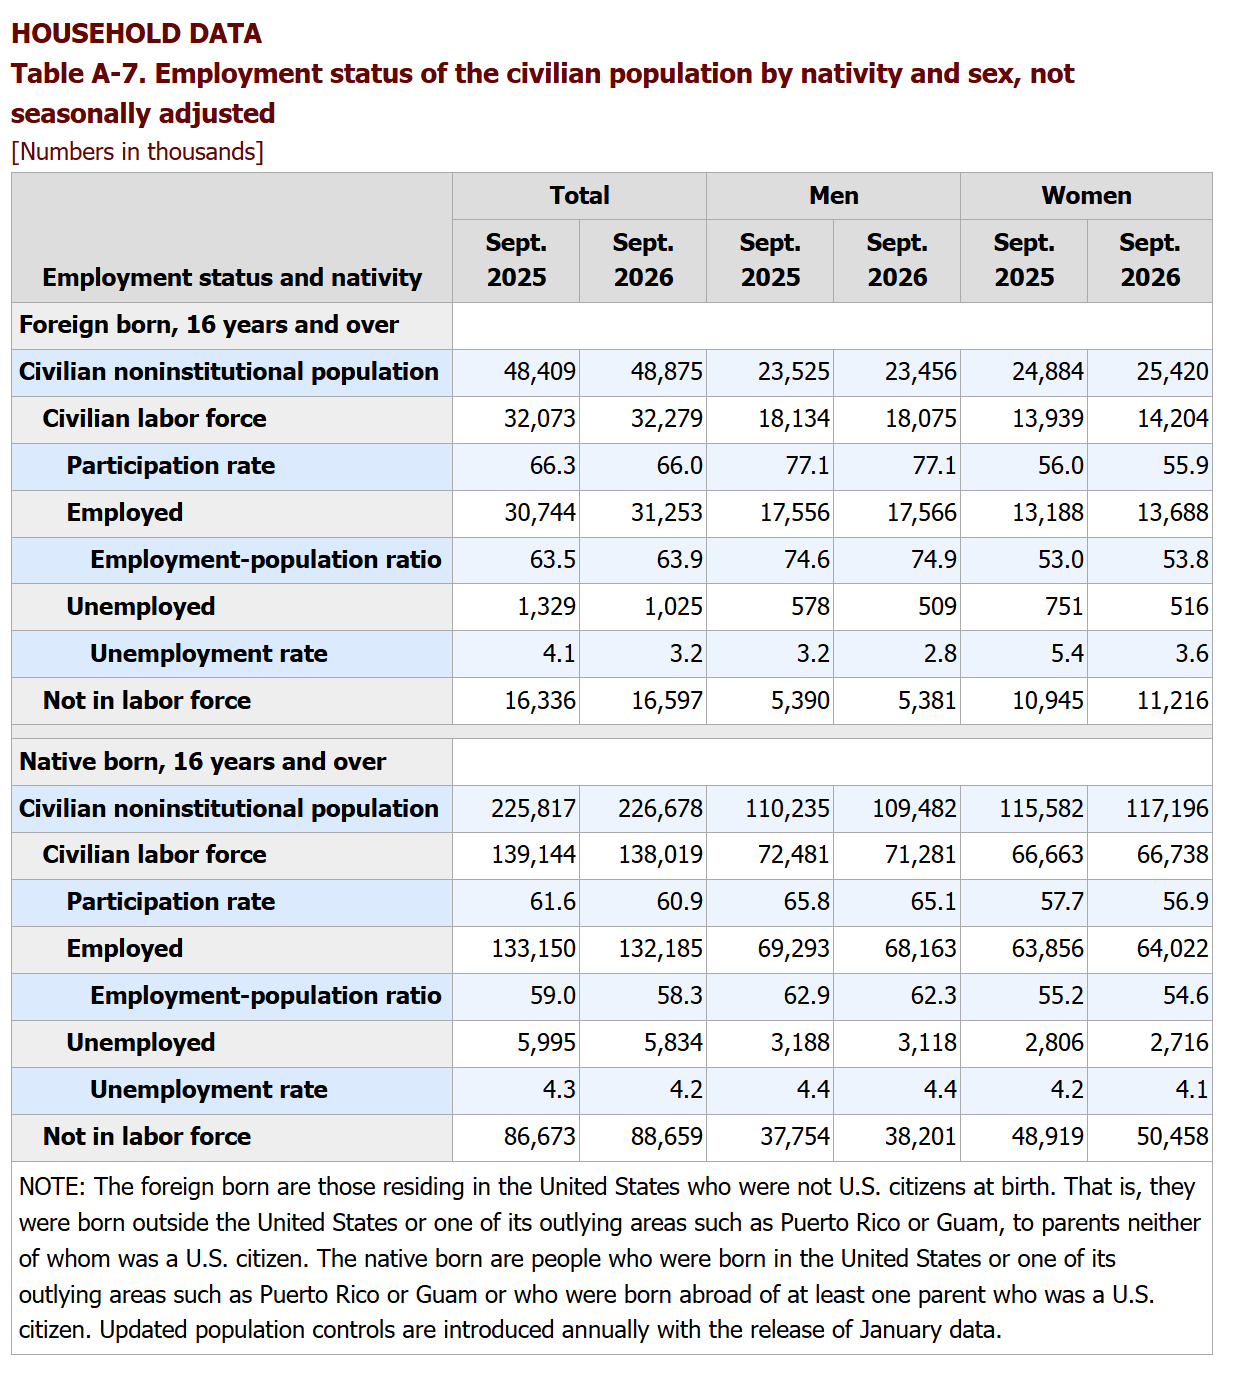
There’s an important complication, though. The BLS surveys don’t ask whether someone is in the country legally, so the data can’t prove this directly. But the BLS does track foreign-born workers and those numbers are suggestive: their unemployment rate fell from 4.1% to 3.2% over the past year, and the number of unemployed foreign-born workers dropped from about 1.33 million to 1.03 million.
Oddly, though, the same survey shows the foreign-born labor force growing slightly while the native-born labor force shrank by about 1.1 million. Part of the explanation may be that undocumented workers are hard for a household survey to reach in the first place, so they were probably undercounted both before and after. Either way, it’s a reminder not to lean too hard on any single number.
What Comes Next?
If this is a supply story, it should eventually show up in paychecks. When employers can’t find cheap off-the-books labor, they have to pay at least the mandated minimum wage, and in a tight market, often more. That’s good news for low-skilled American workers, although it may also mean higher prices for goods and services that depend on that labor.
One caveat: the less-than-high-school group is the smallest education category, so its monthly numbers bounce around more than the others. One month doesn’t make a trend. But this has been a steady five-month slide, not a one-month blip, which makes it hard to dismiss.
We’ll keep watching to see whether those lines stay crossed.
Source: U.S. Bureau of Labor Statistics, Employment Situation, Tables A-4 and A-7 (released October 2, 2026).

Leave a Reply