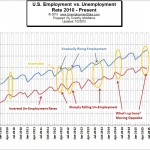
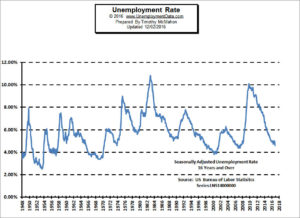
The U.S. Bureau of Labor Statistics (BLS) announced on Friday January 6th, 2017 that the seasonally adjusted unemployment rate for December was 4.7% up from 4.6% in November. The unadjusted U-3 came in at 4.5% up from 4.4% in November. Gallup on the other hand says the unadjusted U-3 is 5.1% up from 4.9% in November.
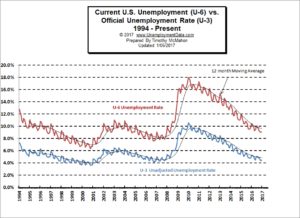 The U-6 unemployment rate, which includes discouraged workers, marginally attached workers and part-time workers who want to work full-time, was 9.1% in December up from 9.0% in November.
Gallup says their equivalent “Under Employment Rate” was 13.7% in December up from 13.0% in November.
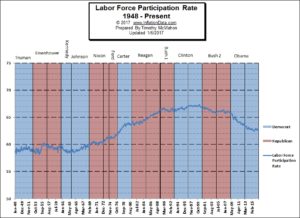
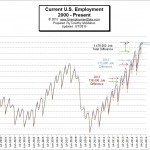
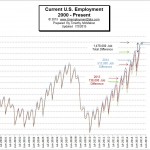
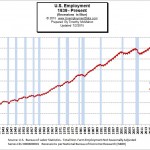
For the 20 years from 1989 to 2009 the Labor Force Participation Rate (LFPR) held fairly steady at around 66%
of the workforce being employed.
But starting in 2010 [Read more…] about Unemployment Inches Up
 While people often view mothers who stay home with their children in a positive way, they may look down on stay at home dads.
 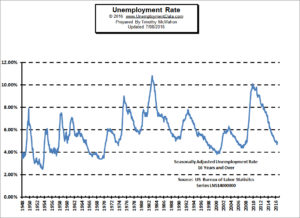 On Friday July 8th, the U.S. Bureau of Labor Statistics (BLS) released their newest unemployment data for June 2016. According to the BLS, the current “Seasonally Adjusted” Unemployment Rate is 4.9% up from 4.7% for May. The current “Unadjusted” rate is 5.1% up from 4.5% in May.
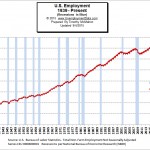 The BLS issued their “preliminary estimates” for the employment situation for the month of August 2015. The Commissioner’s report regarding the Seasonally Adjusted numbers says, “Nonfarm payroll employment increased by 173,000 in August, and the unemployment rate edged down to 5.1 percent. Employment rose in health care and social assistance and in financial activities, while manufacturing and mining employment declined.”
 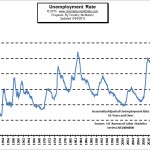 The U.S. Bureau of Labor Statistics (BLS) also released the newest unemployment data for August 2015 today. According to the BLS, the current “Seasonally Adjusted” Unemployment Rate for
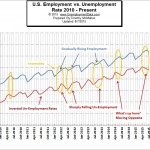
 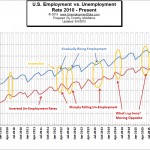 In our chart of employment vs. unemployment we compare them and although you would expect that employment and unemployment are simply the inverse of each other (i.e flip one over and you have the other) actually there are several anomalies in the data. Because the U.S. Bureau of Labor Statistics (BLS) uses two separate surveys to calculate the data it helps us see