• About WordPress
    • WordPress.org
    • Documentation
    • Learn WordPress
    • Support
    • Feedback
  • Log In
  • Skip to primary navigation
  • Skip to main content
  • Skip to primary sidebar
  • Home
  • Contact us
  • Related Sites
    • InflationData.com
    • Financial Trend Forecaster
    • Your Family Finances
    • Elliott Wave University
    • Optio Money
  • About
    • Terms of Use
    • Disclaimer & Disclosure
    • Privacy Statement
  • Sitemap
    • 2009-2010 Posts
    • 2011 Posts

UnemploymentData.com

Your Source for Employment and Unemployment Data

Unemployment
  • Charts
    • Current Unemployment Rate Chart
    • Current Employment (Chart and Data)
    • Current Employment vs Unemployment Chart
    • Historical Employment Data
    • Employment Population Ratio
    • Misery Index
  • Unemployment
    • Historical Unemployment Rate Tables
    • What Is U-6 Unemployment?
    • Unadjusted vs. Seasonally Adjusted U-3 Unemployment Rate
    • BLS vs. Gallup Unemployment Numbers
    • Current U-6 Unemployment Rate
    • What is the Labor Force Participation Rate?
    • What is the Real Unemployment Rate?
  • Employment
    • Current Employment (Chart and Data)
    • Historical Employment Data
    • Contacting a Live Person at the State Employment Commission
      • How to Talk to a Live Person at the Virginia Unemployment Commission
      • Florida’s FLUID Unemployment Program
    • Benefits
      • Insurance
      • Retirement
    • Careers
    • Employment Costs
    • Experience
    • Government
    • Job Hunting
      • Interview
      • Resume
  • Find Articles
  • Education
    • Skills
  • General
    • Small Business
      • Outsourcing
    • Success
You are here: Home / Archives for unemployment

unemployment

August Unemployment Down

September 4, 2015 by Tim McMahon

Employment-1939-2015_Aug
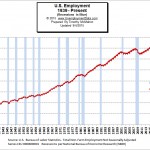
The BLS issued their “preliminary estimates” for the employment situation for the month of August 2015. The Commissioner’s report regarding the Seasonally Adjusted numbers says, “Nonfarm payroll employment increased by 173,000 in August, and the unemployment rate edged down to 5.1 percent. Employment rose in health care and social assistance and in financial activities, while manufacturing and mining employment declined.”

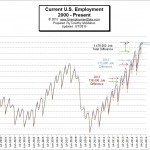
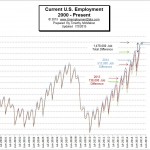
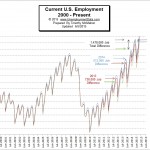
The full report of unadjusted numbers states that there were 142.126 Million jobs in August compared to 141.794 million jobs in July and 142.868 million jobs in June.

See Current Employment Commentary for more information.

Unemployment Rate Chart - August 2015
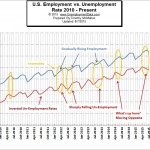
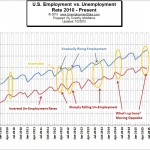
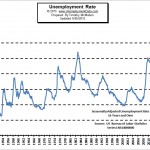
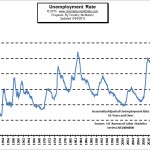
The U.S. Bureau of Labor Statistics (BLS) also released the newest unemployment data for August 2015 today. According to the BLS, the current “Seasonally Adjusted” Unemployment Rate for July is 5.1%  down from July’s 5.3%. The BLS reported the “Unadjusted” Unemployment Rate is 5.2% which is lower than July’s 5.6% . See Current Unemployment Chart for more information.

emp vs unemp 2010- Aug 2015
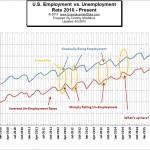
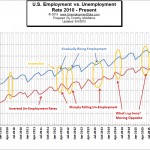
In our chart of employment vs. unemployment we compare them and although you would expect that employment and unemployment are simply the inverse of each other (i.e flip one over and you have the other) actually there are several anomalies in the data. Because the U.S. Bureau of Labor Statistics (BLS) uses two separate surveys to calculate the data it helps us see [Read more…] about August Unemployment Down

Filed Under: Unemployment Tagged With: BLS, Bureau of Labor Statistics, employment, unemployment

July Unemployment Data Released

August 7, 2015 by Tim McMahon

Employment July 2015The BLS issued their “preliminary estimates” for the employment situation for the month of July 2015. Their abbreviated report using seasonally adjusted numbers says, “Total nonfarm payroll employment increased by 215,000 in July, and the unemployment rate was unchanged at 5.3 percent, the U.S. Bureau of Labor Statistics reported today. Job gains occurred in retail trade, health care, professional and technical services, and financial activities.”

The full report of unadjusted numbers states that there were 141.794 million jobs in July down from 142.817 million jobs initially reported in June.  At the same time they revised the numbers for June up to 142.839 million making the real loss of jobs -1,045,000. See Current Employment Commentary for more information.

Unemployment rate July 2015The U.S. Bureau of Labor Statistics (BLS) also released the newest unemployment data for July 2015 today. According to the BLS, the current “Seasonally Adjusted” Unemployment Rate for July is 5.3% the same as June but down from May’s 5.5%. The BLS reported the “Unadjusted” Unemployment Rate is 5.6% which is lower than January’s 6.1% but up from June’s unadjusted 5.5%. See Current Unemployment Chart for more information.

Employment vs. Unemployment ComparisonNormally, you would expect that employment and unemployment should simply be the inverse of each other. Flip one over and you have the other. However, in the chart of employment vs. unemployment we see several anomalies in the data.   Since the U.S. Bureau of Labor Statistics (BLS) actually uses two entirely different surveys to calculate them it helps us see [Read more…] about July Unemployment Data Released

Filed Under: Unemployment Tagged With: July, unemployment, unemployment rate

June Unemployment Data

July 2, 2015 by Tim McMahon

Current Unemployment Rate ChartThe U.S. Bureau of Labor Statistics (BLS) released the newest unemployment data for June 2015 on the first Thursday of July (rather than Friday due to the holiday).  According to the BLS, the current “Seasonally Adjusted” Unemployment Rate for June is 5.3% down from May’s 5.5%. The BLS reported the “Unadjusted” Unemployment Rate is 5.5% which is  lower than January’s 6.1% equal to last October’s unadjusted 5.5% but up from April’s 5.1%. See Current Unemployment Chart and Job Growth Stalls, Labor Participation at 38-Year Low for more information. Employment-2000-Jun-2015The BLS issued their “preliminary estimates” for the employment situation for the month of June 2015. The report states 142.589 million jobs reported. That’s up 455,000 from May. But at the same time they revised the numbers for May down by 58,000 making the real gain (compared to the numbers they reported last month) 397,000. See Current Employment Commentary for more information.

Historical Employment Levels Compared to Recessions

IEmployment Levels 1939-2015n addition to the number of jobs from 1939 through the present this chart shows the recessions shaded blue as per the official description of a “recession” by the National Bureau of Economic Research (NBER). Although during some periods which are classified as official recessions the unemployment rate didn’t skyrocket generally, recessions correspond pretty well to declines in employment (i.e. increased Unemployment). This is especially true since unemployment is one of the factors NBER uses to determine whether there is an official recession. But theoretically if all the other factors line up employment could remain steady and the economy could be in a recession. See Employment During Recessions for more information. emp-vs-unemp2010- Jun2015In this chart we compare employment vs. unemployment in an effort to get a more complete picture of the employment situation. Normally, you would think that they should simply be the inverse of each other. Flip one over and you have the other. But the U.S. Bureau of Labor Statistics (BLS) actually uses two entirely different surveys to calculate them. And the current chart shows [Read more…] about June Unemployment Data

Filed Under: Unemployment Tagged With: Data, June 2015, Release, unemployment

May Unemployment Data

June 5, 2015 by Tim McMahon

unemployment_rate_May_2015The U.S. Bureau of Labor Statistics (BLS) released the newest unemployment data for May 2015 on Friday June 5th. According to the BLS, the current “Seasonally Adjusted” Unemployment Rate for May is 5.5% up from April’s 5.4%. The BLS reported the “Unadjusted” Unemployment Rate is 5.3% which is lower than October’s unadjusted 5.5% and January’s 6.1% but up from April’s 5.1%.  See Current Unemployment Chart for more information.

U.S. Employment-2000- May 2015The BLS “preliminary estimates” for the employment situation for the month of May 2015 include 142.420 million jobs reported for May 2015. That was up 970,000 from April. But at the same time they revised the numbers for April down by 12,000. See Current Employment Commentary for more information.

Employment vs UnemploymentWhen looking at employment vs. unemployment  you would think that they would simply be the inverse of each other. Flip one over and you have the other. But the U.S. Bureau of Labor Statistics (BLS) actually uses two entirely different surveys to calculate them. So by [Read more…] about May Unemployment Data

Filed Under: Unemployment Tagged With: employment, unemployment

BLS Releases Unemployment Rates for April

May 9, 2015 by Tim McMahon

The U.S. Bureau of Labor Statistics released the Employment and Unemployment rates for the month of April 2015 on Friday May 8th.  The commonly quoted Seasonally Adjusted U-3 Unemployment rate was 5.4% down slightly from 5.5% in both February and March.

The unadjusted U3 was 5.1% while the broader unadjusted U6 [Read more…] about BLS Releases Unemployment Rates for April

Filed Under: General Tagged With: April 2015, employment, unemployment

March 2015 Unemployment Flat

April 3, 2015 by Tim McMahon

The U.S. Bureau of Labor Statistics (BLS) released the March Unemployment figures on Friday April 3rd. According to the BLS the Current Unemployment Rate (Seasonally adjusted) for March was 5.5% unchanged from February. The Unadjusted Unemployment rate however fell from 5.8% to 5.6%. However, according to Gallup the Unadjusted Unemployment rate was actually 6.5% and the U-6 unemployment rate was 15.6% down from 16.1% in February.

Unemployment Numbers According to Gallup


Unadjusted U-3 Unadjusted U-6
BLS 5.6% 11.0%
Gallup 6.5% 15.6%
Difference 0.9% 4.7%

Once again the BLS numbers are quite a bit different than the [Read more…] about March 2015 Unemployment Flat

Filed Under: Unemployment Tagged With: 2015, BLS, Data, March, unemployment

BLS Releases February Unemployment Numbers

March 6, 2015 by Tim McMahon

The U.S. Bureau of Labor Statistics (BLS) released the February Unemployment figures on Friday March 6th. According to the BLS the Current Unemployment Rate (Seasonally adjusted) for February was 5.5% down from 5.7% in January. Along the same lines we see the Unadjusted Unemployment rates fall from 6.1% to 5.8%.  However, according to Gallup the Unadjusted Unemployment rate was actually 6.7% and the U-6 unemployment rate was 16.1%.

Unemployment Numbers According to Gallup


Unadjusted U-3 Unadjusted U-6
BLS 5.8% 11.4%
Gallup 6.7% 16.1%
Difference 0.9% 4.7%

Once again the BLS numbers are quite a bit different than the [Read more…] about BLS Releases February Unemployment Numbers

Filed Under: Unemployment Tagged With: employment, unemployment

The Big Lie – Part 2

February 13, 2015 by Elliott Wave International

Last week we published an article titled Gallup Head Says Unemployment Rate is “A Big Lie” in it we said that, the big news is that Jim Clifton the CEO of Gallup said that unemployment is really closer to 9%. Here’s what he said:

There’s no other way to say this. The official unemployment rate, which cruelly overlooks the suffering of the long-term and often permanently unemployed as well as the depressingly underemployed, amounts to a Big Lie.

Today the editors of Elliott Wave International look at the implications of that statement and how it relates to inflation and deflation. ~Tim McMahon, editor

The “Big Lie” About the U.S. Jobs Picture

Some 30 million people are either out of work or severely underemployed

By Elliott Wave International

Editor’s note: You’ll find the text version of the story below the video.

Get Your FREE Special Report: What You Need to Know
NOW About Protecting Yourself from Deflation »

The financial media has recently featured stories with an upbeat outlook for the U.S. economy.

For example: The economy is on track for “the fastest growth in a decade” (Associated Press), and “Experts expect jobs aplenty in ’15” (USA Today).

This upbeat tone is related to December’s U.S. jobless rate of 5.6%, its lowest since June 2008.

But [Read more…] about The Big Lie – Part 2

Filed Under: Unemployment Tagged With: 5.6% Jobless, Deflation, Lie, unemployment

November Unemployment Rate Flat

December 8, 2014 by Tim McMahon

The U.S. Bureau of Labor Statistics (BLS) released the November Unemployment figures on December 5th. The Seasonally Adjusted Unemployment Rate was 5.8% the same as the October. The Unadjusted Unemployment rate was also flat at 5.5% for November.

BLS_vs_Gallup_Unemployment_2_Nov2014
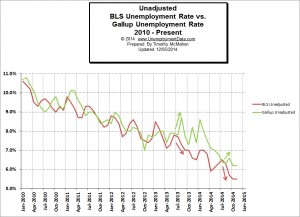
Once again the BLS numbers are quite a bit different than the independently generated Gallup numbers. This is no surprise, based on the long-term comparison between the BLS numbers and the Gallup numbers the BLS numbers consistently present a rosier picture than the Gallup numbers do.

According to surveys by [Read more…] about November Unemployment Rate Flat

Filed Under: General Tagged With: employment, November, unemployment

October Unemployment Figures

November 8, 2014 by Tim McMahon

The U.S. Bureau of Labor Statistics (BLS) released the October Unemployment figures on November 7th. The Seasonally Adjusted Unemployment Rate was 5.8% down from 5.9% in September. The Unadjusted Unemployment rate was also down from 5.7% in September to 5.5% in October but traditionally October has one of the highest employment (lowest unemployment) levels of the year.

BLS vs Gallup UnemploymentFor July and August the BLS numbers were surprisingly close to the Gallup numbers but it appears that the period of sanity has ended. In September the BLS numbers went down while the Gallup numbers went up. Although both sets of numbers went down in October the gap between them is still big enough to drive a truck through.

Gallup says the unadjusted Unemployment rate is 6.2% while the BLS says it is only 5.5% for a 0.7% difference. That is a 12.7% margin of error. Notice the major divergence at the end of the chart. [Read more…] about October Unemployment Figures

Filed Under: General Tagged With: employment, P2P, unemployment

  • « Go to Previous Page
  • Page 1
  • Interim pages omitted …
  • Page 10
  • Page 11
  • Page 12
  • Page 13
  • Page 14
  • Page 15
  • Go to Next Page »

Primary Sidebar

Rate Any Stock In Seconds

Get a detailed stock report showing its true value, safety score, and ideal timing to buy. Plus, receive a color coded Buy, Sell, or Hold recommendation.

Get Your Free Stock Analysis Here.

Recent Posts

  • February Employment Report for January 2026
  • Unemployment Report for December 2025
  • Unemployment Report for Nov. 2025
  • Delayed September 2025 Unemployment Report Released
  • No BLS Employment Data for October 2025 But ADP Says 42K New Jobs

Search Site

Resources

  • Bureau of Labor Statistics Current Population Survey Monthly survey of households conducted by the Bureau of Census for BLS. It provides data on the labor force, employment, unemployment, etc.
  • Capital Professional Services Providing web design and development and Internet marketing services
  • Elliott Wave University Using the Elliott Wave Principle to improve investment performance
  • Financial Trend Forecaster Featuring Moore Inflation Predictor, NYSE Rate of Change and NASDAQ Rate of change
  • InflationData.com Inflation calculators, databases, etc.
  • Intergalactic Web Designers Web design and development services

Articles by Category

Articles by Date

Disclaimer

At UnemploymentData.com we are not registered investment advisors and do not provide any individualized advice. Past performance is not necessarily indicative of future performance and future accuracy and profitable results cannot be guaranteed.

Privacy & Terms of Use

Privacy Statement & Terms of Use

Do Not Sell My Information

Copyright © 2026 · News Pro on Capital Professional Services, LLC. All rights reserved · Log in