
This morning when I went to the Bureau of Labor Statistics (BLS) website I received a disturbing message. It said I needed to be careful because my “Connection was not Private”.
“Attackers might be trying to steal my information from data.BLS.gov.”
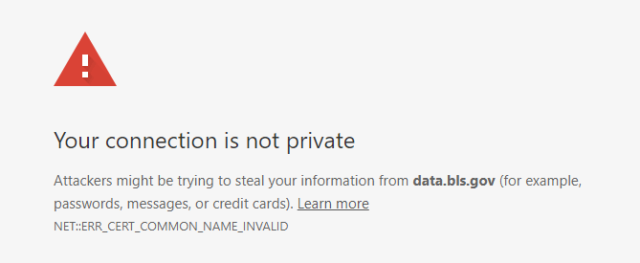
Well, that doesn’t sound good. So since that was inside my Chrome browser I figured I should try a different browser to see if it was my problem.
So I tried Firefox and got this:
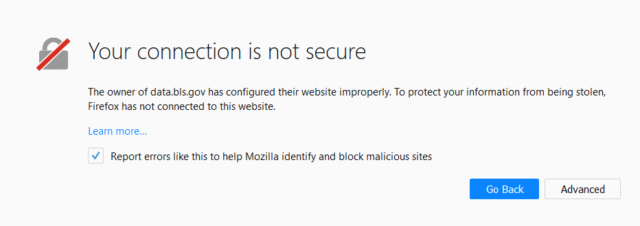
OK so maybe it’s not hackers just somebody screwed up at the BLS.
Actually, I could get to the home page https://www.bls.gov/ .
I just couldn’t get to any data pages like these:
http://data.bls.gov/timeseries/LNU04000000
http://data.bls.gov/timeseries/CEU0000000001
With a bit more digging around (clicking the “advanced” link) I found that [Read more…] about Was the Bureau of Labor Statistics Website Really Hacked?
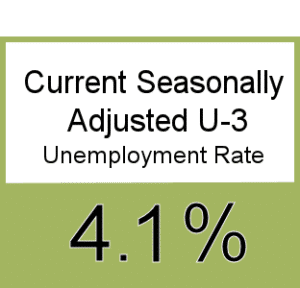 On Friday January 5th the U.S. Bureau of Labor Statistics (BLS) released their monthly employment survey results for the month of December. Many of the numbers remained unchanged from November which was also unchanged from October.
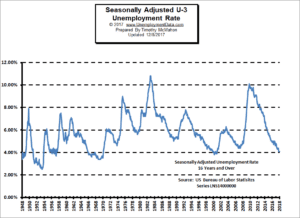 Typically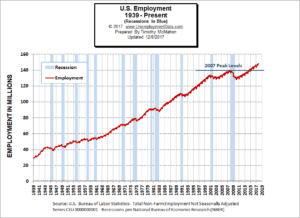
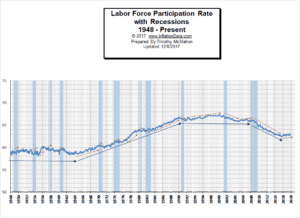
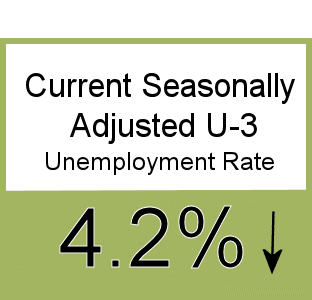 On Friday October 6th the U.S. Bureau of Labor Statistics (BLS) released their monthly employment survey results for the month of September. Every month the BLS conducts two surveys one contacts a sampling of households and the other collects data from businesses. Then they massage some of the numbers to “Seasonally Adjust” them and release them to the media.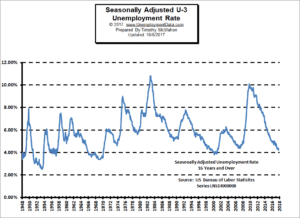
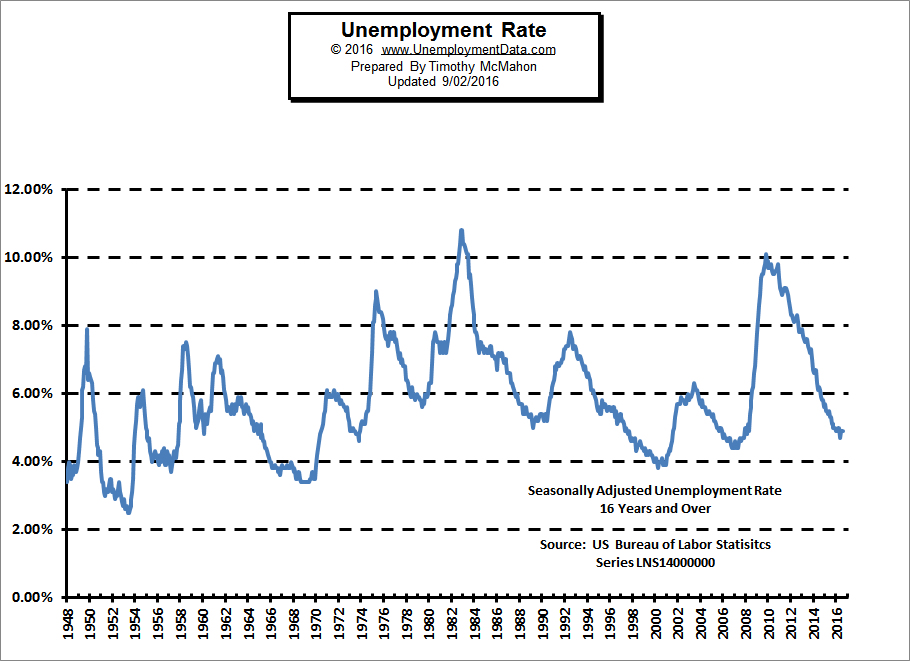 “Nonfarm payroll employment increased by [seasonally adjusted~ editor] 151,000 in August, and the unemployment rate remained at 4.9 percent. Employment continued to trend up in several service-providing industries. Incorporating revisions for June and July, which reduced nonfarm payroll employment by 1,000 on net, monthly job gains have averaged 232,000 over the past 3 months. In the 12 months prior to August, employment growth averaged 204,000 per month. Employment in food services and drinking places continued to trend up in August (+34,000). Over the year, the industry has added 312,000 jobs… Mining employment continued on a

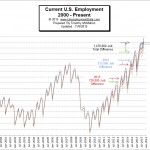 According to the current Bureau of Labor Statistics data, the employment situation for the month of October 2015 was as follows: The number of Unadjusted jobs reported for October 2015 was 143.739 million. That was up from June’s previous peak of 142.836 million.
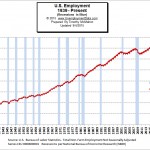
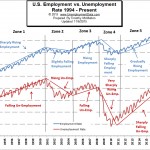 When looking at employment vs. unemployment you would think that they would simply be the inverse of each other. Flip one over and you have the other. But the U.S. Bureau of Labor Statistics (BLS) actually uses two entirely different surveys to calculate them. So by comparing them we can spot irregularities. See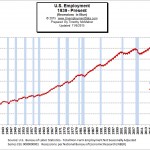
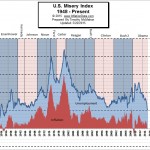 The misery index combines two factors that can make life difficult for people i.e. unemployment and inflation. High levels of price inflation (rapidly rising prices) will cause households to have difficulty affording the basic necessities while high unemployment will leave a high percentage of households without any income at all.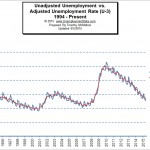
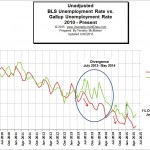
 September Employment Numbers Disappointing
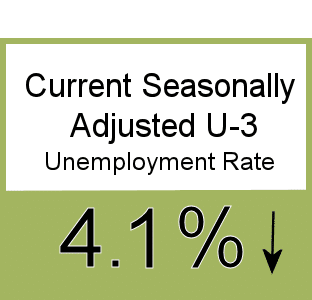
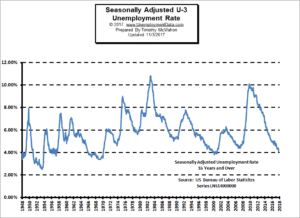
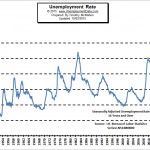 The U.S. Bureau of Labor Statistics (BLS) also released the newest unemployment data for September 2015 today. According to the BLS, the current “Seasonally Adjusted” Unemployment Rate for September is 5.1% identical to August. The BLS reported the “Unadjusted” Unemployment Rate is 4.9% which is lower than August’s 5.2% . See
 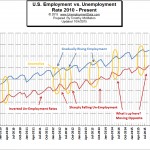 In our chart of employment vs. unemployment we compare them and although you would expect that employment and unemployment are simply the inverse of each other (i.e flip one over and you have the other) actually there are several anomalies in the data. Because the U.S. Bureau of Labor Statistics (BLS) uses two separate surveys to calculate the data it helps us see
 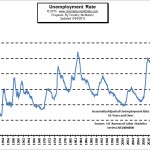 The U.S. Bureau of Labor Statistics (BLS) also released the newest unemployment data for August 2015 today. According to the BLS, the current “Seasonally Adjusted” Unemployment Rate for
 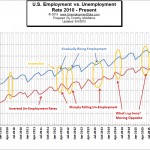 In our chart of employment vs. unemployment we compare them and although you would expect that employment and unemployment are simply the inverse of each other (i.e flip one over and you have the other) actually there are several anomalies in the data. Because the U.S. Bureau of Labor Statistics (BLS) uses two separate surveys to calculate the data it helps us see