• About WordPress
    • WordPress.org
    • Documentation
    • Learn WordPress
    • Support
    • Feedback
  • Log In
  • Skip to primary navigation
  • Skip to main content
  • Skip to primary sidebar
  • Home
  • Contact us
  • Related Sites
    • InflationData.com
    • Financial Trend Forecaster
    • Your Family Finances
    • Elliott Wave University
    • Optio Money
  • About
    • Terms of Use
    • Disclaimer & Disclosure
    • Privacy Statement
  • Sitemap
    • 2009-2010 Posts
    • 2011 Posts

UnemploymentData.com

Your Source for Employment and Unemployment Data

Unemployment
  • Charts
    • Current Unemployment Rate Chart
    • Current Employment Rate (Chart and Data)
    • Current Employment vs Unemployment Chart
    • Historical Employment Data
    • Employment Population Ratio
    • Misery Index
  • Unemployment
    • Historical Unemployment Rate Tables
    • What Is U-6 Unemployment?
    • Unadjusted vs. Seasonally Adjusted U-3 Unemployment Rate
    • BLS vs. Gallup Unemployment Numbers
    • Current U-6 Unemployment Rate
    • What is the Labor Force Participation Rate?
    • What is the Real Unemployment Rate?
  • Employment
    • Current Employment Rate (Chart and Data)
    • Historical Employment Data
    • Contacting a Live Person at the State Employment Commission
      • How to Talk to a Live Person at the Virginia Unemployment Commission
      • Florida’s FLUID Unemployment Program
    • Benefits
      • Insurance
      • Retirement
    • Careers
    • Employment Costs
    • Experience
    • Government
    • Job Hunting
      • Interview
      • Resume
  • Find Articles
  • Education
    • Skills
  • General
    • Small Business
      • Outsourcing
    • Success
You are here: Home / Archives for Tim McMahon

Tim McMahon, Editor of UnemploymentData.com

My grandfather lived through the Hyperinflation in Weimar, Germany--to say he was an original “gold bug” would be an understatement. I began reading his “hard money” newsletters at the age of 16 and the dividends from gold stocks helped put me through college. I began publishing the Financial Trend Forecaster paper newsletter in 1995 upon the death of James Moore editor of Your Window into the Future and the creator of the Moore Inflation Predictor©. FTF specializes in trends in the stock market, gold, inflation and bonds. In January of 2003, I began publishing InflationData.com to specialize in all forms of information about the nature of Inflation. In 2009, we added Elliott Wave University to help teach you the principles of Elliott Wave analysis. In January 2013, we began publishing OptioMoney. Connect with Tim on Google+.

Strategies for Conquering Job Search Frustration

February 9, 2023 by Tim McMahon

Job hunting can be a long and frustrating process. It’s easy to feel overwhelmed with the number of applications you need to fill out, interviews you need to attend, and rejections you receive. However, it is possible to stay positive throughout your job search journey if you have the right strategies in place. Read on for some tips on how to ease job-hunting frustration.

Maintain Perspective

job hunting strategiesIt’s important to keep in mind that a job search is just one small part of your life. Don’t let it consume all your thoughts or take away from other activities you enjoy doing. Make sure you take time out of each day for hobbies, relaxation, and fun with family and friends—activities that will help maintain balance and perspective in your life. Speaking of family and friends, hopefully they are being supportive of your efforts. You should also enlist their suggestions, referrals and leads on available jobs. One of the best ways to find a job is to be recommended by someone who already works there. So, network, network, network to get a good reference from someone the company already trusts.

Set Realistic Expectations

Having realistic expectations will go a long way toward helping you manage stress during a job search. It’s important to remember that there are many factors beyond your control when it comes to getting hired; don’t expect too much too soon or become discouraged when things don’t happen as quickly as you’d like them to. Focus on the progress that has been made rather than any setbacks encountered along the way. [Read more…] about Strategies for Conquering Job Search Frustration

Filed Under: Job Hunting Tagged With: Frustration, job hunting, job hunting success

January Employment / Unemployment Report

February 4, 2023 by Tim McMahon

The U.S. Bureau of Labor Statistics (BLS) released its employment / unemployment report for January on February 3rd 2023.

Employment Down or Up? – Unemployment Down? 

Adj U3 Icon 3-4 dn


  • Unadjusted Employment fell from 155.349 million to 152.844
  • Labor Force Participation rose from 62.3% to 62.4%
  • Adjusted U-3 fell from 3.5% to 3.4%
  • Unadjusted U-3 ROSE from 3.3% to 3.9%
  • Unadjusted U-6 ROSE from 6.4% to 7.4%


According to the Commissioner of the U.S. Bureau of Labor Statistics:

“Total nonfarm payroll employment rose by 517,000 in January, and the unemployment rate changed little at 3.4 percent, the U.S. Bureau of Labor Statistics reported today. Job growth was widespread, led by gains in leisure and hospitality, professional and business services, and health care. Employment also increased in government, partially reflecting the return of workers from a strike.”

In addition, the BLS posted the following note:
 “Establishment survey data have been revised as a result of the annual benchmarking process, the NAICS 2022 conversion, and the updating of seasonal adjustment factors.| Also, household survey data for January 2023 reflect updated population estimates.”

You can read the full BLS report here.

As usual, they are talking about “Seasonally Adjusted Jobs”.

Looking at the Unadjusted Establishment Survey report, we see…
Originally the BLS reported employment of 154.771 million for December, which they adjusted up to 155.349 million. So, 578,000 additional jobs appeared for December.
I don’t know if it’s just me but, an additional half million jobs seems a bit exceptional, but perhaps in government work it’s just a rounding error.

The current estimate for January is 152.844 million which is down 1.9 million from the original number and down 2.5 million from the revised numbers. But after Seasonally Adjustment they report a half million increase! Typically, employment does fall off in January so some seasonal adjustment is justified but the half million increase in December seems a bit excessive.
We will see what happens next month.

ADP® National Employment Report

According to ADP In collaboration with Stanford Digital Economy Lab employment was up from December but by about 1/5th as much as the BLS reported. But if employment is up, why is the UNADJUSTED U3 and U6 down drastically? Could it be the extra 1.1 million people the BLS added to the Civilian population? December Civilian Population 264.844 million. January Civilian Population 265.962 million.

ADP: Private employers added 106,000 jobs in January

  • Employment was soft during our Jan. 12 reference week as the U.S. was hit with extreme weather. California was coping with record floods and back-to-back storms delivered ice and snow to the central and eastern U.S.

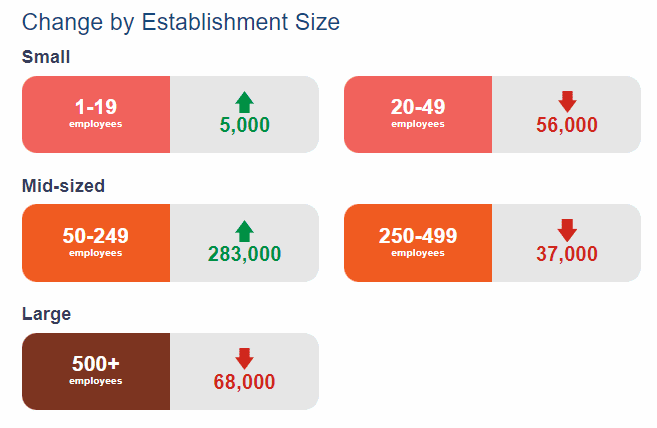
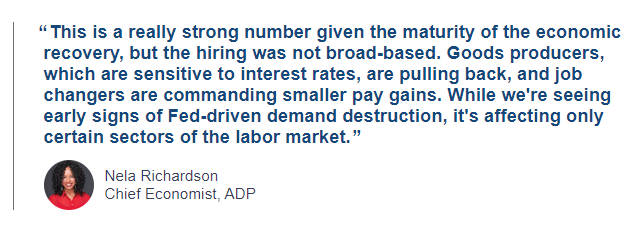
Nela Richardson January 2023ADP also lists increases by “firm size”.

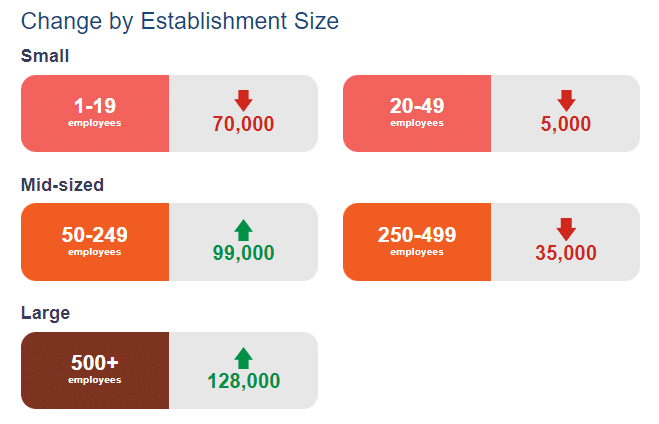
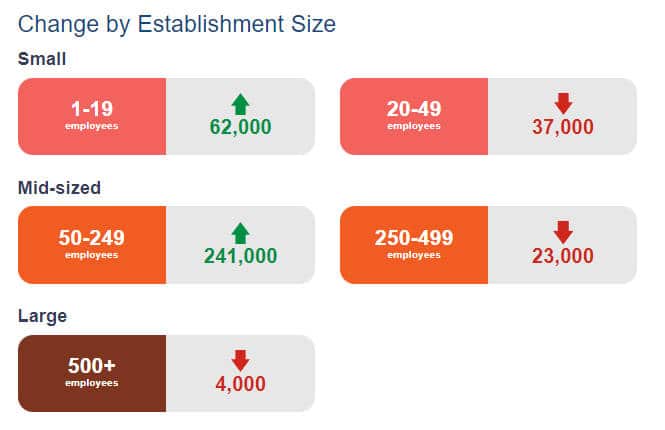
Last month small and medium-sized companies were hiring while large corporations are downsizing. This month it was almost the opposite.

December Changes:

ADP Change by Establishment Size

January Changes:

Change by Est Size for January 2023

January 2023 Employment by Sector

The employment “bubble chart” is a quick and easy way to see how each sector performs on a seasonally adjusted basis. The Bubble’s Size tells us the total Employment for that industry (i.e., larger bubbles mean more people are employed in that sector).

The bubble’s location on the chart tells us that there has been a change in Employment Levels over the most recent month… A bubble further to the right indicates larger job growth. A bubble’s vertical location on the chart shows the average industry salary.

Average Weekly Wages Rose in January

Date Average Weekly Wage
January 2023 $1,146.14
December 2022 $1,125.73
November 2022 $1,129.01
October 2022 $1,124.01
September 2022 $1,119.87
August 2022 $1116.42
July 2022 $1,116.54
June 2022 $1,106.76
May 2022 $1,105.47
April 2022 $1,102.01
December 2021 $1,086.46

[Read more…] about January Employment / Unemployment Report

Filed Under: BLS Tagged With: BLS, employment, unemployment

December 2022- Employment and Unemployment by State

January 24, 2023 by Tim McMahon

The Bureau of Labor Statistics released its employment report (broken down by state) for the month of December 2022.

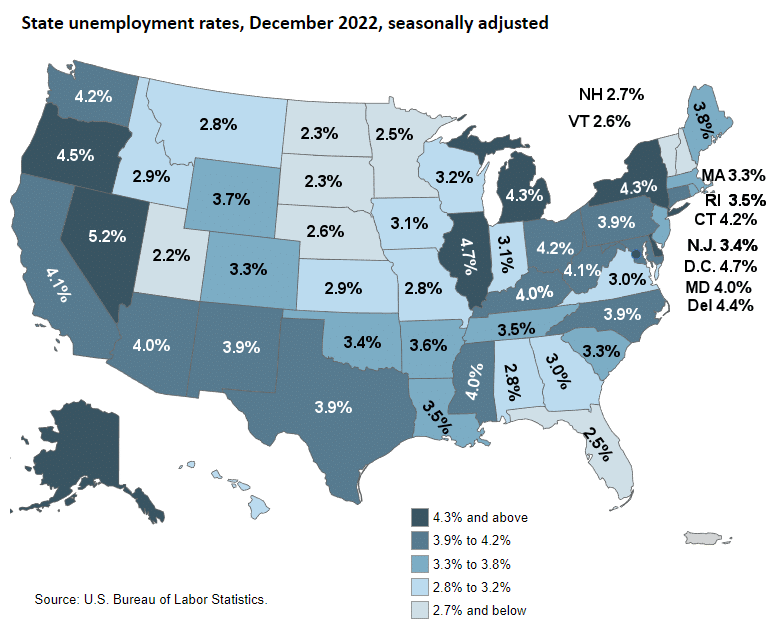
The lowest jobless rate was in Utah at 2.2 percent. North and South Dakota had the next lowest rates at 2.3 percent each. Alaska at 4.3%, and Pennsylvania at 3.9% set record lows since the BLS began recording (by state) in 1976. Nevada had the highest unemployment rate, 5.2 percent. 14 states had unemployment rates lower than the U.S. average of 3.5 percent. Washington D.C. and 11 states had rates higher than average, and 25 states had rates that were not appreciably different from that of the nation.

In December, seven states had over-the-month unemployment rate increases, the largest of which was in Nevada (+0.3 percentage point). Five states had over-the-month decreases, the largest of which was in Maryland (-0.3 percentage point). Thirty-eight states and the District of Columbia had jobless rates that were not notably different from those of a month earlier, though some had changes that were at least as large numerically as the significant changes.

unemployment by State Dec 2022
[Read more…] about December 2022- Employment and Unemployment by State

Filed Under: BLS Tagged With: 2023, December, unemployment, Unemployment December 2023

December 2022 Employment Report

January 7, 2023 by Tim McMahon

Is Employment Up or Down?


  • Unadjusted Employment fell from 155.015 million to 154.771
  • Labor Force Participation rose from 62.2% to 62.3%
  • Adjusted U-3 fell from 3.6% to 3.5%
  • Unadjusted U-3 fell from 3.4% to 3.3%
  • Unadjusted U-6 was unchanged at 6.4%


The U.S. Bureau of Labor Statistics (BLS) released its employment / unemployment report for December on January 6th2023.

According to the Commissioner of the U.S. Bureau of Labor Statistics:

“Total nonfarm payroll employment increased by 223,000 in December, and the unemployment rate edged down to 3.5 percent, the U.S. Bureau of Labor Statistics reported today. Notable job gains occurred in leisure and hospitality, health care, construction, and social assistance… The unemployment rate edged down to 3.5 percent in December and has remained in a narrow range of 3.5 percent to 3.7 percent since March.”

In addition, the BLS posted the following note:
“Seasonally adjusted household survey data have been revised using updated seasonal adjustment factors…”
They will also be making further annual adjustments next month.

You can read the full BLS report here.

As usual, they are talking about “Seasonally Adjusted Jobs”  rather than looking at the unadjusted results.

Looking at the unadjusted Current Employment Statistics program (formerly called the Establishment Survey report), we see…
Originally, the BLS reported employment of 154.990 million for November, which they adjusted up to 155.015 million. So, 25,000 additional jobs appeared for November.

The current estimate for December is 154.771 million, which is down 219,000 from the original November number and down 244,000 from the revised numbers.

According to the BLS’ unadjusted Current Population Survey (CPS), the labor force was 164.224 million in December. Of those, 158.872 million were employed, and 5.352 million were unemployed. November CPS employment was 158.749 million, so according to the Current Population Survey, employment increased.

So one set of numbers shows an increase in employment while the other shows a decrease. ADP says mostly up.

ADP® National Employment Report

According to ADP, In collaboration with Stanford Digital Economy Lab, employment was up from November to December.

Private employers added 235,000 jobs in December

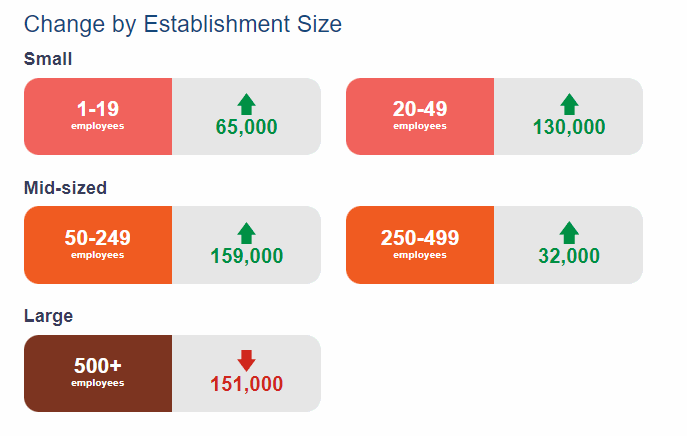
  • Job resurgence was seen in the last two months of 2022, led by consumer-facing service industries. Hiring was strong across small and medium establishments, while large establishments saw a drop in employment of 151,000 jobs.

ADP Comment December 2022ADP also lists increases by “firm size”.

As we can see, small and medium-sized companies are still hiring, while large corporations are downsizing.

ADP Change by Establishment Size


December 2022 Employment by Sector

The employment “bubble chart” is a quick and easy way to see how each sector performs on a seasonally adjusted basis. The Bubble’s Size tells us the total Employment for that industry (i.e., larger bubbles mean more people are employed in that sector).

The bubble’s location on the chart tells us that there has been a change in Employment Levels over the most recent month… A bubble further to the right indicates larger job growth. A bubble’s vertical location on the chart shows the average industry salary.

In November, Leisure and Hospitality, Education, Construction, Manufacturing, and “Other” were the big gainers, while Retail was the big loser.

Average Weekly Wages Fell in December

$1,125.73 in December, $1,129.01 in November, $1,124.01 in October , $1,119.87 in September, $1116.42 in August, $1,116.54 in July, $1,106.76, in June, $1,105.47 in May and $1,102.01 in April, and $1,086.46 in December 2021. [Read more…] about December 2022 Employment Report

Filed Under: BLS Tagged With: BLS, December 2022, employment, unemployment

5 Career Opportunities for Disabled Individuals

December 7, 2022 by Tim McMahon

No matter what type of disability you may have, the good news is that there is a great career waiting for you in all types of industries. Unlike in years past when employers may have been hesitant to hire disabled workers, the job market of today is eager to hire workers of all backgrounds and skills. Should you be a disabled individual who is looking for a great career opportunity, here are five possibilities you may want to consider.

File Clerk

If you have a hearing impairment, being a file clerk would be a great career. The perfect job if you like routine work and keeping track of records, this job requires minimal contact with others on a daily basis, letting you work alone while you keep things organized.

Credit Counselor

Should you have a visual impairment, consider becoming a credit counselor. Working with a variety of clients, you will help people establish budgets, understand how to set and reach financial goals, and much more. A job where it is key for you to build interpersonal relationships with others, it has an annual average salary approaching $45,000.

Actuary

One of the best disability job opportunities for people who have mobility issues, becoming an actuary will provide you with a great and satisfying career. Working for an insurance company, you would use your math and statistical skills to help companies analyze risk, which helps determine insurance coverage for various situations. A job that is always in demand, the annual salary can often exceed $100,000. [Read more…] about 5 Career Opportunities for Disabled Individuals

Filed Under: Careers Tagged With: career, Disability

4 Careers that Don’t Require a 4 Year Degree

December 7, 2022 by Tim McMahon

If you’re stuck in a job you hate or find yourself unemployed, it can be tempting to just give up and resign yourself to your fate. But it doesn’t have to be that way! There are plenty of good jobs out there that don’t require a four-year degree. And the best part is, you can often get the skills you need by completing an online course.

Medical Coding

If you’re looking for a job in the medical field that doesn’t require years of school, medical coding might be a good fit for you. Medical coding is the process of turning diagnoses and procedures into numeric or alphanumeric codes. These codes are then used for insurance reimbursement and to keep track of medical data. You can complete online medical coding classes in as little as six weeks, so it is definitely a career that doesn’t require a 4-year degree!

Web Design

With more and more businesses moving their operations online, there’s a growing demand for web designers who can create attractive and user-friendly websites. If you have an eye for design and some basic coding skills, you can learn everything you need to know to get started in web design through a variety of free and paid online courses. You can easily get started without a 4-year degree. [Read more…] about 4 Careers that Don’t Require a 4 Year Degree

Filed Under: Education Tagged With: 4-Year degree, career

November Jobs Report

December 2, 2022 by Tim McMahon

Employment Up – Unemployment Unchanged

Current U-3 Unemployment Rate


  • Unadjusted Employment rose from 154.416 million to 154.990
  • Labor Force Participation is Down from 62.2% to 62.1%
  • Adjusted U-3 was unchanged at 3.7%
  • Unadjusted U-3 was unchanged at 3.4%
  • Unadjusted U-6 was Up from 6.3% to 6.4%


The U.S. Bureau of Labor Statistics (BLS) released its employment / unemployment report for November on December 2nd.

According to the Commissioner of the U.S. Bureau of Labor Statistics:

“Nonfarm payroll employment rose by 263,000 in November, and the unemployment rate was unchanged at 3.7 percent. Notable job gains occurred in leisure and hospitality, health care, and government. Employment declined in retail trade and in
transportation and warehousing. The November gain in nonfarm payroll employment was roughly in line with average growth over the prior 3 months (+282,000). Monthly job growth thus far in 2022 has averaged 392,000, compared with 562,000 per month in 2021.”

You can read the full BLS report here.

As usual, they are talking about “Seasonally Adjusted Jobs” from the “Household Survey” rather than looking at the results reported by actual companies in the BLS “Establishment Survey”.

Looking at the Establishment Survey report, we see…
Originally the BLS reported employment of 154.369 million for October, which they adjusted up to 154.416 million. So, 47,000 additional jobs appeared for October.

November gained an additional 574,000 jobs bringing the total up to 154.990 million.

ADP® National Employment Report

According to ADP, in collaboration with Stanford Digital Economy Lab

Private employers added 127,000 jobs in November

  • Job creation slowed by the most since January 2021, led by construction and other interest rate-sensitive sectors. Consumer-facing segments – including health care and hospitality – were bright spots.

ADP Economist


ADP also lists increases by “firm size”.

Last month (October) ADP posted these changes…

For November, the numbers definitely look worse, with virtually all the gains in mid-sized companies. People are becoming more risk-averse, so fewer small companies are being started. At some point, when jobs are scarce, starting your own business becomes the only option, so small company creation increases again. :

ADP Change by Establishment Size


November 2022 Employment by Sector

The employment “bubble chart” is a quick and easy way to see how each sector performs on a seasonally adjusted basis. The Bubble’s Size tells us the total Employment for that industry (i.e., larger bubbles mean more people are employed in that sector).

The bubble’s location on the chart tells us that there has been a change in Employment Levels over the most recent month… A bubble further to the right indicates larger job growth. A bubble’s vertical location on the chart shows the average industry salary.

In November, Leisure and Hospitality, Education, Construction, Manufacturing, and “Other” were the big gainers, while Retail was the big loser.

Average Weekly Wages Rose

$1,129.01 in November, $1,124.01 in October , $1,119.87 in September, $1116.42 in August, $1,116.54 in July, $1,106.76, in June, $1,105.47 in May and $1,102.01 in April, and $1,086.46 in December 2021. Surprisingly, Retail was the big loser, which is unusual for this time of year.  [Read more…] about November Jobs Report

Filed Under: BLS Tagged With: 2022, BLS, employment, jobs, November, unemployment

Are You Eligible for Social Security Disability Benefits?

December 1, 2022 by Tim McMahon

If you are unable to work due to a disability, you may be eligible for Social Security Disability (SSD) Benefits. Like all government programs, there are very specific requirements you have to meet in order to be eligible for benefits. Plus, the application process for these benefits may be a bit daunting, but finding out if you qualify is worth the effort.

Eligibility for SSD Benefits

You must meet two basic criteria to be eligible for Social Security Disability benefits:

  • You must have a medical condition that meets the criteria of disability as defined by the Social Security Administration (SSA).
  • Your situation should have precluded you from working for about a year or be anticipated to bar you from working for over one year.

The medical condition must prevent you from engaging in “substantial gainful activity.” Work that pays over $1,070 monthly (or $1,800 if you are blind) is considered this. The SSA’s website has a list of disabling conditions, which includes:

  • Cancer
  • Muscular dystrophy
  • Amputation
  • Multiple sclerosis
  • Cerebral palsy
  • Arthritis, etc.

Depending on your age, you must also have worked and paid Social Security taxes for a certain number of years. For example, a 31-year-old must have worked for the previous ten years. People who become disabled before age 22 have a different work requirement; generally, they or a parent should have worked for a sufficient period to be eligible for benefits. [Read more…] about Are You Eligible for Social Security Disability Benefits?

Filed Under: Benefits Tagged With: Disability, Disability Insurance, ss benefits

Unemployment Rates by State October 2022

November 19, 2022 by Tim McMahon

On Friday, November 18th, 2022, The U.S. Bureau of Labor Statistics (BLS) released its breakdown of the unemployment rates for each individual state for October.

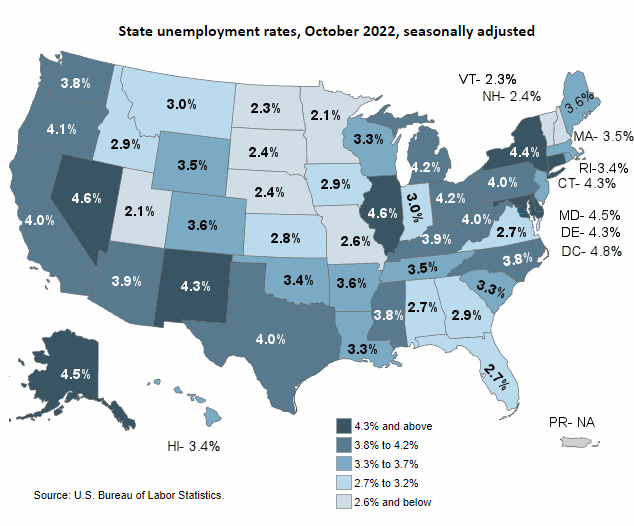
In the chart below, the lightest colors represent the states with the lowest unemployment rates.

Unemployment by State Oct 2022Looking at the above map, we can see that generally, the lowest unemployment states run diagonally across the country, starting in Florida and ending in Montana and Idaho. Conversely, the states with the highest unemployment are located in the North East, the South West, and West Coast.  Of course, minor exceptions exist, but generally, it holds.

October 2022 Seasonally Adjusted Unemployment Rate by State Table (Alphabetical)

State October 2022(P) Rate
Alabama 2.7
Alaska 4.5
Arizona 3.9
Arkansas 3.6
California 4.0
Colorado 3.6
Connecticut 4.3
Delaware 4.3
District of Columbia 4.8
Florida 2.7
Georgia 2.9
Hawaii 3.4
Idaho 2.9
Illinois 4.6
Indiana 3.0
Iowa 2.9
Kansas 2.8
Kentucky 3.9
Louisiana 3.3
Maine 3.6
Maryland 4.5
Massachusetts 3.5
Michigan 4.2
Minnesota 2.1
Mississippi 3.8
Missouri 2.6
Montana 3.0
Nebraska 2.4
Nevada 4.6
New Hampshire 2.4
New Jersey 3.5
New Mexico 4.3
New York 4.4
North Carolina 3.8
North Dakota 2.3
Ohio 4.2
Oklahoma 3.4
Oregon 4.1
Pennsylvania 4.0
Rhode Island 3.4
South Carolina 3.3
South Dakota 2.4
Tennessee 3.5
Texas 4.0
Utah 2.1
Vermont 2.3
Virginia 2.7
Washington 3.8
West Virginia 4.0
Wisconsin 3.3
Wyoming 3.5

States with the Highest Unemployment Rates

The record for the highest unemployment goes as usual to the State that is not really a “state”, i.e., D.C. at 4.8%. Puerto Rico is usually ranked among those with the worst unemployment but avoided that “honor” this month by not having its data available. Slightly better than D.C. is Nevada and Illinois at 4.6%, followed by Maryland, and Alaska at 4.5%.

[Read more…] about Unemployment Rates by State October 2022

Filed Under: Unemployment Tagged With: State Unemployment

October 2022 BLS Employment Report

November 5, 2022 by Tim McMahon

Adj U3 Icon 3-7 up

Employment Up – Unemployment Also Up?

  • Unadjusted Employment rose from 153.197 million to 154.369
  • Labor Force Participation is Down from 62.3% to 62.2%
  • Adjusted U-3 was Up from 3.5% to 3.7%
  • Unadjusted U-3 was Up from 3.3% to 3.4%
  • Unadjusted U-6 was Down from 6.4% to 6.3%


The U.S. Bureau of Labor Statistics (BLS) released its employment / unemployment report for October on November 4th.

According to the Commissioner of the U.S. Bureau of Labor Statistics:

“Nonfarm payroll employment increased by 261,000 in October, and the unemployment rate rose to 3.7 percent. Notable job gains occurred in health care, professional and technical services, and manufacturing. Monthly job growth has averaged 407,000 thus
far in 2022, compared with 562,000 per month in 2021.”

You can read the full BLS report here.

As usual, they are talking about “Seasonally Adjusted Jobs” from the “Household Survey” rather than looking at the results reported by actual companies in the BLS “Establishment Survey”.

Looking at the Establishment Survey report, we see…
Originally the BLS reported employment of 153.073 million for September, which they adjusted up to 153.197 million. So, 124,000 additional jobs appeared for September.

October gained an additional 1,272,000 jobs bringing the total up to 154.369 million.

Initially, the market shot up under the news but as the day progressed the market lost most of its gains. 

See November FED Announcement Rocks Stock Market for more market info.

ADP® National Employment Report

According to ADP In collaboration with Stanford Digital Economy Lab

Private employers added 239,000 jobs in October

  • Employers created 239,000 jobs in October, up from a revised 192,000 in September as restaurants, retailers and the travel sector ramped up hiring in advance of the year-end holidays.

ADP 11-2022


ADP also lists increases by “firm size”.

At some point, it may look like small-size firms (i.e. 1-19 employees) are increasing, while everything else is decreasing, but that could simply be the result of people starting companies because they can’t find any other jobs (although this isn’t currently the case). Last month, there were increases across the board. This month’s results were mixed.


Unemployment

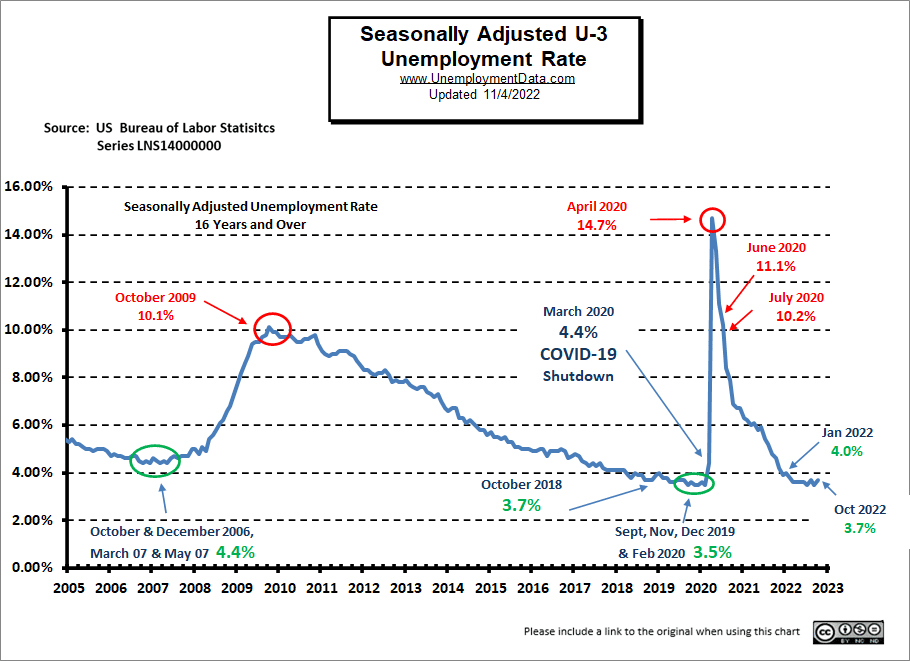
Looking at the chart for unemployment, we see that despite the increase in the number of people employed unemployment still ticked upward slightly.

Seasonally Adj U-3 Unemployment Rate 11-22

Employment –Establishment Survey

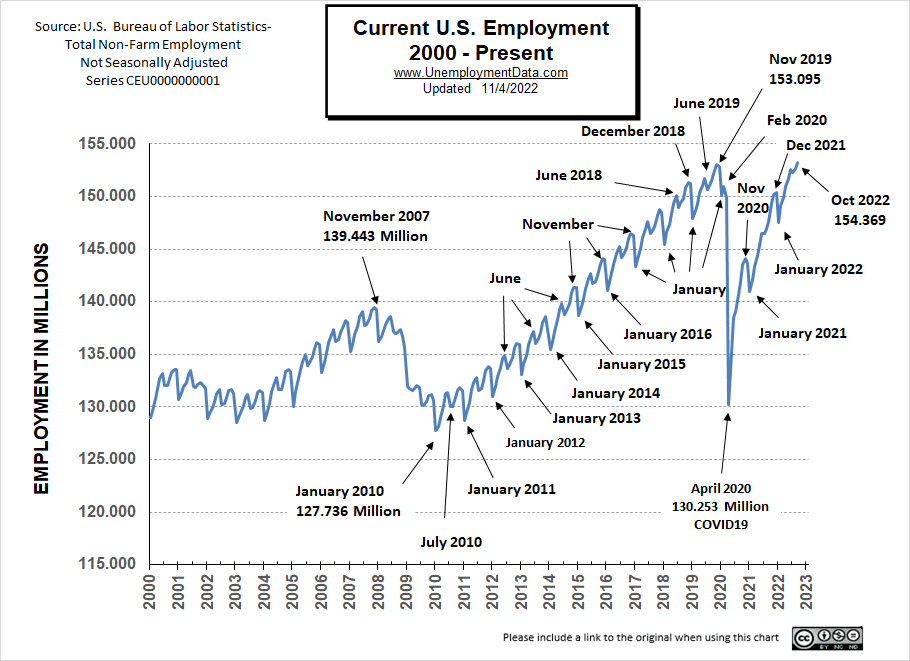
Looking at the chart for employment, we see that current employment (154.369 million) is now above the 2019 peak (153.095 million) although the civilian population is 5 million higher now.

Current Employment 11-4-22


See Current Employment for more info.

[Read more…] about October 2022 BLS Employment Report

Filed Under: BLS Tagged With: BLS, employment, October 2022, unemployment

  • « Go to Previous Page
  • Page 1
  • Interim pages omitted …
  • Page 5
  • Page 6
  • Page 7
  • Page 8
  • Page 9
  • Interim pages omitted …
  • Page 44
  • Go to Next Page »

Primary Sidebar

Search Site

Sponsored:

Here's the Best Day to Buy Nvidia

Did you know Nvidia has an 86% history of soaring, beginning on one particular day every single spring? We call this the "Green Day phenomenon." It works on 5,000 stocks. For example, Tesla has a 100% history of soaring beginning on one particular day every single year.

Click here to see the green days for 5 major stocks today.

Recent Posts

  • May Employment Nothing Burger
  • April 2025 Employment / Unemployment Report
  • Would More Jobs Help Social Security?
  • March 2025- Employment / Unemployment Report
  • February 2025 Jobs Report

Resources

  • Bureau of Labor Statistics Current Population Survey Monthly survey of households conducted by the Bureau of Census for BLS. It provides data on the labor force, employment, unemployment, etc.
  • Capital Professional Services Providing web design and development and Internet marketing services
  • Elliott Wave University Using the Elliott Wave Principle to improve investment performance
  • Financial Trend Forecaster Featuring Moore Inflation Predictor, NYSE Rate of Change and NASDAQ Rate of change
  • InflationData.com Inflation calculators, databases, etc.
  • Intergalactic Web Designers Web design and development services
  • Your Family Finances

Articles by Category

Articles by Date

Disclaimer

At UnemploymentData.com we are not registered investment advisors and do not provide any individualized advice. Past performance is not necessarily indicative of future performance and future accuracy and profitable results cannot be guaranteed.

Privacy & Terms of Use

Privacy Statement & Terms of Use

Do Not Sell My Information

Copyright © 2025 · News Pro on Capital Professional Services, LLC. All rights reserved · Log in