• About WordPress
    • WordPress.org
    • Documentation
    • Learn WordPress
    • Support
    • Feedback
  • Log In
  • Skip to primary navigation
  • Skip to main content
  • Skip to primary sidebar
  • Home
  • Contact us
  • Related Sites
    • InflationData.com
    • Financial Trend Forecaster
    • Your Family Finances
    • Elliott Wave University
    • Optio Money
  • About
    • Terms of Use
    • Disclaimer & Disclosure
    • Privacy Statement
  • Sitemap
    • 2009-2010 Posts
    • 2011 Posts

UnemploymentData.com

Your Source for Employment and Unemployment Data

Unemployment
  • Charts
    • Current Unemployment Rate Chart
    • Current Employment Rate (Chart and Data)
    • Current Employment vs Unemployment Chart
    • Historical Employment Data
    • Employment Population Ratio
    • Misery Index
  • Unemployment
    • Historical Unemployment Rate Tables
    • What Is U-6 Unemployment?
    • Unadjusted vs. Seasonally Adjusted U-3 Unemployment Rate
    • BLS vs. Gallup Unemployment Numbers
    • Current U-6 Unemployment Rate
    • What is the Labor Force Participation Rate?
    • What is the Real Unemployment Rate?
  • Employment
    • Current Employment Rate (Chart and Data)
    • Historical Employment Data
    • Contacting a Live Person at the State Employment Commission
      • How to Talk to a Live Person at the Virginia Unemployment Commission
      • Florida’s FLUID Unemployment Program
    • Benefits
      • Insurance
      • Retirement
    • Careers
    • Employment Costs
    • Experience
    • Government
    • Job Hunting
      • Interview
      • Resume
  • Find Articles
  • Education
    • Skills
  • General
    • Small Business
      • Outsourcing
    • Success
You are here: Home / Archives for Tim McMahon

Tim McMahon, Editor of UnemploymentData.com

My grandfather lived through the Hyperinflation in Weimar, Germany--to say he was an original “gold bug” would be an understatement. I began reading his “hard money” newsletters at the age of 16 and the dividends from gold stocks helped put me through college. I began publishing the Financial Trend Forecaster paper newsletter in 1995 upon the death of James Moore editor of Your Window into the Future and the creator of the Moore Inflation Predictor©. FTF specializes in trends in the stock market, gold, inflation and bonds. In January of 2003, I began publishing InflationData.com to specialize in all forms of information about the nature of Inflation. In 2009, we added Elliott Wave University to help teach you the principles of Elliott Wave analysis. In January 2013, we began publishing OptioMoney. Connect with Tim on Google+.

Rewiring Your Resume: The Skills You Need to Market Yourself

October 23, 2014 by Tim McMahon

Writing a successful resume requires descriptions of the applicable skills you possess, supported by clear examples in a work history. Blanketing a resume with a wide skill set is a common mistake many people make when writing their resumes. Most employers look for skills that will aid in performing a job, so it is important to narrow skill sets and work histories to reflect experience with the job you are applying for.

Applicable Skills
Resume- 3870577923_d19c5421ef_mEmployers are not interested in every skill you can bring to the table. Specific, marketable, skills are often preferred to task-based talents. In addition, most employers will not be interested in long, comprehensive lists. Instead, employers will search for skills they think will enhance a potential employee’s ability to successfully do their job.
For example, [Read more…] about Rewiring Your Resume: The Skills You Need to Market Yourself

Filed Under: General Tagged With: resume

Reconsidering Your Resume: Five Ways to Sell Yourself Better

October 14, 2014 by Tim McMahon

When you are trying to construct a good resume, you need to make sure you are using your resume to speak to your skills and attributes and sell yourself to a new employer. The five ideas below are all designed to make your resume look better, and you need to be certain your resume features as many of these ideas as possible. Don’t be afraid to stand out.

Resume-ID-100248987One Page
It is definitely better to limit your resume to one page long. Today’s world is simply too busy for you to send out resumes that are several pages. When you getting ready to e-mail your resume, you need to make sure they are confined to one page. Unless you are applying for a high level management position, human resources people won’t [Read more…] about Reconsidering Your Resume: Five Ways to Sell Yourself Better

Filed Under: Resume Tagged With: resume

September BLS Unemployment Numbers Differ Vastly from Gallup

October 3, 2014 by Tim McMahon

The U.S. Bureau of Labor Statistics (BLS) released the September Unemployment figures on October 3rd. The Seasonally Adjusted Unemployment Rate was 5.9% down from 6.2% in August. The Unadjusted Unemployment rate was also down from 6.3% in August to 5.7% in September.

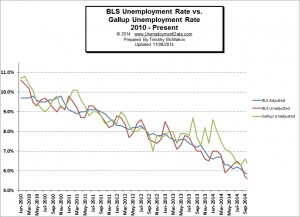
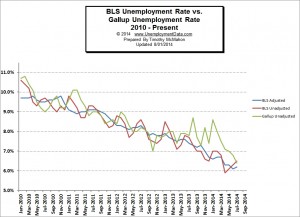
BLS_vs_Gallup_Unemployment_2_Sep2014For the last couple of months the BLS numbers have been surprisingly close to the Gallup numbers but it appears that the period of sanity has ended. This month the BLS numbers went down while the Gallup numbers went up. So Gallup says the unadjusted Unemployment rate is 6.6% while the BLS says it is only 5.7% for a whopping 0.9% difference. That is a 15.8% margin of error. Notice the major divergence at the end of the chart. [Read more…] about September BLS Unemployment Numbers Differ Vastly from Gallup

Filed Under: General

BLS Releases August Unemployment: 6.1% Down from 6.2% in July

September 6, 2014 by Tim McMahon

The U.S. Bureau of Labor Statistics (BLS) released the August Unemployment figures on September 5th. The Seasonally Adjusted Unemployment Rate was 6.2% up from 6.1% in June. The Unadjusted Unemployment rate was also down from 6.5% in July to 6.3% in August.

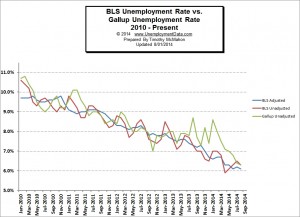
BLS vs GallupIn another rare occurrence, the BLS seasonally adjusted numbers are actually identical to the Gallup numbers for the first time since September 2011. In the interim the BLS has been lower than the Gallup numbers 24 times and Gallup has been lower 9 times. The average difference when the BLS is lower is  0.6% but when Gallup is lower the average has only been 0.3%. So in addition to BLS being lower more often it is also lower by more indicating some sort of bias to the downside. But perhaps the BLS is mending their ways since last month and this month have resulted in the BLS and Gallup being well within a normal margin of error. [Read more…] about BLS Releases August Unemployment: 6.1% Down from 6.2% in July

Filed Under: Unemployment

BLS Releases July Unemployment: 6.2% Up from 6.1% in June

August 1, 2014 by Tim McMahon

The U.S. Bureau of Labor Statistics (BLS) released the July Unemployment figures on August 1st. The Seasonally Adjusted Unemployment Rate was 6.2% up from 6.1% in June. The Unadjusted Unemployment rate was also up from 6.3% in June to 6.5% July. Of course the spin-doctors at the BLS said it was “virtually unchanged”.

BLS vs Gallup Unemployment NumbersIn a surprising turn of events, the unadjusted BLS numbers actually agree with the Gallup numbers with the rare occurrence that the BLS numbers are actually higher than the Gallup numbers for the first time in 17 months.

Of course, we shouldn’t get too excited because the “adjusted numbers” are still a bit on the low side and the smoke and mirrors coming out of the BLS have simply shifted to the Employment numbers.

Employment Numbers

According to the commissioner of the Bureau of Labor Statistics monthly report, “Total non-farm payroll employment increased by 209,000 in July, the same as its average monthly gain over the prior 12 months. In July, employment grew in professional and business services, manufacturing, retail trade, and construction.”

So we might begin to wonder if Employment went up, how did unemployment also go up? Of course, the [Read more…] about BLS Releases July Unemployment: 6.2% Up from 6.1% in June

Filed Under: Unemployment Tagged With: employment, unemployment

Wages Flat Since Last Year but Depend Upon Education

July 26, 2014 by Tim McMahon

Median Salaries Unchanged from Year Ago

According to the current Bureau of Labor Statistics (BLS ) news release on weekly earnings for the second quarter of 2014, the median weekly earnings for a full-time worker was $780 virtually unchanged from year ago levels. The median wage indicates that the same number of people earned more than $780 as earned less working a full-time job.

The data was collected as part of the Current Population Survey, a nationwide sample survey of households conducted by the BLS.

Wages By Education

Wages vary based on a variety of factors including experience but education played a major factor. Full-time workers age 25 and over without a high school diploma had median weekly earnings of only $492. Assuming an average 40 hour work week that would be an average of $12.30/hr. High school graduates with no college earned an average of $666 per week, those with a Bachelors Degree earned an average of $1098 while those with advanced degrees earned an average of $1,377.  [Read more…] about Wages Flat Since Last Year but Depend Upon Education

Filed Under: Education Tagged With: education, Salary

BLS Releases June Unemployment- 6.1%

July 4, 2014 by Tim McMahon

The U.S. Bureau of Labor Statistics (BLS) released the June Unemployment figures on July 3rd. The Seasonally Adjusted Unemployment Rate was 6.1% down from 6.3% in May. The Unadjusted Unemployment rate was the exact opposite 6.3% in June and 6.1% May. So was the unemployment rate up or down?

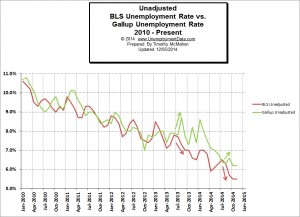
BLS_vs_Gallup_UnemploymentAccording to the Gallup poll people both adjusted and unadjusted were down. The unadjusted rate was 6.8% down from 7.0% in May and the adjusted unemployment rate was 6.5% down from 7.2% in May. As we can see from the chart to the left for almost a year now Gallup numbers have diverged drastically from the BLS numbers by roughly a full percent. but this month the divergence narrowed a bit to “only” 1/2 percent. For more information see:

Current US Unemployment Rate: 6.1% BLS or 6.5% Gallup

 U-6 Unemployment

U-6 includes all classes of unemployed even those considered  “marginally attached” and/or part-time for economic reasons. In other words, those who [Read more…] about BLS Releases June Unemployment- 6.1%

Filed Under: General

Unemployment by State and County

June 23, 2014 by Tim McMahon

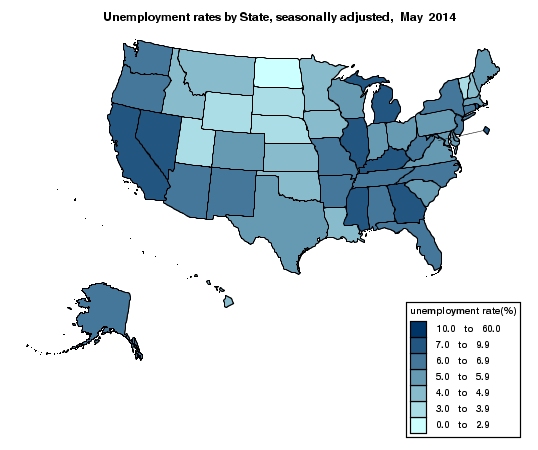
Unemployment rates vary drastically by state depending on local conditions and a state’s individual legislative policies. As a general rule those states with a “pro-business” stance have lower unemployment rates than those who punish businesses through high taxation and miles of “red-tape”.

Currently, North Dakota has the lowest unemployment rate at 2.6% while  Nevada has 7.9%, California has 7.6%, and Michigan and Illinois have 7.5%. While the Southern States of Kentucky and Mississippi have 7.7% unemployment and Georgia has 7.2% but right next door Alabama has 6.8% and South Carolina has 5.3%.May Unemployment Map 2014Source U.S. Bureau of Labor Statistics

Stories abound of the abundance of jobs in North Dakota where the shale oil boom is turning everyday Americans into millionaires. People with High School educations are earning over $100,000 per year because of the high demand for labor.  Of course along with higher wages, the cost of living especially for food and housing is much higher as well due to the short supply.

Here is a Table of the Unemployment Rate by State:

Map Title: Unemployment rates by State, seasonally adjusted
Map Type:  state Map
Month/Year: May/2014
State May
2014
Alabama 6.8
Alaska 6.4
Arizona 6.8
Arkansas 6.4
California 7.6
Colorado 5.8
Connecticut 6.9
Delaware 5.9
District of Columbia 7.5
Florida 6.3
Georgia 7.2
Hawaii 4.4
Idaho 4.9
Illinois 7.5
Indiana 5.7
Iowa 4.4
Kansas 4.8
Kentucky 7.7
Louisiana 4.9
Maine 5.7
Maryland 5.6
Massachusetts 5.6
Michigan 7.5
Minnesota 4.6
Mississippi 7.7
Missouri 6.6
Montana 4.6
Nebraska 3.6
Nevada 7.9
New Hampshire 4.4
New Jersey 6.8
New Mexico 6.5
New York 6.7
North Carolina 6.4
North Dakota 2.6
Ohio 5.5
Oklahoma 4.6
Oregon 6.9
Pennsylvania 5.6
Rhode Island 8.2
South Carolina 5.3
South Dakota 3.8
Tennessee 6.4
Texas 5.1
Utah 3.6
Vermont 3.3
Virginia 5.1
Washington 6.1
West Virginia 6.3
Wisconsin 5.7
Wyoming 3.8

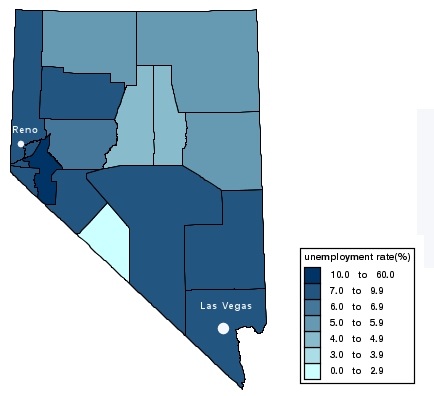
However, the picture for individual states is not uniform, even some individual counties within a state are better off than adjoining counties. For instance in Nevada:

Nevada Unemployment


Lyon county near Reno, had about 52,000 people in the 2010 census and from 2000 until 2008, it was one of the fastest growing counties in the United States. However, its growth rate collapsed during 2008 and currently has 10.4% unemployment.


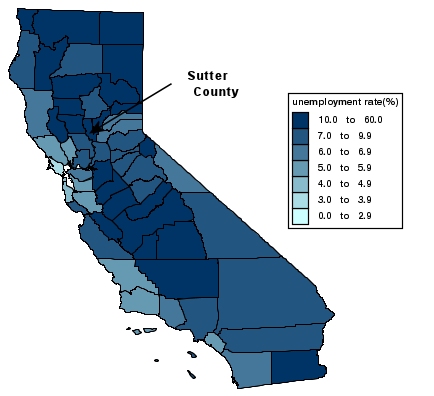
California Unemployment by County:

California Unemployment

Sutter county had a population of just over 95,000 people in 2013. The county has a total area of 608 square miles with 88% being farmland.

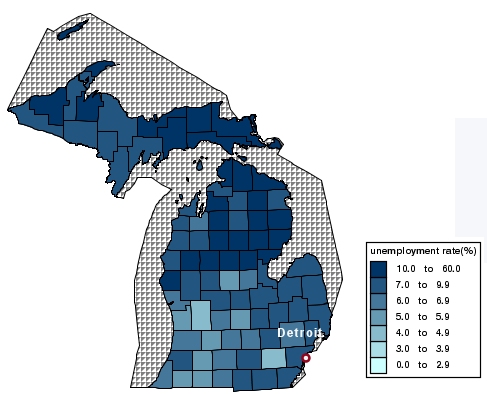
Michigan:

Michigan Unemployment

Mackinac County has 17.8% unemployment,  while both Cheboygan and Presque Isle Counties have 14.9% unemployment at the other end of the spectrum Kent county has 4.8% unemployment.

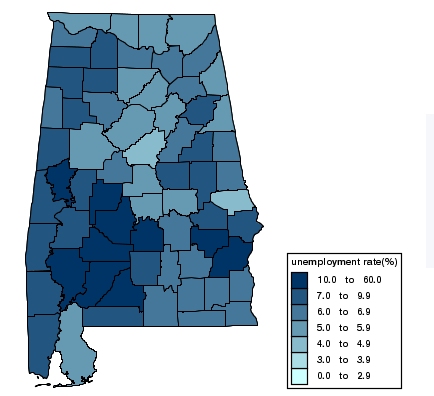
Alabama:

Alabama- May

Wilcox county has 15.5% unemployment, Green County has 12.7%, Perry and Monroe Counties have 11.9 and 11.8% respectively but Tuscaloosa and Madison counties have only 5.5% and Cleburne and Cherokee counties have 5.4% and 5.3% respectively.

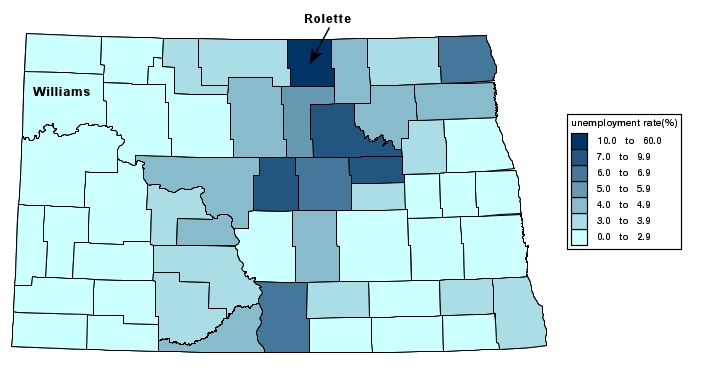
After looking at all the high unemployment states let’s take a moment to look at the state with the lowest unemployment, North Dakota.

North Dakota Unemployment

Rolette county is the home of the Turtle Mountain Indian Reservation and has the dubious honor of having the highest unemployment in the state at 11.6% and Williams county the home of Williston (the center of the shale oil boom) has the lowest at 0.9%.

Other low unemployment counties include Dunn at 1.1%, Mountrail and Slope at 1.3%, Billings and McKenzie at 1.4%, and Bowman at 1.5%.

Filed Under: General

Productivity Down in First Quarter 2014

June 4, 2014 by Tim McMahon

The U.S. Bureau of Labor Statistics (BLS) released its revised estimate of productivity and costs for the first quarter of 2014. According to this report productivity in the “Non-farm” sector fell drastically.  “The decrease in productivity was the largest since the first quarter of 2008 (-3.9 percent).”

Productivity is a measure of how much stuff is produced per hour of labor (not including farming).  It is “annualized” based on “seasonally adjusted” numbers.

Productivity Q1 2014

Due in part to the drastic drop in productivity, businesses suffered a massive increase in labor costs as they increased 5.7% on an annual basis.

Labor Costs

Manufacturing Productivity Up

Even though Non-farm productivity was down drastically (-3.5%) the decrease was limited to the “Business” sector with “manufacturing” productivity actually up 3.8% and it’s subset durable manufacturing up 4.1%.  Durable goods are things that do not wear out quickly such as household appliances, cars, consumer electronics, furniture, sports equipment, firearms, and toys.

Business sector output does not include government, non-profit institutions or private households but even so it makes up 76% of the entire Gross Domestic Product (GDP).

So although business productivity was down manufacturing productivity was actually up.

Filed Under: Employment Costs

Proper Business Attire for Women- Infographic

May 5, 2014 by Tim McMahon

There is an old saying “the clothes make the man” or in this case the woman.  In the modern culture many women think, “oh, I should be able to be myself” and “they shouldn’t judge me by how I dress” and “I just want to be comfortable”. 

But unfortunately people’s brains are wired to make snap judgements and once they are made it is difficult to change them. So unless you are working in a stable you shouldn’t dress like you are.

Here are some great tips on dressing for success in the modern business world. [Read more…] about Proper Business Attire for Women- Infographic

Filed Under: Success Tagged With: Women How to Dress

  • « Go to Previous Page
  • Page 1
  • Interim pages omitted …
  • Page 34
  • Page 35
  • Page 36
  • Page 37
  • Page 38
  • Interim pages omitted …
  • Page 44
  • Go to Next Page »

Primary Sidebar

Search Site

Sponsored:

URGENT: These Stocks Stand Poised to Benefit from President Trump's Trade Wars!

As the Trump administration moves ahead with aggressive tariff policies on key imports, the mainstream media is scrambling.

This Free Report - which you can download now - reveals the names and ticker symbols of 5 Stock Poised to Benefit Most from President Trump's Tariff Wars.

Click Here to Download Your FREE Stock Report Now.

Recent Posts

  • April 2025 Employment / Unemployment Report
  • Would More Jobs Help Social Security?
  • March 2025- Employment / Unemployment Report
  • February 2025 Jobs Report
  • January 2025 BLS Employment Report

Resources

  • Bureau of Labor Statistics Current Population Survey Monthly survey of households conducted by the Bureau of Census for BLS. It provides data on the labor force, employment, unemployment, etc.
  • Capital Professional Services Providing web design and development and Internet marketing services
  • Elliott Wave University Using the Elliott Wave Principle to improve investment performance
  • Financial Trend Forecaster Featuring Moore Inflation Predictor, NYSE Rate of Change and NASDAQ Rate of change
  • InflationData.com Inflation calculators, databases, etc.
  • Intergalactic Web Designers Web design and development services
  • Your Family Finances

Articles by Category

Articles by Date

Disclaimer

At UnemploymentData.com we are not registered investment advisors and do not provide any individualized advice. Past performance is not necessarily indicative of future performance and future accuracy and profitable results cannot be guaranteed.

Privacy & Terms of Use

Privacy Statement & Terms of Use

Do Not Sell My Information

Copyright © 2025 · News Pro on Capital Professional Services, LLC. All rights reserved · Log in