• Skip to primary navigation
  • Skip to main content
  • Skip to primary sidebar
  • Home
  • Contact us
  • Related Sites
    • InflationData.com
    • Financial Trend Forecaster
    • Your Family Finances
    • Elliott Wave University
    • Optio Money
  • About
    • Terms of Use
    • Disclaimer & Disclosure
    • Privacy Statement
  • Sitemap
    • 2009-2010 Posts
    • 2011 Posts

UnemploymentData.com

Your Source for Employment and Unemployment Data

Unemployment
  • Charts
    • Current Unemployment Rate Chart
    • Current Employment (Chart and Data)
    • Current Employment vs Unemployment Chart
    • Historical Employment Data
    • Employment Population Ratio
    • Misery Index
  • Unemployment
    • Historical Unemployment Rate Tables
    • What Is U-6 Unemployment?
    • Unadjusted vs. Seasonally Adjusted U-3 Unemployment Rate
    • BLS vs. Gallup Unemployment Numbers
    • Current U-6 Unemployment Rate
    • What is the Labor Force Participation Rate?
    • What is the Real Unemployment Rate?
  • Employment
    • Current Employment (Chart and Data)
    • Historical Employment Data
    • Contacting a Live Person at the State Employment Commission
      • How to Talk to a Live Person at the Virginia Unemployment Commission
      • Florida’s FLUID Unemployment Program
    • Benefits
      • Insurance
      • Retirement
    • Careers
    • Employment Costs
    • Experience
    • Government
    • Job Hunting
      • Interview
      • Resume
  • Find Articles
  • Education
    • Skills
  • General
    • Small Business
      • Outsourcing
    • Success
You are here: Home / Archives for employment

employment

August Unemployment Numbers

September 1, 2017 by Tim McMahon

The U.S.Bureau of Labor Statistics (BLS) released the August unemployment numbers today. The BLS Commissioner says: “Nonfarm payroll employment increased by 156,000 in August, and the unemployment rate was little changed at 4.4 percent. Job gains occurred in manufacturing, construction, professional and technical services, health care, and mining. Employment growth has averaged 176,000 per month thus far this year, about in line with the average monthly gain of 187,000 in 2016.”

Actual employment in July was 146,330,000 and 146,541,000 in August for a net gain of 211,000 even though according to the Commissioner it was 156,000 on a “Seasonally Adjusted” basis.

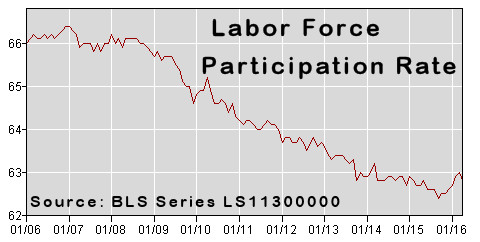
  • Adjusted U-3 Unemployment was 4.4% up from 4.3% in July.
  • Unadjusted U-3 Unemployment was 4.5% down from 4.6% in July.
  • Employment Increase 156,000 on a “Seasonally Adjusted” or 211,000 non-adjusted.
  • U-6 Unemployment was 8.6% down from 8.9% in July.

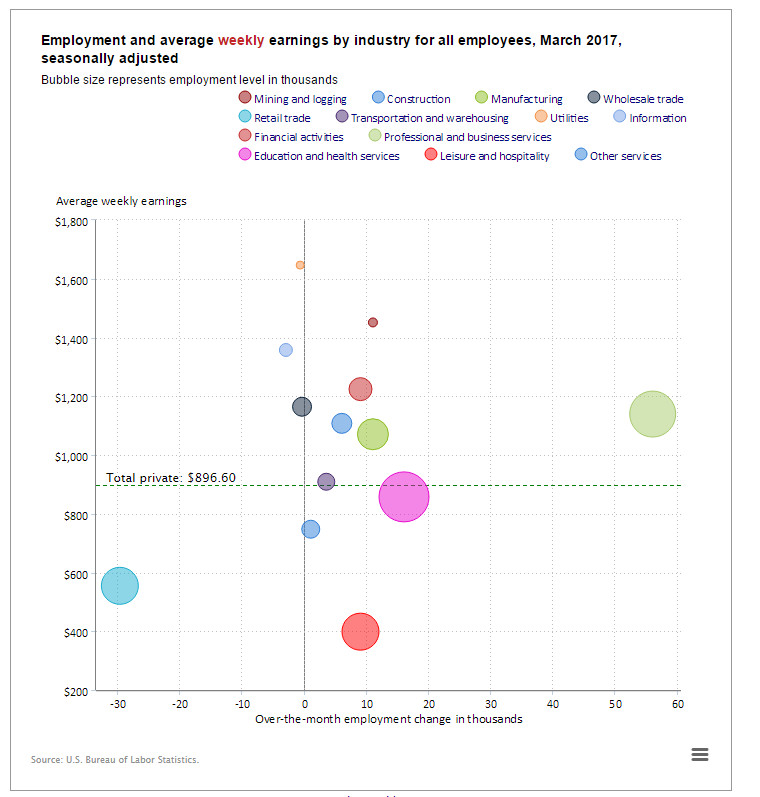
August Employment Gain and Loss Bubbles

In the following chart from the BLS we can see [Read more…] about August Unemployment Numbers
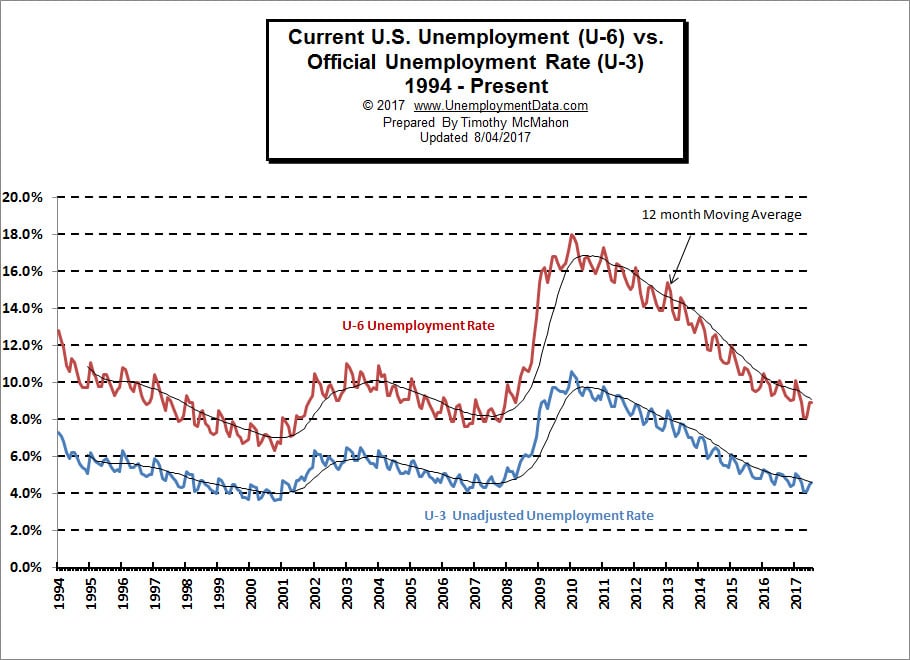
Filed Under: Unemployment Tagged With: August 2017, employment, Employment Bubbles, Labor Force Participation Rate

1 Million Fewer Jobs but BLS Says 209 K More

August 4, 2017 by Tim McMahon

U-3 Unemployment

The U.S. Bureau of Labor Statistics (BLS) released their employment and unemployment numbers for July on Friday August 4th.  The Seasonally adjusted U-3 unemployment rate was down from 4.4% in June to 4.3% in July. Unadjusted U-3 however was up from 4.5% to 4.6%. U3 is the Official unemployment rate per the International Labor Organization definition. It occurs when people are without jobs and they have actively looked for work within the past four weeks.

U-6 Unemployment

U-6 unemployment is the broadest category of unemployment and includes U3 plus “discouraged workers”, plus other “marginally attached workers”, plus part-time workers who want to work full-time, but cannot due to economic reasons. U-6 was unchanged from June at 8.9%.


Employment

The Commissioner of the BLS released this statement, “Nonfarm payroll employment rose by 209,000 in July, and the unemployment rate, at 4.3 percent, was little changed. Job gains occurred in food services and drinking places, professional and business services, and health care. Employment growth has averaged 184,000 per month thus far this year, in line with the  average monthly gain in 2016 (+187,000). “

However if we look at the actual employment data we get a different picture.  [Read more…] about 1 Million Fewer Jobs but BLS Says 209 K More

Filed Under: Employment, Unemployment Tagged With: Bubbles, employment, gallup, U-3, U-6, U3, U6, unemployment

May Employment and Unemployment Numbers

June 2, 2017 by Tim McMahon

The U.S.Bureau of Labor Statistics (BLS) released the May unemployment numbers today. The BLS Commissioner says: Nonfarm payroll employment increased by 138,000 in May, but these are Seasonally Adjusted numbers. So since typically employment increases in May, what he is saying is that 138,000 more jobs than average were created. In unadjusted terms employment was 145.938 million in April and 146.748 in May for a net gain of  810,000 jobs. Adjusted U-3 Unemployment was 4.3% down from 4.4% in April. Unadjusted U-3 Unemployment was 4.1% unchanged from April.

Gallup Unadjusted U-3 was 5.2% down from 5.4% in April. Gallup’s unadjusted U-6 Unemployment was 8.1% unchanged from April. Gallup’s U-6 was 13.8% Down from 14.0% in April.

May Employment Gain and Loss Bubbles

In the following chart from the BLS we can see [Read more…] about May Employment and Unemployment Numbers

Filed Under: BLS, Employment Tagged With: employment, Good Jobs Index, Labor Force, Labor Force Participation Rate, LFPR, P2P, unemployment

Unemployment Down in March

April 8, 2017 by Tim McMahon

The U.S. Bureau of Labor Statistics (BLS) released their monthly Employment/Unemployment report for the month ending in March on April 7th.  The widely publicized Seasonally Adjusted U-3 Unemployment rate was 4.5% down from 4.7% in February. While the broader U-6 unemployment rate that includes discouraged workers and other “marginally attached” individuals was 8.9% down from 9.5% in February.

The BLS’ Unadjusted U-3 was 4.6% in March down from 4.9% in February. The Gallup alternatives presented mixed results with Gallup’s Unadjusted U-3 at 5.7% up from 5.5% in February while Gallup’s version of the U-6 was unchanged at 13.7%.

The BLS Commissioner’s statement said, “The unemployment rate declined by 0.2 percentage point to 4.5 percent in March. Nonfarm payroll employment edged up by 98,000, following gains in January (+216,000) and February (+219,000). In March, job gains occurred in professional and business services and in mining, while retail employment declined.”

In the above chart we can see [Read more…] about Unemployment Down in March

Filed Under: BLS Tagged With: employment, March Unemployment

New Unemployment Numbers- February

March 13, 2017 by Tim McMahon

On Friday March 10th the U.S. Bureau of Labor Statistics released their Employment and Unemployment numbers for February 2017. The media was making a big deal about these numbers because they represent the “First full month since Trump took office”.

The numbers turned out to be moderately “Bullish” although the Commissioner’s statement said, “Total nonfarm payroll employment increased by 235,000 in February, and the unemployment rate was little changed at 4.7 percent. Employment gains occurred in construction, private educational services, manufacturing, health care, and mining.”

Now,   I’m not complaining… gaining 235,000 jobs is certainly better than losing them but what’s the big deal?  Well, first of all, the big deal is that [Read more…] about New Unemployment Numbers- February

Filed Under: BLS Tagged With: BLS, employment, jobs, unemployment

January Unemployment

February 3, 2017 by Tim McMahon

Unemployment RateThe U.S. Bureau of Labor Statistics (BLS) released the newest unemployment data for January 2017 on Friday, February 3rd. According to the BLS, the current “Seasonally Adjusted” Unemployment Rate is 4.8% up from 4.7% in December and 4.6% in November but still below the 4.9% in October.

The current “Unadjusted” rate is 5.1% up from 4.5% in December and 4.4% in November. Typically unadjusted unemployment rates jump in January for “Seasonal” reasons which is why we see a large jump in the unadjusted rates but a much smaller jump in the seasonally adjusted unemployment rate. See Current Unemployment Rate for more info.


U.S. Employment ChartThe number of Unadjusted jobs reported for January was [Read more…] about January Unemployment

Filed Under: Unemployment Tagged With: 2017, employment, January, unemployment

August Unemployment Numbers- 4.9%

September 2, 2016 by Tim McMahon

The U.S. Bureau of Labor Statistics (BLS) released the Unemployment numbers for the month of August on Friday September 2nd. The commonly quoted Seasonally Adjusted U-3 Unemployment rate was 4.9% for the third month in a row. The unadjusted U-3 Unemployment rate was 5.0% and Gallup’s equivalent was 5.4% for a “mere” 0.4% difference.

The broader U-6 Unemployment rate (also unadjusted) which includes “discouraged workers”, “marginally attached workers” and Part time workers who want to work full-time was 9.7% in August while Gallup’s equivalent which they call the “Underemployment rate” was 3.4% higher at 13.1%. The civilian non-institutional population increased another 234,000 this month bringing it to 253,854,000.

According to the BLS Commissioner’s report for this month:

Unemployment Rate“Nonfarm payroll employment increased by [seasonally adjusted~ editor] 151,000 in August, and the unemployment rate remained at 4.9 percent. Employment continued to trend up in several service-providing industries. Incorporating revisions for June and July, which reduced nonfarm payroll employment by 1,000 on net, monthly job gains have averaged 232,000 over the past 3 months. In the 12 months prior to August, employment growth averaged 204,000 per month. Employment in food services and drinking places continued to trend up in August (+34,000). Over the year, the industry has added 312,000 jobs… Mining employment continued on a downward trend in August (-4,000). Although job losses have moderated in the last 3 months, employment in mining has fallen by 223,000 since a peak in September 2014.”

In other words, the vast majority of the jobs [Read more…] about August Unemployment Numbers- 4.9%

Filed Under: BLS Tagged With: BLS, employment, gallup, unemployment

Employment and Unemployment Rates Jump in June???

July 8, 2016 by Tim McMahon

June 2016 Unemployment rateOn Friday July  8th, the U.S. Bureau of Labor Statistics (BLS) released their newest unemployment data for June 2016.  According to the BLS, the current “Seasonally Adjusted” Unemployment Rate is 4.9% up from 4.7% for May. The current “Unadjusted” rate is 5.1% up from 4.5% in May.

In an interesting twist, although total non-farm payroll employment increased by 287,000 in June, the unemployment rate also rose to 4.9 percent from 4.7%. [Read more…] about Employment and Unemployment Rates Jump in June???

Filed Under: Unemployment Tagged With: employment, U3, U6, unemployment

May’s “Terrible” Jobs Report

June 4, 2016 by Tim McMahon

On June 3rd the U.S. Bureau of Labor Statistics released its “surprisingly weak” monthly Employment Report which the media is touting as “terrible”.  According to the media “only 38,000 jobs were created” in the month of May. Although experts were predicting an increase two or three times as large.

This was the smallest gain since September 2010 partially fueled by the Verizon strike of 34,000 but even with that extra 34,000 payrolls would have increased by only 72,000. Fed Chair Janet Yellen has said monthly gains of roughly 100,000 jobs are needed to keep up with growth in the work-age population.

However, like most Government statistics it is only half the story. First of all, the numbers quoted are

[Read more…] about May’s “Terrible” Jobs Report

Filed Under: Unemployment Tagged With: employment, Labor Force Participation Rate, unemployment

BLS Monthly Employment Report for April

May 6, 2016 by Tim McMahon

The US economy added 160,000 “seasonally adjusted” jobs in April, the lowest figure in the last seven months. The adjusted U-3 unemployment rate remained steady at 5%. The Unadjusted U-3 fell to 4.7% while the Unadjusted U-6 fell to 9.3% from 9.9% last month.
Job Creation April 2016On a seasonally adjusted basis employment has fallen while on a non-adjusted basis the actual number of non-farm employed has increased from 142.887 Million to 143.944 million for a net increase of  1,057,000 jobs but since April traditionally sees a large increase in seasonal workers the seasonally adjusted number says that we were only 160,000 jobs better than what we would expect if there were zero jobs growth.

Labor Force Participation Rate

The Labor Force Participation Rate (LFPR) is the percentage of the Labor Force that is currently either looking for a job or actually has one. So even though it sounds like it is talking about how many people are working it actually is the percentage who “want to work”.  As of  April this stands at 62.8%. This rate has been steadily falling for a number of years and has reached levels not seen since the 1970’s.

Since the Bureau of Labor Statistics measures unemployment as the percentage of the labor force that can’t find work as people stop looking for work they fall out of the labor force and are no longer counted. Thus the unemployment rate can fall even though no new jobs have been created.

Labor Force Participation Rate Apr-2016

Long Term Labor Force Participation Rate

Labor Force Participation Rate 1950-Feb2016As we can see from the above chart the LFPR peaked in the late 1990’s and fell during the recession from 2000 through 2004. From 2004 through 2007 it leveled off  but then the “Great Recession” hit and the LFPR has fallen pretty steadily since. And even though we are supposed to be in a recovery the LFPR continues to fall although there was a bit of an up tick at the end of 2015 and early 2016, April’s LFPR is lower than March’s.

Some people wrongly assume that the LFPR is falling due to retiring baby-boomers.  This premise however has been proven false. See Record Low LFPR which shows the LFPR by age group since 1999. The biggest declines occur in the younger ages while those above age 60 actually show a higher percentage are working. For instance, in 1999 only 24% of those age 65-69 were working but according to the BLS in 2015 30.8% of those age 65-69 were working.

Gallup “Good Jobs” Index

Gallup’s “Good Jobs” Index is their version of the LFPR it is calculated as a percentage of the total population rather than limiting it to the “work force”.  So although the percentage is lower it is a better indicator of the actual situation since it is not subject to fudging through simply redefining who is in the “work force”. Gallup says 44.9% of the total adult population is in the “Good Jobs” Index i.e. has a full-time job. This does not mean that they are employed at their full capacity or that they are earning a “decent wage” simply that they are employed full-time. Gallup defines a full-time as 30+ hours per week for an employer who provides a regular paycheck. This is up from 44.5% last month confirming the seasonal increase in employment mentioned above.

Filed Under: Employment Tagged With: 2016, April, employment, Good Jobs Index, Labor Force Participation, unemployment

  • « Go to Previous Page
  • Page 1
  • Interim pages omitted …
  • Page 7
  • Page 8
  • Page 9
  • Page 10
  • Page 11
  • Page 12
  • Go to Next Page »

Primary Sidebar

Rate Any Stock In Seconds

Get a detailed stock report showing its true value, safety score, and ideal timing to buy. Plus, receive a color coded Buy, Sell, or Hold recommendation.

Get Your Free Stock Analysis Here.

Recent Posts

  • BLS Releases May 2026 Jobs Report
  • May Jobs Report for April 2026
  • Inflation vs Unemployment Challenge FED’s Resolve
  • Jobs AI Can’t Destroy: Careers for 2026 and Beyond
  • Why February 2026’s Jobs Report Was an Anomaly, Not a Trend

Search Site

Resources

  • Bureau of Labor Statistics Current Population Survey Monthly survey of households conducted by the Bureau of Census for BLS. It provides data on the labor force, employment, unemployment, etc.
  • Capital Professional Services Providing web design and development and Internet marketing services
  • Elliott Wave University Using the Elliott Wave Principle to improve investment performance
  • Financial Trend Forecaster Featuring Moore Inflation Predictor, NYSE Rate of Change and NASDAQ Rate of change
  • InflationData.com Inflation calculators, databases, etc.
  • Intergalactic Web Designers Web design and development services

Articles by Category

Articles by Date

Disclaimer

At UnemploymentData.com we are not registered investment advisors and do not provide any individualized advice. Past performance is not necessarily indicative of future performance and future accuracy and profitable results cannot be guaranteed.

Privacy & Terms of Use

Privacy Statement & Terms of Use

Do Not Sell My Information

Copyright © 2026 · News Pro on Capital Professional Services, LLC. All rights reserved · Log in