• About WordPress
    • WordPress.org
    • Documentation
    • Learn WordPress
    • Support
    • Feedback
  • Log In
  • Skip to primary navigation
  • Skip to main content
  • Skip to primary sidebar
  • Home
  • Contact us
  • Related Sites
    • InflationData.com
    • Financial Trend Forecaster
    • Your Family Finances
    • Elliott Wave University
    • Optio Money
  • About
    • Terms of Use
    • Disclaimer & Disclosure
    • Privacy Statement
  • Sitemap
    • 2009-2010 Posts
    • 2011 Posts

UnemploymentData.com

Your Source for Employment and Unemployment Data

Unemployment
  • Charts
    • Current Unemployment Rate Chart
    • Current Employment Rate (Chart and Data)
    • Current Employment vs Unemployment Chart
    • Historical Employment Data
    • Employment Population Ratio
    • Misery Index
  • Unemployment
    • Historical Unemployment Rate Tables
    • What Is U-6 Unemployment?
    • Unadjusted vs. Seasonally Adjusted U-3 Unemployment Rate
    • BLS vs. Gallup Unemployment Numbers
    • Current U-6 Unemployment Rate
    • What is the Labor Force Participation Rate?
    • What is the Real Unemployment Rate?
  • Employment
    • Current Employment Rate (Chart and Data)
    • Historical Employment Data
    • Contacting a Live Person at the State Employment Commission
      • How to Talk to a Live Person at the Virginia Unemployment Commission
      • Florida’s FLUID Unemployment Program
    • Benefits
      • Insurance
      • Retirement
    • Careers
    • Employment Costs
    • Experience
    • Government
    • Job Hunting
      • Interview
      • Resume
  • Find Articles
  • Education
    • Skills
  • General
    • Small Business
      • Outsourcing
    • Success
You are here: Home / Archives for gallup

gallup

1 Million Fewer Jobs but BLS Says 209 K More

August 4, 2017 by Tim McMahon

U-3 Unemployment

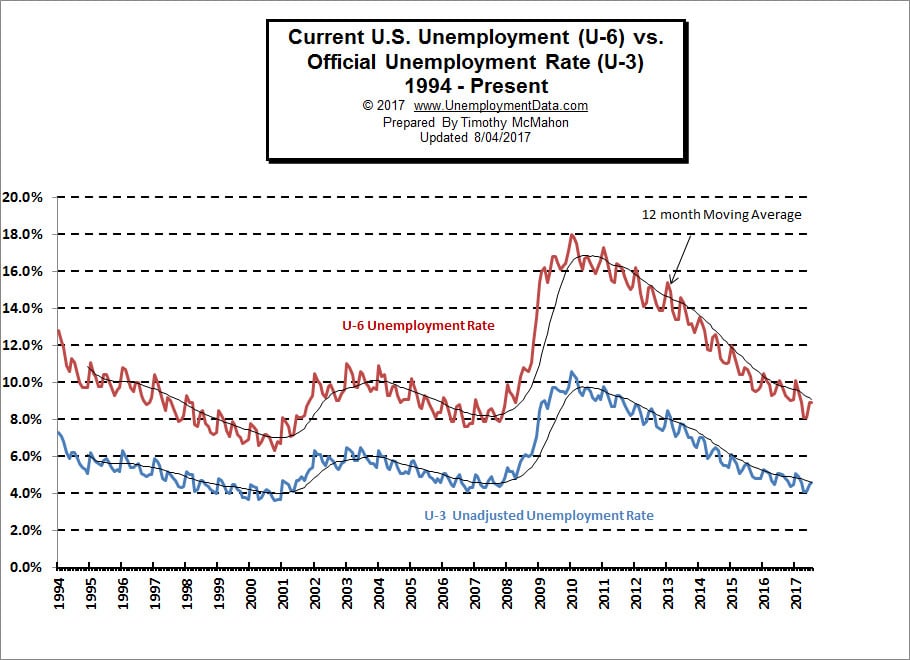
The U.S. Bureau of Labor Statistics (BLS) released their employment and unemployment numbers for July on Friday August 4th.  The Seasonally adjusted U-3 unemployment rate was down from 4.4% in June to 4.3% in July. Unadjusted U-3 however was up from 4.5% to 4.6%. U3 is the Official unemployment rate per the International Labor Organization definition. It occurs when people are without jobs and they have actively looked for work within the past four weeks.

U-6 Unemployment

U-6 unemployment is the broadest category of unemployment and includes U3 plus “discouraged workers”, plus other “marginally attached workers”, plus part-time workers who want to work full-time, but cannot due to economic reasons. U-6 was unchanged from June at 8.9%.


Employment

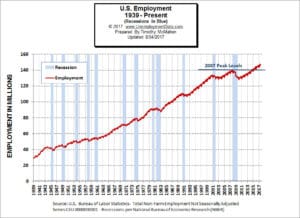
The Commissioner of the BLS released this statement, “Nonfarm payroll employment rose by 209,000 in July, and the unemployment rate, at 4.3 percent, was little changed. Job gains occurred in food services and drinking places, professional and business services, and health care. Employment growth has averaged 184,000 per month thus far this year, in line with the  average monthly gain in 2016 (+187,000). “

However if we look at the actual employment data we get a different picture.  [Read more…] about 1 Million Fewer Jobs but BLS Says 209 K More

Filed Under: Employment, Unemployment Tagged With: Bubbles, employment, gallup, U-3, U-6, U3, U6, unemployment

Comparing Bureau of Labor Statistics Unemployment Numbers to an Independent Source

August 4, 2017 by Tim McMahon

NOTE: Gallup has STOPPED publishing their Unemployment Numbers effective in July 2017. This includes U-3, Underemployment (U-6), and Good Jobs Index (Payroll to Population Rate).

From 2010-2017,  the Gallup Survey people both generated numbers to help us understand the employment/unemployment situation. Unfortunately, they often presented a different picture from the numbers generated by the U.S. Bureau of Labor Statistics. Typically the BLS data presented a rosier picture than the independently surveyed Gallup numbers.

Often in the summer, the gap between the BLS and the Gallup closed. In July 2016, the BLS and the Gallup numbers came in identical. Early in 2017 the gap widened to 1.3% in April but has narrowed again to 0.6% in June.

For June 2017 Gallup said unadjusted U-3 unemployment was 5.1% down from 5.2% in May and 5.4% in April while the BLS said it was 4.5% up from 4.1% in May and April. So the spread is currently 0.6%.

Whose Unemployment Numbers are Right?

There has been some talk about “full employment” in the media of late and if we look at the Unemployment numbers created by the U.S. Bureau of Labor Statistics (BLS) we might get that impression. If we look at the Employment numbers rather than the Unemployment Rate we see a significant increase but it hasn’t been until recent months that the increase has actually outpaced the growth in the population.

We’ve looked at Employment vs. Unemployment on other pages to see how they compare and we’ve looked at U-6 (total labor force including those who’ve given up looking) vs. U-3 (those who are still actively looking).  The U-3 unemployment rate is the commonly quoted one. But the one problem is that all that data comes from the government. If they are fudging the numbers how would we know? Unless as we’ve noted before there are inconsistencies between the Unemployment and Employment Charts. But we  [Read more…] about Comparing Bureau of Labor Statistics Unemployment Numbers to an Independent Source

Filed Under: Unemployment Tagged With: fudged unemployment numbers, gallup, honest unemployment rate, real unemployment rate, true unemployment rate, underestimate unemployment, unemployment

Why the U.S. Isn’t at “Full Employment” Yet

May 5, 2017 by Tim McMahon

The news is bristling with excitement as all the major media outlets are jumping on today’s employment numbers hot off the Bureau of Labor Statistics presses. The BLS reported that the Seasonally Adjusted U-3 unemployment rate was just 4.4% and the unadjusted broader based U-6 was just 8.1%.

In response to all this good news The New York Times said, “We’re Getting Awfully Close to Full Employment” and The Wall Street Journal trumpeted “Jobs Report: This Is What Full Employment Looks Like” so who am I to throw cold water on their parade? Well, at least I’m not the only one to have my doubts. Jared Bernstein at The Washington Post thinks that the current low inflation level is a factor that may indicate that we aren’t quite there yet. So I’m adding my own two-cents with the following chart. We regularly publish the U-6 minus U-3 chart which shows the differential between the ordinary unemployed U-3 and the bottom of the barrel unemployed U-6. By definition, in order to be at “full-employment” everyone who wants a job has to have one.  That doesn’t mean Zero unemployment because there is a bit of friction in the system and so when people change jobs they are temporarily “unemployed” so there will always be some. Historically, this was assumed to be around 3% unemployment. So as the U-3 unemployment approaches 3% the U-6 people get drawn into the market. They may not have the skills or the ambition or the whatever but now they can find a job because companies are desperate.

So by looking at the U-6 minus the U-3 we can get a very good picture of when we are nearing “full employment”. So let’s look at that chart. [Read more…] about Why the U.S. Isn’t at “Full Employment” Yet

Filed Under: Unemployment Tagged With: full employment, gallup, Labor Force, Participation Rate, U6 minus U3

August Unemployment Numbers- 4.9%

September 2, 2016 by Tim McMahon

The U.S. Bureau of Labor Statistics (BLS) released the Unemployment numbers for the month of August on Friday September 2nd. The commonly quoted Seasonally Adjusted U-3 Unemployment rate was 4.9% for the third month in a row. The unadjusted U-3 Unemployment rate was 5.0% and Gallup’s equivalent was 5.4% for a “mere” 0.4% difference.

The broader U-6 Unemployment rate (also unadjusted) which includes “discouraged workers”, “marginally attached workers” and Part time workers who want to work full-time was 9.7% in August while Gallup’s equivalent which they call the “Underemployment rate” was 3.4% higher at 13.1%. The civilian non-institutional population increased another 234,000 this month bringing it to 253,854,000.

According to the BLS Commissioner’s report for this month:

Unemployment Rate
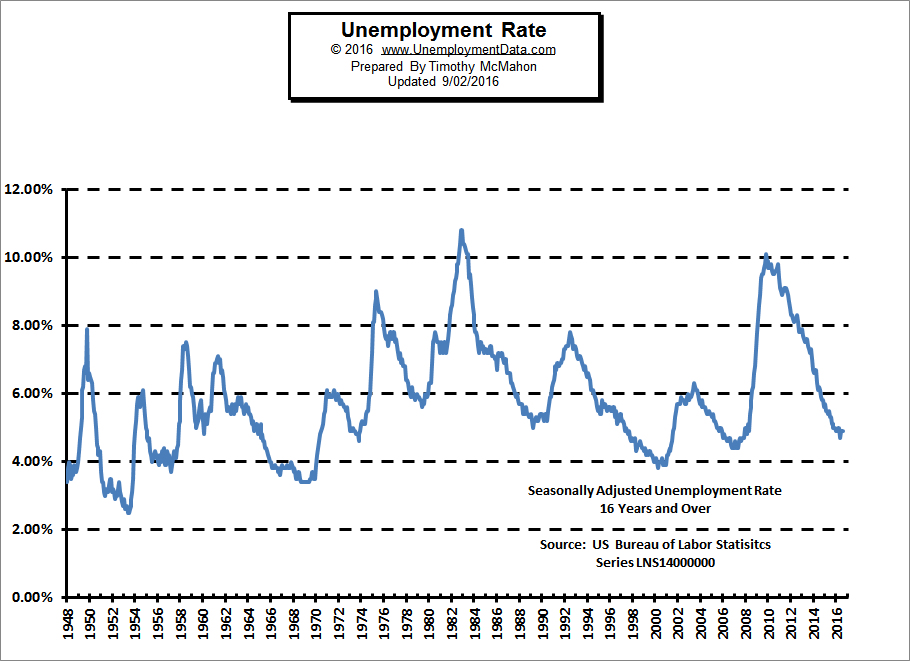
“Nonfarm payroll employment increased by [seasonally adjusted~ editor] 151,000 in August, and the unemployment rate remained at 4.9 percent. Employment continued to trend up in several service-providing industries. Incorporating revisions for June and July, which reduced nonfarm payroll employment by 1,000 on net, monthly job gains have averaged 232,000 over the past 3 months. In the 12 months prior to August, employment growth averaged 204,000 per month. Employment in food services and drinking places continued to trend up in August (+34,000). Over the year, the industry has added 312,000 jobs… Mining employment continued on a downward trend in August (-4,000). Although job losses have moderated in the last 3 months, employment in mining has fallen by 223,000 since a peak in September 2014.”

In other words, the vast majority of the jobs [Read more…] about August Unemployment Numbers- 4.9%

Filed Under: BLS Tagged With: BLS, employment, gallup, unemployment

Government Shutdown Delays Unemployment Data

October 4, 2013 by Tim McMahon

Due to the government shutdown the Bureau of Labor Statistics is not publishing the regular Unemployment statistics.

The Federal Reserve Bank of Atlanta President, Dennis Lockhart, says that it is fortunate that the FED chose not to begin “tapering” the money stimulus under the circumstances.  “We avoided a potentially very awkward situation of reducing stimulus just on  the eve of what now has developed” he said.

UnemploymentWhether the Quantitative Easing is actually having much of an effect on unemployment or not is a discussion for another day. But as we said in a recent article entitled: What’s So Bad about Shutting the Government Down? since we don’t have BLS numbers we will turn to the free market and get our numbers elsewhere. Besides, free market numbers are probably more accurate anyway.

Speaking of accuracy, according to [Read more…] about Government Shutdown Delays Unemployment Data

Filed Under: Unemployment Tagged With: BLS, FED, gallup, P2P, Poll, Tapering, unemployment

Private Sector Job Creation Slightly Down in May

June 6, 2012 by Tim McMahon

Job Creation in May

According to the most recent Gallup survey results U.S. job creation is at a 19 in May down from 20 in April but up from 18 in March. Gallup interviewed 16,913 workers in May and asked them whether they felt their employer was increasing, decreasing or maintaining the same size workforce. This is not the same as asking employers about actual jobs they have created but gives an indication of the perception of the people. Gallup believes that this is a strong predictor of the direction of Unemployment and U.S. Jobless claims.

Job Creation

According to Gallup, the +19 for May is comprised of 35% of the nationwide workers surveyed saying that they thought that their company was increasing their workforce (hiring) while 16% of those surveyed said they felt their employer was decreasing their workforce (laying-off). Thus 35-16=19.  The remaining 49% of the workers surveyed said that their company was holding steady neither hiring or firing.

Job Creation- Hiring vs Firing

 According to the U.S. Bureau of Labor Statistics (Seasonally adjusted ) the Non-Farm payrolls in May increased by 69,000 jobs. Unfortunately, the U.S. adds about 167,000 new men,women and children every month. Of course not all of them are workers but 69,000 new jobs will just about provide for 167,000 new people so the net effect is that the Unemployment rate would stay about the same.

The one ray of hope according to Gallup is that Government job creation which has been negative since 2009 has ticked up from -7 in April to -3 in May even though private sector hiring fell from 25 to 23. Gallup believes that overall the level is relatively flat for the month of May and that we will have to look at next month’s data to see if a trend is developing.

See the full article U.S. Job Creation Largely Steady in May on Gallup.com


Sources:

Poplulation

Labor Statistics- Employment Situation — MAY 2012

Gallup US Job Creation


Filed Under: General Tagged With: gallup, job creation, survey

Primary Sidebar

Search Site

Sponsored:

URGENT: These Stocks Stand Poised to Benefit from President Trump's Trade Wars!

As the Trump administration moves ahead with aggressive tariff policies on key imports, the mainstream media is scrambling.

This Free Report - which you can download now - reveals the names and ticker symbols of 5 Stock Poised to Benefit Most from President Trump's Tariff Wars.

Click Here to Download Your FREE Stock Report Now.

Recent Posts

  • April 2025 Employment / Unemployment Report
  • Would More Jobs Help Social Security?
  • March 2025- Employment / Unemployment Report
  • February 2025 Jobs Report
  • January 2025 BLS Employment Report

Resources

  • Bureau of Labor Statistics Current Population Survey Monthly survey of households conducted by the Bureau of Census for BLS. It provides data on the labor force, employment, unemployment, etc.
  • Capital Professional Services Providing web design and development and Internet marketing services
  • Elliott Wave University Using the Elliott Wave Principle to improve investment performance
  • Financial Trend Forecaster Featuring Moore Inflation Predictor, NYSE Rate of Change and NASDAQ Rate of change
  • InflationData.com Inflation calculators, databases, etc.
  • Intergalactic Web Designers Web design and development services
  • Your Family Finances

Articles by Category

Articles by Date

Disclaimer

At UnemploymentData.com we are not registered investment advisors and do not provide any individualized advice. Past performance is not necessarily indicative of future performance and future accuracy and profitable results cannot be guaranteed.

Privacy & Terms of Use

Privacy Statement & Terms of Use

Do Not Sell My Information

Copyright © 2025 · News Pro on Capital Professional Services, LLC. All rights reserved · Log in