![]() The U.S. Bureau of Labor Statistics (BLS) released their monthly unemployment survey results for February on March 8th and it has the market pundits wringing their hands over the mere 20,000 jobs created after projections were for 175,000 jobs. Optimists are blaming the government shutdown combined with the weather causing a lack of construction jobs in the Seasonally Adjusted jobs numbers.
The U.S. Bureau of Labor Statistics (BLS) released their monthly unemployment survey results for February on March 8th and it has the market pundits wringing their hands over the mere 20,000 jobs created after projections were for 175,000 jobs. Optimists are blaming the government shutdown combined with the weather causing a lack of construction jobs in the Seasonally Adjusted jobs numbers.
But if job creation is only 20,000 why is Unadjusted U-6 Unemployment down from 8.8% in January to 7.7% in February? Why has the unemployment rate for Hispanics dropped to another mega low of 4.3%? And why is the unemployment rate for Women 3.6%?
The non-seasonally adjusted jobs number is up by 827,000 jobs from January to February compared to an increase of 1.237 million during the same period last year and an increase of 1.03 million from January – February 2017. So, yes the increase is considerably smaller but as we near full employment it becomes progressively harder to find new employees even if you have jobs available. The problem shifts from a lack of jobs to a lack of qualified employees.
Key February Employment and Unemployment Numbers
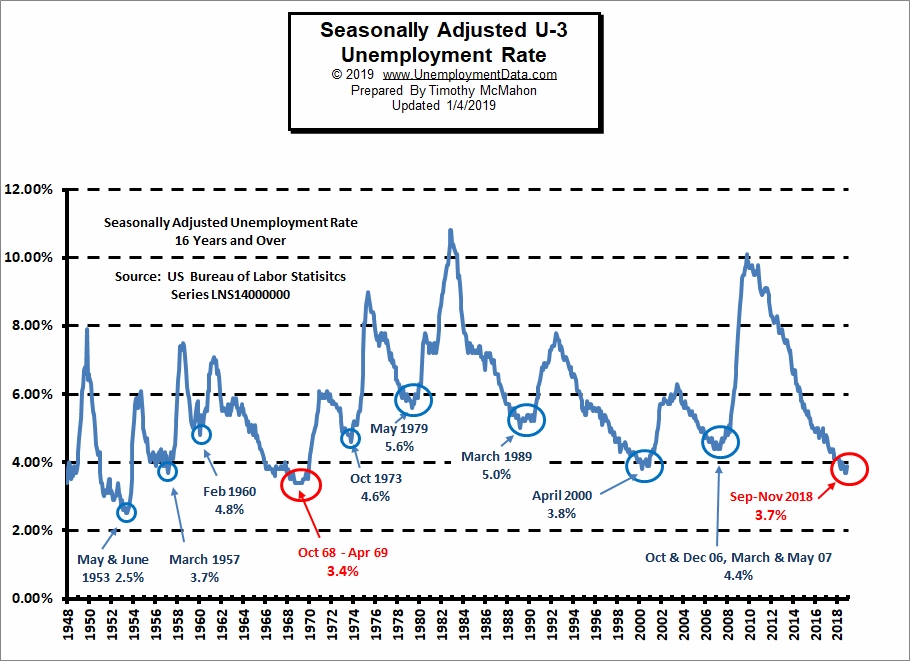
- Adjusted U-3 Unemployment- 3.8% down from 4.0% in January, 3.9% in December and 3.7% in November.
- Unadjusted U-3 Unemployment- 4.1% down from 4.4% in January, 3.7% in December and 3.5% in November.
- Unadjusted U-6 Unemployment- 7.7% down from 8.8% in January, 7.5% in December and 7.2% in November.
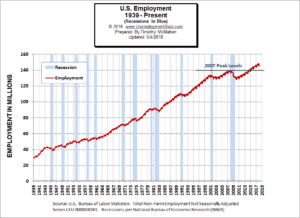
- Unadjusted Employment (Establishment Survey)- 149.133 up from 148.201 million in January, 151.190 million in December and 151.244 million in November.
- February Labor Force Participation Rate- Unchanged at 63.2% up from 63.1% in December and LFPR 62.9% highest since 2013.
- 101st straight gain in Seasonally Adjusted Employment- (Household Survey) 156.949 up from 156.694 in January
Current Seasonally Adjusted U-3 levels are hovering around the lows of 2000. Prior to that we have to go all the way back to 1969 to see better unemployment levels than we have currently. Current levels are rising a bit from a cyclical low not seen since 1969. Also noteworthy is that levels do not stay this low for very long. The longest low like this was the seven month period from October 1968 through April 1969. Prior to 1969 was a one month low of 3.7% in 1957. On the plus side, [Read more…] about February Unemployment- Only 20,000 New Jobs?
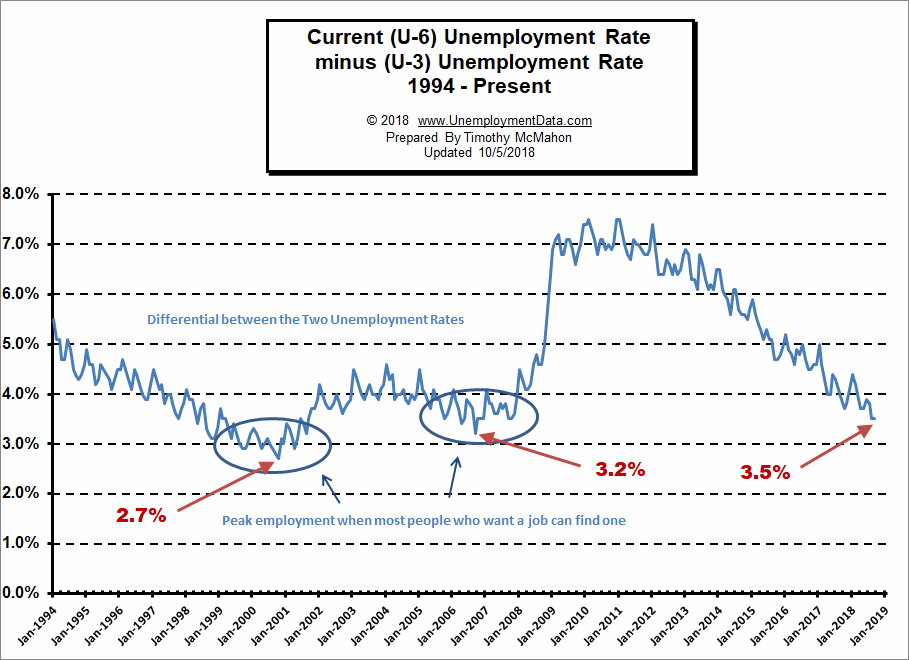
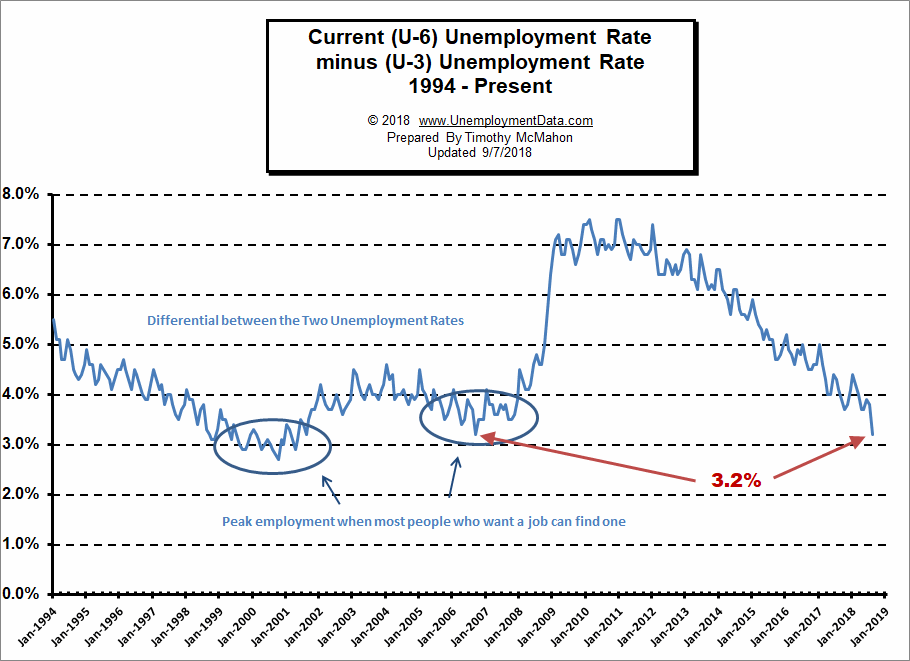
 Looking at the broader measure of