![]()
The U.S. Bureau of Labor Statistics (BLS) released its employment / unemployment report for May on June 5th.
COVID-19 Unemployment Decreases as People Return to Work
- Unadjusted U-3 was Down from 14.4% to 13.0%.
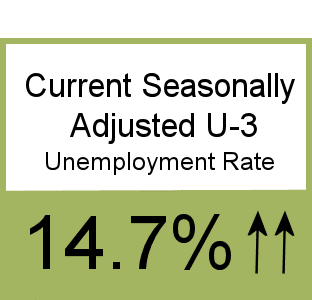
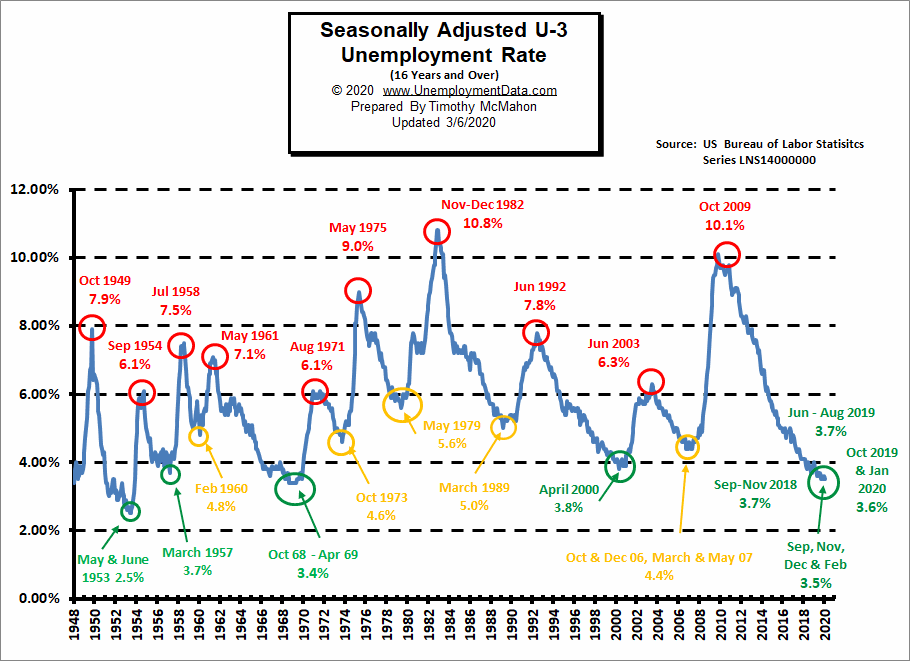
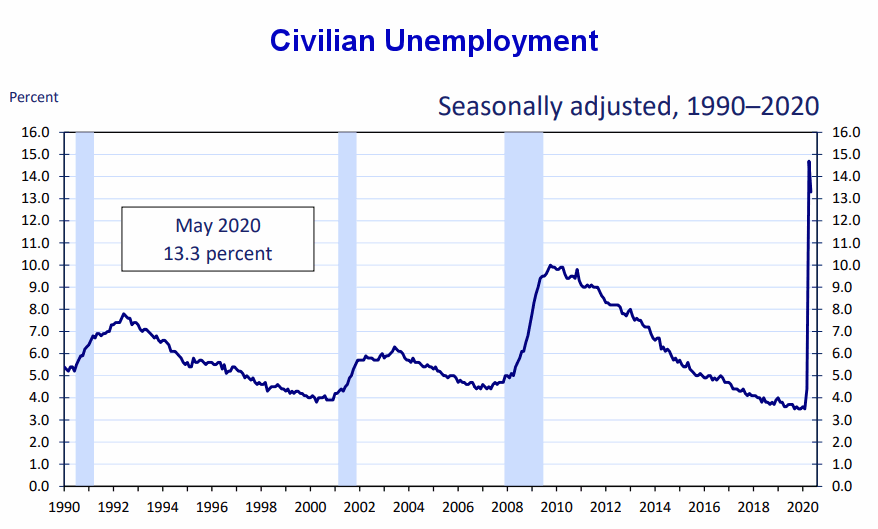
- Adjusted U-3 was Down from 14.7% to 13.3%.
- Unadjusted U-6 was Down from 22.4% to 20.7%.
- Labor Force Participation rose from 60.2% to 60.8%.
- Unadjusted Employment rose by approx. 2.9 million jobs.
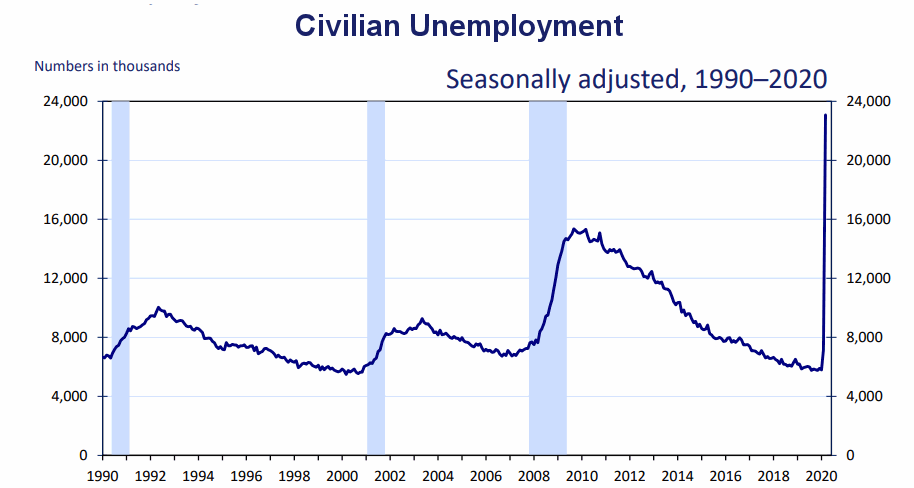
Civilian Unemployment
Economists were predicting another stairstep increase in unemployment in May. According to a CNBC article “Economists surveyed by Dow Jones had been expecting payrolls to drop by 8.33 million and the unemployment rate to rise to 19.5% from April’s 14.7%.”
Instead, Unemployment fell to 13.3% and payrolls rose by 2.9 million making the “experts” wrong by roughly 11 million.
According to the Commissioner of the U.S. Bureau of Labor Statistics:
“Nonfarm payroll employment increased by 2.5 million in May, and the unemployment rate declined by 1.4 percentage points to 13.3 percent. These improvements in the labor market reflected a limited resumption of economic activity that had been curtailed in March and April due to the coronavirus (COVID-19) pandemic and efforts to contain it.
In May, employment rose in several major industry sectors, with the largest gains in leisure and hospitality, construction, education and health services, and retail trade. By contrast, employment in government continued to decline sharply.”
Of course, he is talking about “Seasonally Adjusted Jobs” from the “Current Population Survey (CPS)”
rather than looking at the results reported by actual companies in their “Current Employment Statistics survey (CES)”
But looking at the CES report we see…
Originally the BLS reported 131.071 million jobs for April and then they subtracted 660,000 jobs from that estimate.
So currently they are saying 130.411 million jobs for April and 133.342 million jobs for May which is actually an increase of 2.271 million jobs compared to what they originally reported last month. Or 2.931 million jobs based on their current estimates of April’s employment.
[Read more…] about Unemployment Rate Falls Contrary to Economist’s Projections