Benefits denied!
 Benefits denied!
That’s the last thing you want to hear after losing your job and applying for unemployment benefits. But, don’t give up! There’s still hope, thanks mainly to the appeal process.
Reasons for Denial
There are several valid reasons for denial of benefits, including:
- Voluntarily leaving the workplace without just cause
- Being discharged for work misconduct
- Not being able or available for work
- Refusing an offer of suitable work
- Knowingly making false statements to obtain benefits
If you don’t agree with the reason provided for the denial of unemployment benefits, you can appeal the decision. So, how exactly do you appeal a denial of unemployment benefits?
Act Fast
Time is key in the appeal process. Depending on the state’s requirements, you have somewhere between 10 and 30 days to request an appeal. Unemployment agencies are sticklers for timeframes so missing a deadline without good reason will not help your chances.
It’s OK to go Pro Se
You don’t have to hire an attorney to [Read more…] about What You Can do When Your Unemployment Benefits are Denied
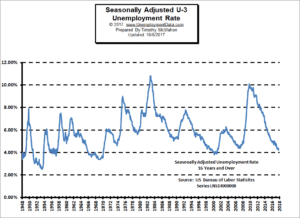

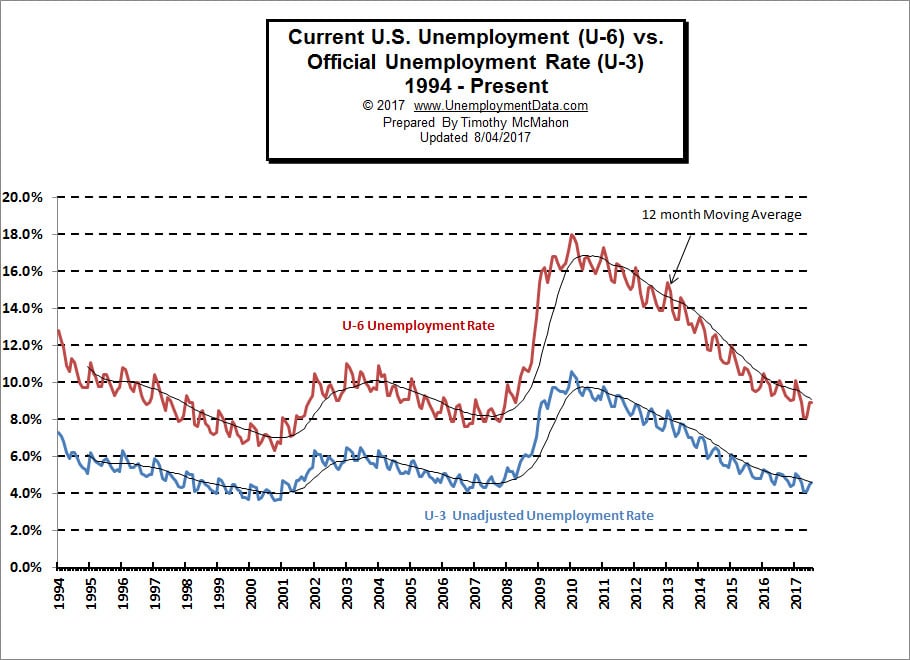 U-6 Unemployment
 There has been some talk about “full employment” in the media of late and if we look at the
 The number of Unadjusted jobs reported for January was
  While you may not look forward to going to work every morning, it does provide the income that you need to make the mortgage payment. However, if you are out of work, it doesn’t mean that you should immediately look to sell the family home. Obviously, the best solution would be to plan ahead and pay into an emergency fund which optimally would cover 6 months of living expenses. But what if you weren’t that farsighted?
 The
The