Is Employment Up or Down?
![]()
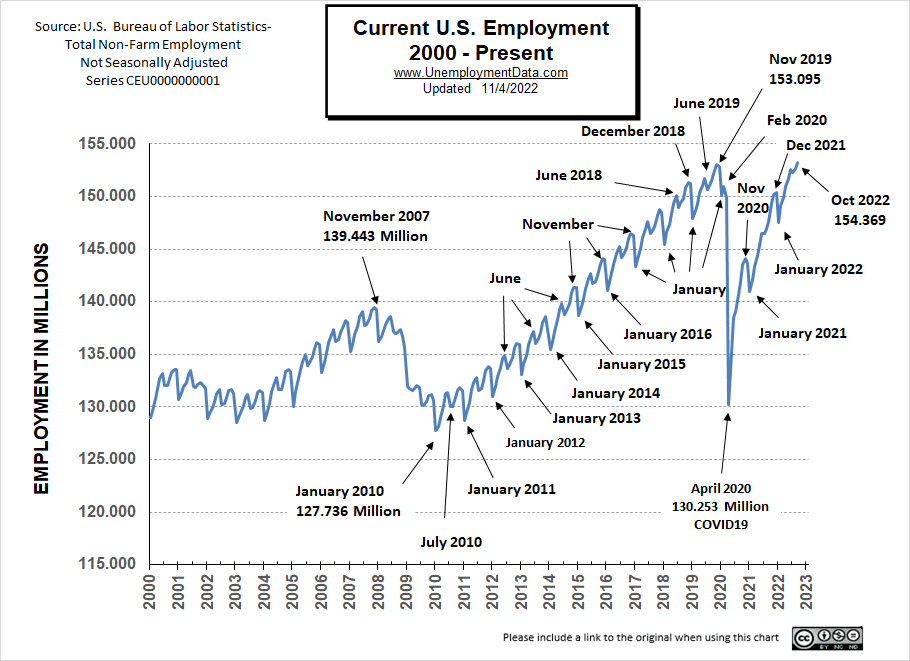
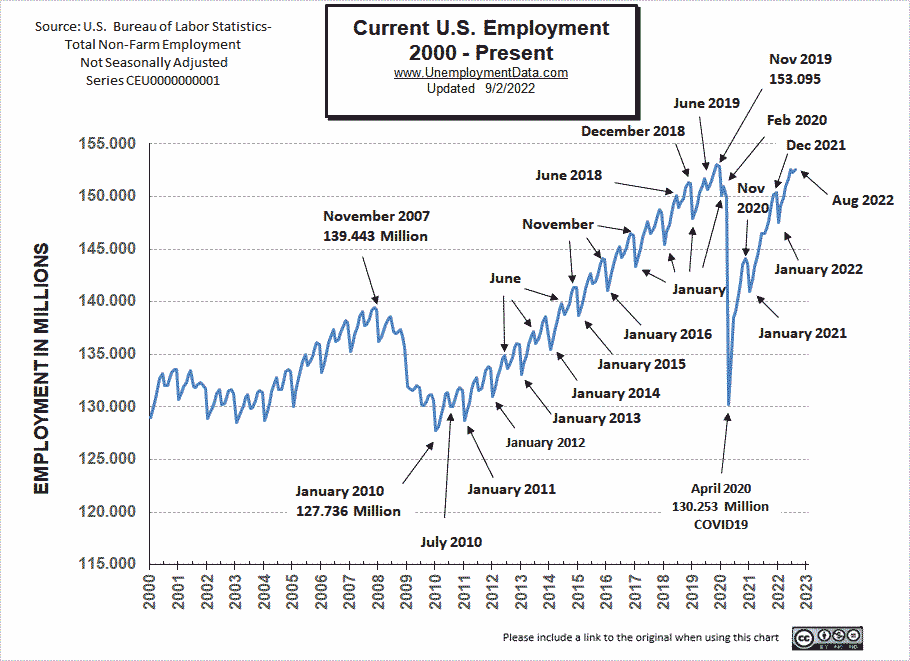
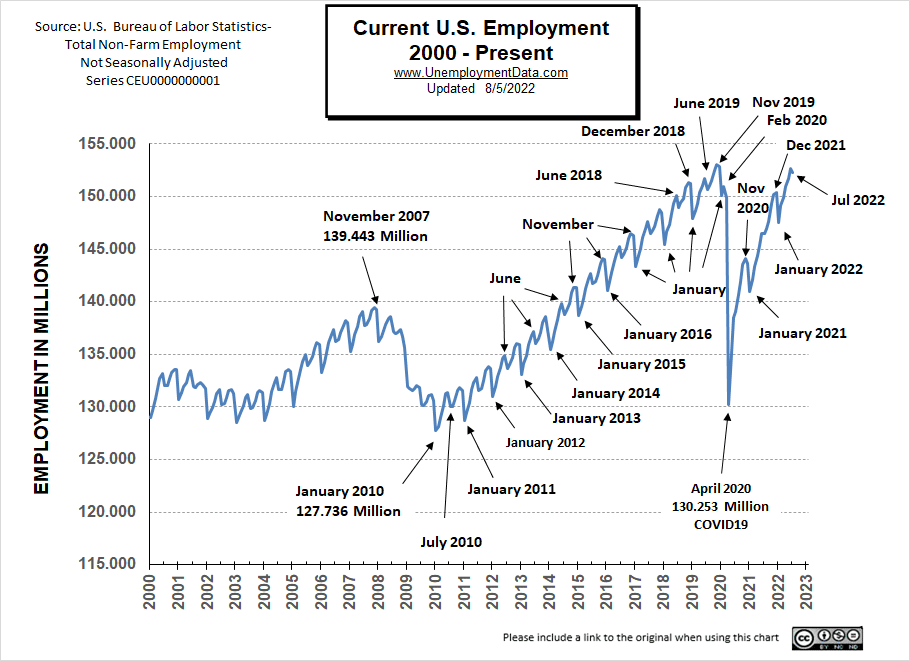
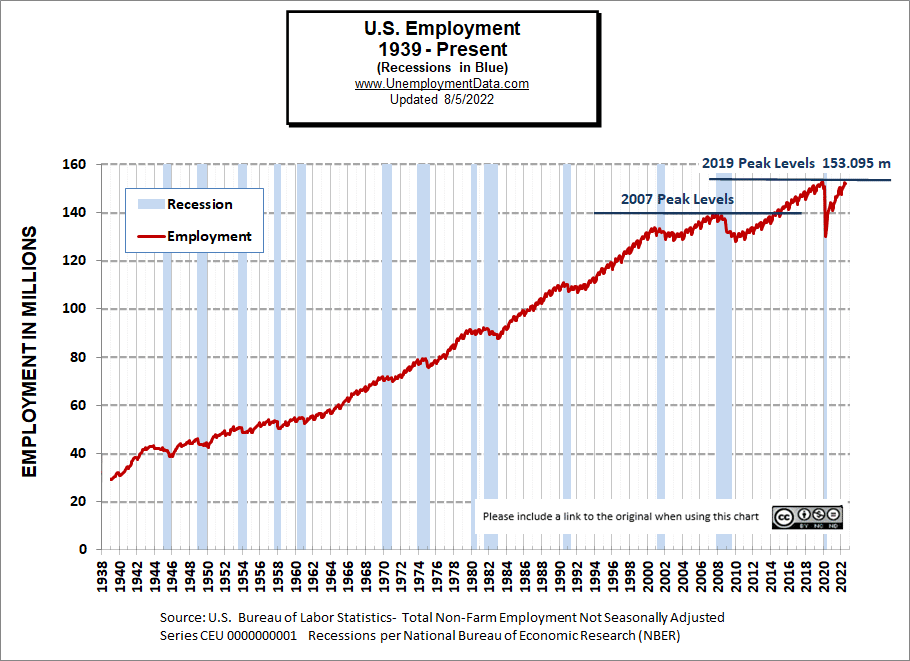
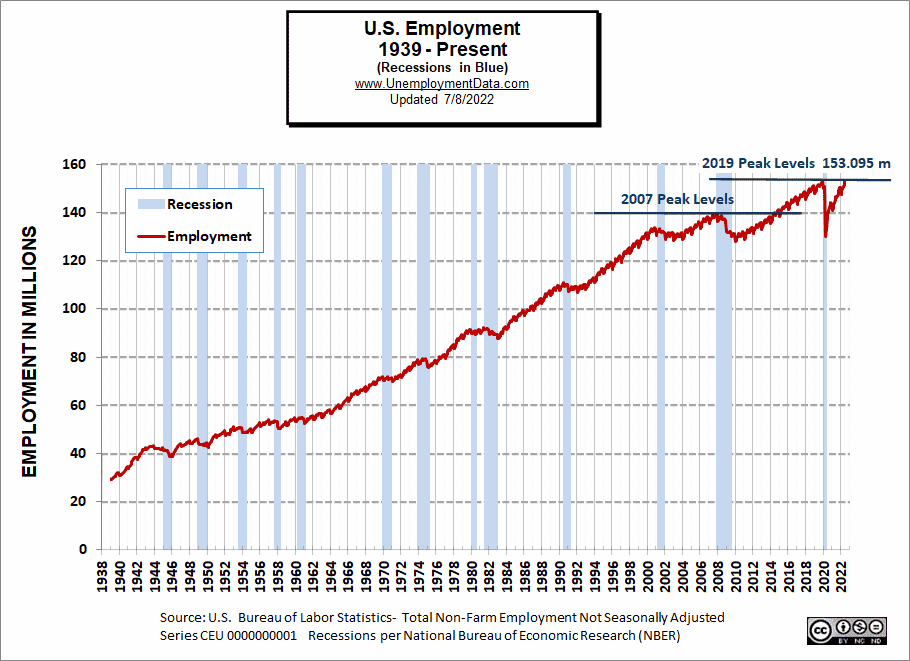
- Unadjusted Employment fell from 155.015 million to 154.771
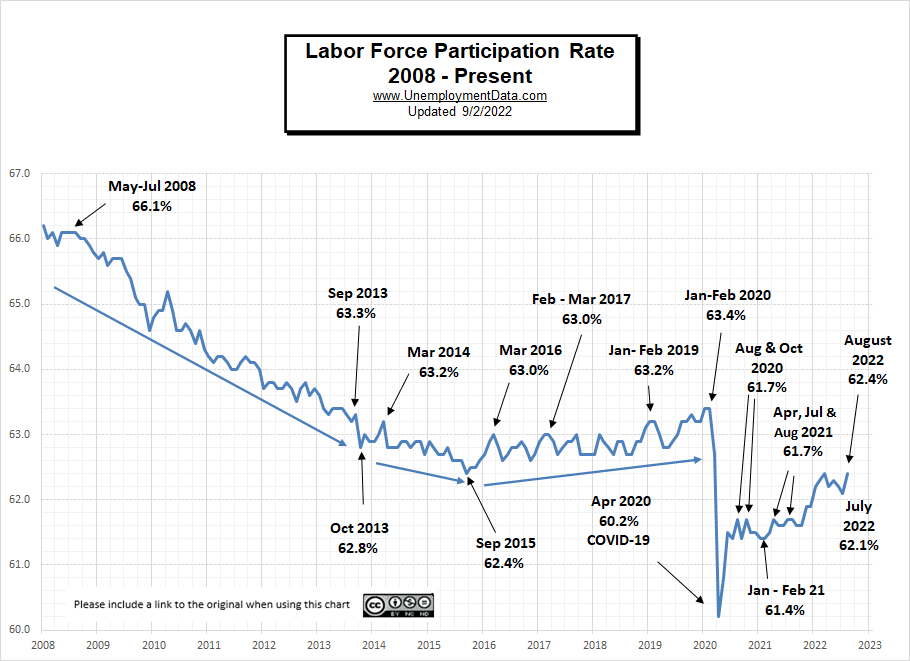
- Labor Force Participation rose from 62.2% to 62.3%
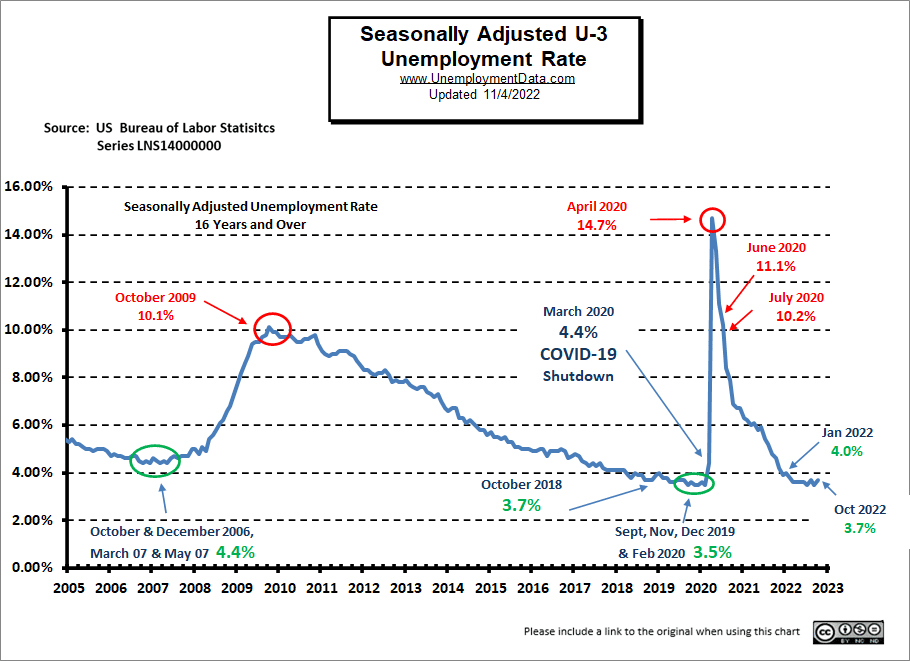
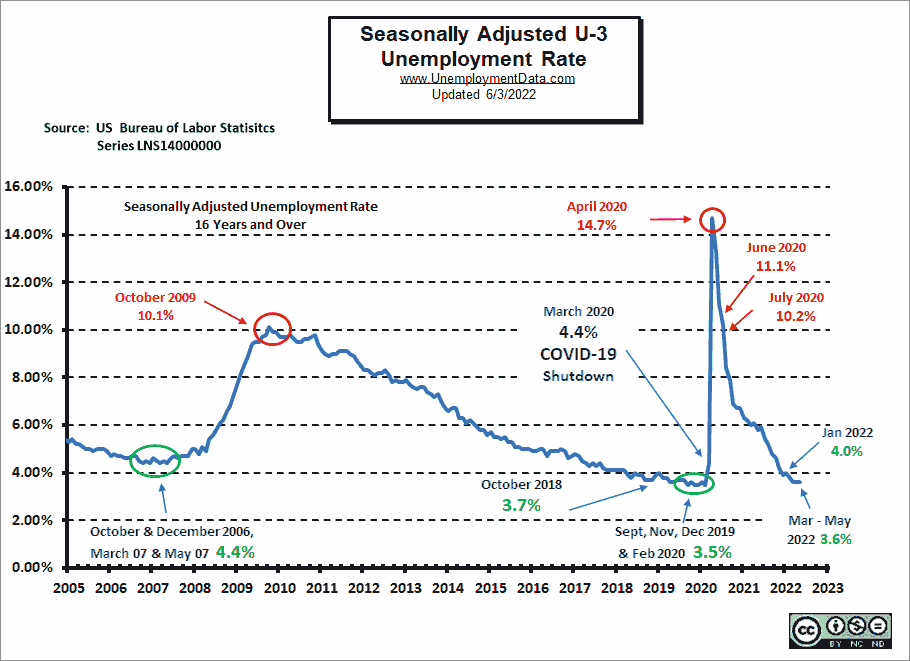
- Adjusted U-3 fell from 3.6% to 3.5%
- Unadjusted U-3 fell from 3.4% to 3.3%
- Unadjusted U-6 was unchanged at 6.4%
The U.S. Bureau of Labor Statistics (BLS) released its employment / unemployment report for December on January 6th2023.
According to the Commissioner of the U.S. Bureau of Labor Statistics:
“Total nonfarm payroll employment increased by 223,000 in December, and the unemployment rate edged down to 3.5 percent, the U.S. Bureau of Labor Statistics reported today. Notable job gains occurred in leisure and hospitality, health care, construction, and social assistance… The unemployment rate edged down to 3.5 percent in December and has remained in a narrow range of 3.5 percent to 3.7 percent since March.”
In addition, the BLS posted the following note:
“Seasonally adjusted household survey data have been revised using updated seasonal adjustment factors…”
They will also be making further annual adjustments next month.
You can read the full BLS report here.
As usual, they are talking about “Seasonally Adjusted Jobs” rather than looking at the unadjusted results.
Looking at the unadjusted Current Employment Statistics program (formerly called the Establishment Survey report), we see…
Originally, the BLS reported employment of 154.990 million for November, which they adjusted up to 155.015 million. So, 25,000 additional jobs appeared for November.
The current estimate for December is 154.771 million, which is down 219,000 from the original November number and down 244,000 from the revised numbers.
According to the BLS’ unadjusted Current Population Survey (CPS), the labor force was 164.224 million in December. Of those, 158.872 million were employed, and 5.352 million were unemployed. November CPS employment was 158.749 million, so according to the Current Population Survey, employment increased.
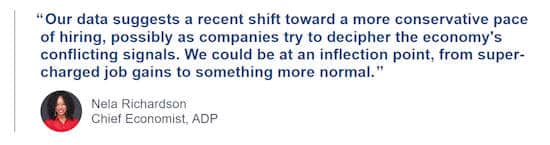
So one set of numbers shows an increase in employment while the other shows a decrease. ADP says mostly up.
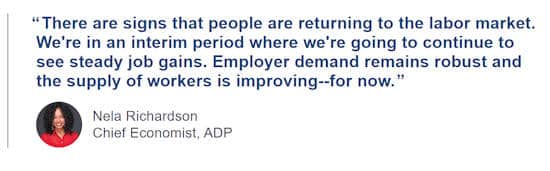
ADP® National Employment Report
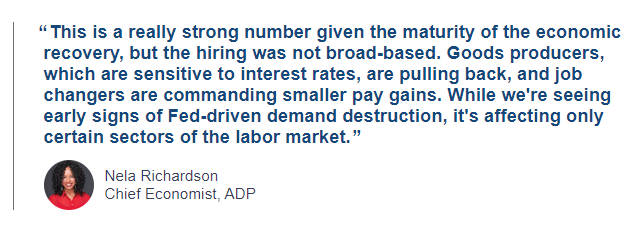
According to ADP, In collaboration with Stanford Digital Economy Lab, employment was up from November to December.
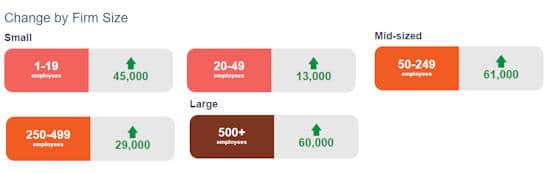
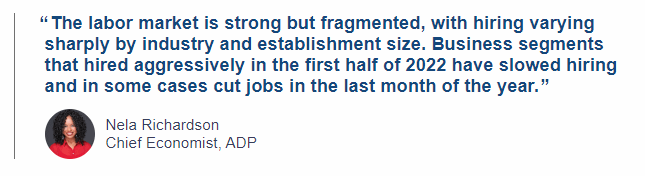
Private employers added 235,000 jobs in December
- Job resurgence was seen in the last two months of 2022, led by consumer-facing service industries. Hiring was strong across small and medium establishments, while large establishments saw a drop in employment of 151,000 jobs.
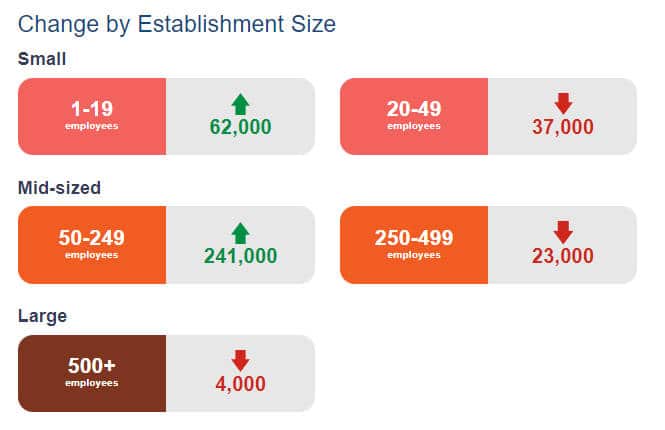
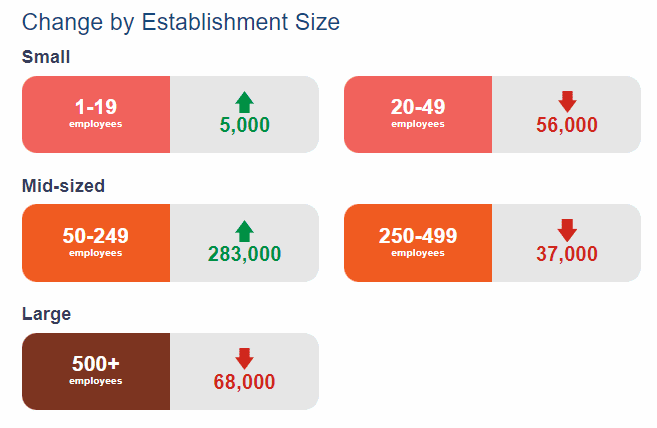
 ADP also lists increases by “firm size”.
As we can see, small and medium-sized companies are still hiring, while large corporations are downsizing.

December 2022 Employment by Sector
The employment “bubble chart” is a quick and easy way to see how each sector performs on a seasonally adjusted basis. The Bubble’s Size tells us the total Employment for that industry (i.e., larger bubbles mean more people are employed in that sector).
The bubble’s location on the chart tells us that there has been a change in Employment Levels over the most recent month… A bubble further to the right indicates larger job growth. A bubble’s vertical location on the chart shows the average industry salary.
In November, Leisure and Hospitality, Education, Construction, Manufacturing, and “Other” were the big gainers, while Retail was the big loser.
Average Weekly Wages Fell in December
$1,125.73 in December, $1,129.01 in November, $1,124.01 in October , $1,119.87 in September, $1116.42 in August, $1,116.54 in July, $1,106.76, in June, $1,105.47 in May and $1,102.01 in April, and $1,086.46 in December 2021. [Read more…] about December 2022 Employment Report