The U.S. Bureau of Labor Statistics (BLS) released its employment / unemployment report for November on December 6th, 2024.
Employment / Unemployment
![]()
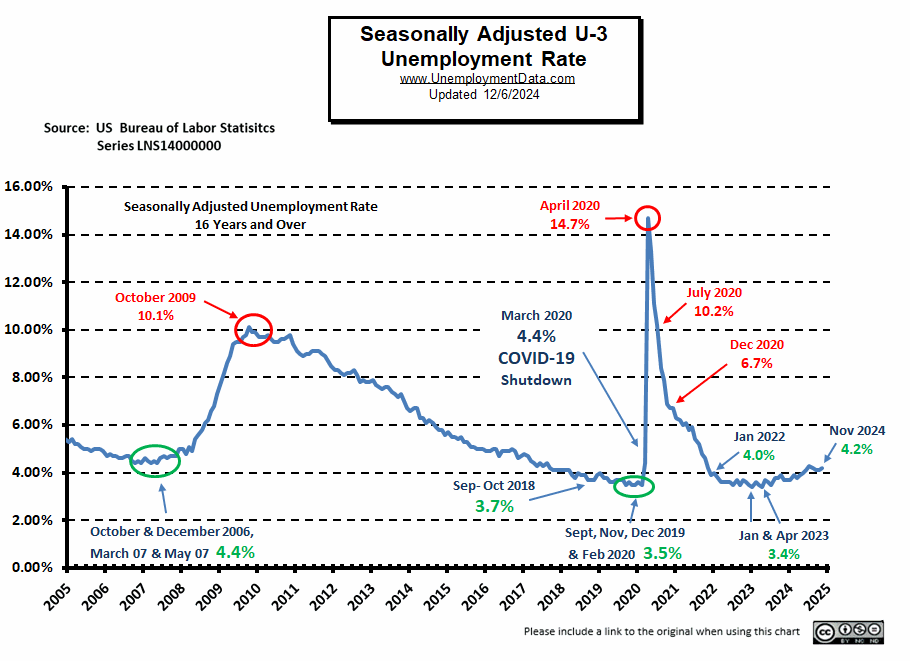
- Seasonally Adjusted U3- 4.2% Up from October
- Unadjusted U3- 4.0% Up from October
- Unadjusted U6- 7.4% Up from October
- Labor Force Participation Rate 62.5% down from October
- Employment 160.560 million up from 160.035 million
- Next data release January 3rd, 2025
Summary:
Total Employed increased in November, but Unemployment increased. Labor Force Participation fell by 0.1%. In the perversity of markets, overall, the report was sufficiently bad to give the market hope for another rate cut by the FED.
According to the Commissioner of the U.S. Bureau of Labor Statistics:
“Total nonfarm payroll employment rose by 227,000 in November, and the unemployment rate changed little at 4.2 percent, the U.S. Bureau of Labor Statistics reported today. Employment trended up in health care, leisure and hospitality, government, and social assistance. Retail trade lost jobs.
Both the unemployment rate, at 4.2 percent, and the number of unemployed people, at 7.1 million, changed little in November. These measures are higher than a year earlier, when the jobless rate was 3.7 percent, and the number of unemployed people was 6.3 million.”
As usual, they are talking about “Seasonally Adjusted Jobs”.
Looking at the Unadjusted Establishment Survey report we see…
Originally the BLS reported employment of 160.007 million for October
which they adjusted slightly to 160.035 million.
They are currently reporting 160.560 million jobs for November which is actually an increase of 525,000 jobs based on the new numbers or 553,000 based on the original numbers. The LFPR was down from 62.6% to 62.5%.
Bad News is Good News?
Once again, the stock market took the report as bad enough to generate hope that the FED will cut rates again soon but not so bad to wreck the economy.
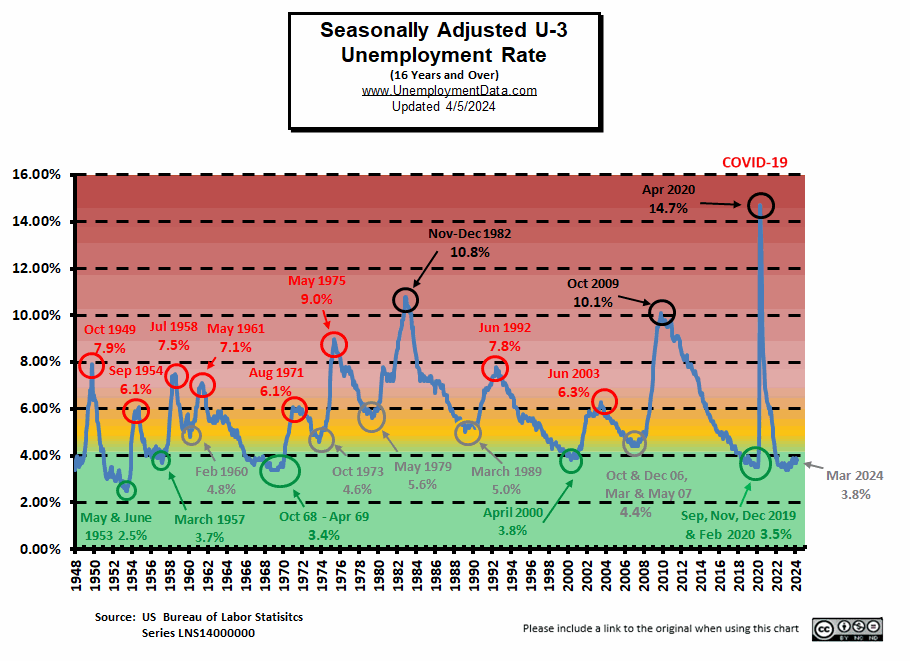
Current Unemployment Rate Chart
As we can see from the chart below, although still low, over the last year unemployment has risen 0.8% from the lows of 2023. At 4.2% unemployment is no longer in the “Excellent” range but still in the “Very Good” range.