• About WordPress
    • WordPress.org
    • Documentation
    • Learn WordPress
    • Support
    • Feedback
  • Log In
  • Skip to primary navigation
  • Skip to main content
  • Skip to primary sidebar
  • Home
  • Contact us
  • Related Sites
    • InflationData.com
    • Financial Trend Forecaster
    • Your Family Finances
    • Elliott Wave University
    • Optio Money
  • About
    • Terms of Use
    • Disclaimer & Disclosure
    • Privacy Statement
  • Sitemap
    • 2009-2010 Posts
    • 2011 Posts

UnemploymentData.com

Your Source for Employment and Unemployment Data

Unemployment
  • Charts
    • Current Unemployment Rate Chart
    • Current Employment Rate (Chart and Data)
    • Current Employment vs Unemployment Chart
    • Historical Employment Data
    • Employment Population Ratio
    • Misery Index
  • Unemployment
    • Historical Unemployment Rate Tables
    • What Is U-6 Unemployment?
    • Unadjusted vs. Seasonally Adjusted U-3 Unemployment Rate
    • BLS vs. Gallup Unemployment Numbers
    • Current U-6 Unemployment Rate
    • What is the Labor Force Participation Rate?
    • What is the Real Unemployment Rate?
  • Employment
    • Current Employment Rate (Chart and Data)
    • Historical Employment Data
    • Contacting a Live Person at the State Employment Commission
      • How to Talk to a Live Person at the Virginia Unemployment Commission
      • Florida’s FLUID Unemployment Program
    • Benefits
      • Insurance
      • Retirement
    • Careers
    • Employment Costs
    • Experience
    • Government
    • Job Hunting
      • Interview
      • Resume
  • Find Articles
  • Education
    • Skills
  • General
    • Small Business
      • Outsourcing
    • Success
You are here: Home / Archives for Tim McMahon

Tim McMahon, Editor of UnemploymentData.com

My grandfather lived through the Hyperinflation in Weimar, Germany--to say he was an original “gold bug” would be an understatement. I began reading his “hard money” newsletters at the age of 16 and the dividends from gold stocks helped put me through college. I began publishing the Financial Trend Forecaster paper newsletter in 1995 upon the death of James Moore editor of Your Window into the Future and the creator of the Moore Inflation Predictor©. FTF specializes in trends in the stock market, gold, inflation and bonds. In January of 2003, I began publishing InflationData.com to specialize in all forms of information about the nature of Inflation. In 2009, we added Elliott Wave University to help teach you the principles of Elliott Wave analysis. In January 2013, we began publishing OptioMoney. Connect with Tim on Google+.

Unemployment and Employment Charts

January 1, 2019 by Tim McMahon

  • Unemployment Rate Chart – The seasonally adjusted unemployment rate from 1948 to the present is one of the most watched statistics. Where is it now and should you trust it?
  • Current U-6 Unemployment Rate– Many people consider the U-6 the “real” unemployment rate. See where it is now.
  • Current Employment Data – How many jobs are there actually? This chart shows Employment since Jan 2000 and what the current trend is.
  • Historical Employment Data Chart– How Many People Are Actually Employed? This chart shows the actual employment rate without all the mumbo-jumbo. It gives a clear picture of  the employment level in the United States from 1939 to the Present. When employment is rising the economy is growing. When the employment rate levels off or declines times are not so good. Take a look and see how employment rates correspond to recessions over time.
  • Current Employment vs Unemployment Chart When looking at employment vs. unemployment you would think that they are two sides of the same coin but the U.S. Bureau of Labor Statistics (BLS) actually uses two entirely different surveys to calculate them. Looking at both on the same chart we can see some strange anomalies.
  • Misery Index– Created by economist Arthur Okun to help gauge the level of misery the average person is suffering. It is a combination of the inflation rate and the unemployment rate.
  • Unadjusted vs. Seasonally Adjusted Unemployment Rate– Often it appears that the Seasonally Adjusted numbers are going one way, while the unadjusted numbers are going in the opposite direction. Here is how it looks in chart form.
  • Seasonally Adjusted Unemployment Rate in Table form– If you want to see the actual numbers.
  • Is the Government Fudging Unemployment Numbers? Now there is an alternative measurement. We can also see a discrepancy in the Government’s own numbers by looking at the Employment vs. UnEmployment rate.
  • U-6 is the broadest measure of unemployment and includes all classes of Unemployed plus those ”marginally attached” and/or part-time for economic reasons. See What is the U-6 Unemployment Rate? for more details of all the “U” classifications.
  • What is the “Real” Unemployment Rate? Many economists believe that the popularly quoted Unemployment Rate understates the real unemployment rate because it fails to include workers who would like to work but have given up looking because they don’t think there are any jobs available for them.
  • What is the Labor Force Participation Rate? You might think that the Labor Force Participation Rate [LFPR] would mean the percentage of the population that is working but it doesn’t mean that at all. According to the Bureau of Labor Statistics the “Labor Force” is made up of both employed and unemployed people.  Unemployed people are defined as those who are actively looking for work. Once you stop looking (i.e discouraged workers) you are no longer in the official labor force.

 

Filed Under: Featured, Unemployment Tagged With: employment rate, employment rate chart, unemployment, unemployment rate, unemployment rate chart

European Unemployment Rates Q3- 2018

December 11, 2018 by Tim McMahon

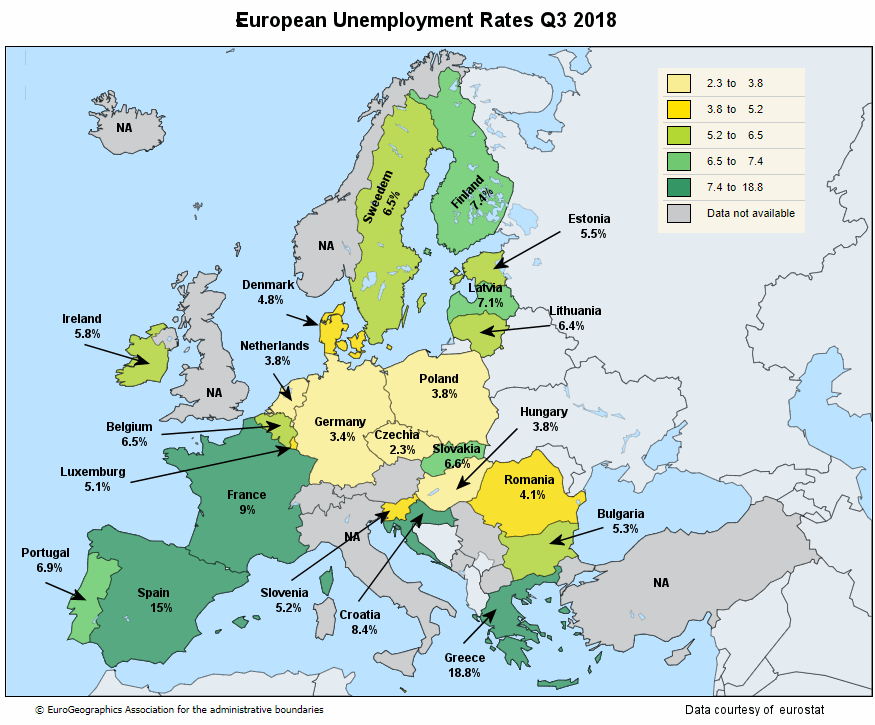
According to the most recent Eurostat numbers only four European countries made it into the lowest bracket of unemployment i.e. 2.3%-3.8%. They were Czechia, Germany, Hungary and Poland.  However, if the range was 1/10% lower (i.e. 3.7%)  there would only be two members since Hungary and Poland were both at 3.8%. Also several countries do not report to Eurostat on a timely manner and so they are not included. Typically Italy and Turkey have Unemployment rates near the highest end of the scale.

Europe Unemployment Eurostat Q3-2018

The highest reported Unemployment rate is [Read more…] about European Unemployment Rates Q3- 2018

Filed Under: Europe Tagged With: Europe, unemployment

Lost Wages? How to Get the Compensation You Deserve

December 9, 2018 by Tim McMahon

Missing time at work could put you at a serious disadvantage when it comes to being able to pay your bills. If you’re missing work due to an injury or an accident, you may be entitled to receive some compensation. Here are some of the ways that you can go about getting the compensation that you deserve.

There are a variety of different types of accident and unfortunately each one may require a different approach to getting compensation. For instance an injury sustained on the job will require that you proceed with a “worker’s compensation” claim. In this case it is important that you give both your employer and the Doctor that this is a work related injury.

If it is another type of injury such as an auto accident then you must take slightly different steps. Of course you still need to notify your employer that you are injured and can’t work but you must document different things. [Read more…] about Lost Wages? How to Get the Compensation You Deserve

Filed Under: Insurance Tagged With: insurance, Lost Wages, worker's comp, Worker's Compensation

November Employment Gains Less Than Projected But…

December 8, 2018 by Tim McMahon

Seasonally Adjusted U-3 UnemploymentThe U.S. Bureau of Labor Statistics (BLS) released their monthly unemployment survey results for November on December 7th. Unadjusted U-3 and “Seasonally Adjusted” Unemployment U-3 were unchanged. Adjusted U-3 was 3.7% for the third month in a row while unadjusted was 3.5% for the second month. This is the lowest level since December 1969 when Adjusted U-3 was 3.5%. The lowest level reached in the 1968-1969 timeframe was 3.4% where it hovered from September 1968 through May 1969. The only other time that unemployment was this low since they began tracking unemployment in 1948 was briefly in 1948 and again in 1951-53.

Remember that the world population had just been drastically reduced through WWII (ending in 1945) so there were much fewer working age men available. So it is unlikely that we will see unemployment at 1953 levels again.


Key November Employment and Unemployment Numbers

  • Adjusted U-3 Unemployment-   3.7% unchanged since September down from 3.9% in August, This is the lowest Seasonally Adjusted Unemployment rate since 1969.
  • Unadjusted U-3 Unemployment-  3.5% unchanged from October down from 3.6% in September and 3.9% in August and 4.1% in July and 4.2% in June.
  • Unadjusted U-6 Unemployment-  7.2% up from 7.0% in October and 7.1% in September still below the 7.4% in August and 7.9% in July, 8.1% in June.
  • Employment 151.232 million up from 150.757 million in October. (475,000 more jobs)
  • November Labor Force Participation Rate 62.9% unchanged from October but up from 62.7% in September. (Higher is Better)

See Current Unemployment Chart for more info.


Previous Record Low Unemployment (Seasonally Adjusted U-3)

Jan Feb Mar Apr May Jun Jul Aug Sep Oct Nov Dec
1950 6.5% 6.4% 6.3% 5.8% 5.5% 5.4% 5.0% 4.5% 4.4% 4.2% 4.2% 4.3%
1951 3.7% 3.4% 3.4% 3.1% 3.0% 3.2% 3.1% 3.1% 3.3% 3.5% 3.5% 3.1%
1952 3.2% 3.1% 2.9% 2.9% 3.0% 3.0% 3.2% 3.4% 3.1% 3.0% 2.8% 2.7%
1953 2.9% 2.6% 2.6% 2.7% 2.5% 2.5% 2.6% 2.7% 2.9% 3.1% 3.5% 4.5%
1954 4.9% 5.2% 5.7% 5.9% 5.9% 5.6% 5.8% 6.0% 6.1% 5.7% 5.3% 5.0%
… … … … … … … … … … … … …
1965 4.9% 5.1% 4.7% 4.8% 4.6% 4.6% 4.4% 4.4% 4.3% 4.2% 4.1% 4.0%
1966 4.0% 3.8% 3.8% 3.8% 3.9% 3.8% 3.8% 3.8% 3.7% 3.7% 3.6% 3.8%
1967 3.9% 3.8% 3.8% 3.8% 3.8% 3.9% 3.8% 3.8% 3.8% 4.0% 3.9% 3.8%
1968 3.7% 3.8% 3.7% 3.5% 3.5% 3.7% 3.7% 3.5% 3.4% 3.4% 3.4% 3.4%
1969 3.4% 3.4% 3.4% 3.4% 3.4% 3.5% 3.5% 3.5% 3.7% 3.7% 3.5% 3.5%
1970 3.9% 4.2% 4.4% 4.6% 4.8% 4.9% 5.0% 5.1% 5.4% 5.5% 5.9% 6.1%


Employment

According to the Bureau of Labor Statistics Commissioner’s report:

“Total nonfarm payroll employment increased by 155,000 in November, and the unemployment rate remained unchanged at 3.7 percent.
Job gains occurred in health care, in manufacturing, and in transportation and warehousing.”

November Employment Gains Less Than Projected But…

The stock market is fretting because projections called for an increase of 195,000 (seasonally adjusted jobs) and we “only” got 155,000 but Employment is at a new all time record 151.232 million up from 150.757 million in October. The previous high was set in June 2018 at 150.040 million. So, although the “Seasonally Adjusted” jobs increase was “only” 155,000 there were 475,000 more actual jobs.

Incidentally, last month adjusted jobs exceeded projections by almost exactly the same amount as they fell short this month. So one could argue that the two month increase is exactly on projection.

Employment by Sector

The employment “bubble chart” gives us a good representation of how each sector of the economy is doing (employment wise). As we can see from the chart below  [Read more…] about November Employment Gains Less Than Projected But…

Filed Under: BLS Tagged With: Bubbles, employment, November, Seasonally Adjusted, unemployment

Valuable Career Benefits of Studying Abroad

November 28, 2018 by Tim McMahon

Moving away from home is something all young people dream of, but moving to another country can be scarier than you expect. Moreover, if you move abroad in order to pursue an academic career, you could be facing lots of new challenges that might frighten you and put you off studying abroad. However, if you approach this decision in another way and realize how amazing the time you spend in another country could be for your future employment, you’ll see that it’s worth the struggle and be ready to do it. So, if you too are contemplating such a move, here’s why studying abroad could turn out to be the best decision you’ve ever made.

Impress Potential Employers

A rich résumé and the ability to speak your mind are just some of the things all employers are looking for today, and if you have these things under your belt, no employer is going to resist you. Studying abroad is going to enrich your résumé and help you become more competitive, which is extremely important in this day and age when lots of people are trying to find the job of their dreams.

There are three ways to point out this experience on your résumé – under “education,” “experience” and “skills” – and it’s practically the same which idea you’ll choose. If you opt for the first one, be sure to include as many details as possible – where you studied, which classes you took, which academic degree you earned, etc. If you insist on experience, don’t forget to accentuate the amount of time you’ve spend abroad, and if you focus on your new skills, list as many of them as you can.

[Read more…] about Valuable Career Benefits of Studying Abroad

Filed Under: Education Tagged With: Abroad, career, Study

Getting Your Dream Job: Nailing the Interview

November 17, 2018 by Tim McMahon

Acing your interview can help you land the job of your dreams. If you’re scheduled for an interview, you’ll want to make all the necessary preparations and gain the knowledge that will increase your chances of getting hired. These tips can help you nail your interview and secure your dream job.

Do Your Homework

In addition to knowing everything that’s involved in the position for which you’re applying, learning some other important details can help you establish a better rapport with the interviewer. You’ll likely impress the hiring manager if you know about the company’s history and vision. You can also talk about certain improvements the company has made that you’re aware of and how these improvements have helped with customer approval ratings. These speaking points let your potential employer know that you really are interested in joining the team.

Building Rapport with the Interviewer

Tony Robbins says “Rapport is that spark that happens between people” unfortunately most people have difficulty developing rapport with anyone who is different than themselves. The key to success is to be able to develop rapport with other people. Rapport is created by a feeling of “commonality” i.e. having something in common. And interestingly according to Robbins “Style is more important than substance initially” so in those first few seconds of an interview you need to really work on commonality in your actions. You can have lots of substance and no style and no one will ever get to “see your stuff” because you haven’t developed that rapport. Watch this video to see how to build rapport.

Tony Robbins Building Rapport

Stay Calm

Job interviews can be stressful situations, but it’s important to try to remain calm while being questioned. Doing some practice interviews beforehand with friends, family or mentors can help you prepare yourself for the big day. It might even be a good idea to do some yoga or meditation the day of your interview to put your body and mind into a more relaxed and focused state. The Balance Careers also notes the importance of body language and how you should sit with your back straight and your arms uncrossed to avoid looking nervous, defensive or disengaged during the interview itself.

Believe in Yourself

Nerves and a little anxiety about the interview is common and natural. Your interviewers have your future in their hands. One decision can mean a new start and many opportunities or disappointment and maybe even some discouragement when looking to the future. However, there are little things you can do to boost your confidence and lessen your nervousness. Shortly before your meeting, find a quiet corner and hold a power pose for a few minutes. Standing in a confident way can help you feel the confidence of the pose and believe in yourself a little more.

According to Dr. Cuddy in the video above two of the best predictors of success in an interview are genuine enthusiasm and lack of awkwardness.

Be Yourself

If you pretend to be someone you’re not during your interview or misrepresent yourself on your resume, the hiring manager may detect your insincerity and be less inclined to offer you the job. Obviously, you’ll want to remain professional, but you shouldn’t be afraid to show some of the best sides of your personality to make a great impression. Sharing some personal stories that relate to the job can definitely work to your advantage.

It’s also important to be honest throughout your interview and on your resume, especially when it comes to your work experience and certifications. Unlike Frank Abignale, Jr. who was portrayed in the movie “Catch Me If You Can” it is much more difficult to pretend to be a Doctor (or other Medical Professional) today. Many industries have access to nationwide databases, like medproid.com for the medical industry, to double check your qualifications. For example, if you apply for a job at a hospital as a nurse and lie about your certification and licensing, the hospital can access a real time HCP license validation service and discover that you’re not who you say you are. In this case, you won’t be given the job and may even face consequences because of it. 10 People Who Pretended To Be Doctors

The job interview is your gateway to the career of your dreams, so you’ll want to do everything possible to achieve success. By doing well on your interview, you’ll likely find yourself starting your first day of work in no time.

You might also like:

  • Dress to Impress: 4 Tips to Leaving a Good Impression in a Job Interview
  • Preparing for a Healthcare Job Interview
  • 5 Things Employers Wish You Knew Before Applying For a Job
  • The 7 “P’s” Job Interview Tips
  • Job Hunting Today: Nailing the Video Interview
  • Dressing for Success at Job Interviews for Men

Filed Under: Interview Tagged With: Believe, interview, jobs, Power Poses

October Employment Hits New Record High

November 3, 2018 by Tim McMahon

Seasonally Adjusted U-3 UnemploymentThe U.S. Bureau of Labor Statistics (BLS) released their monthly unemployment survey results for October on November 2nd. Unadjusted U-3 and U-6 Unemployment is down again and “Seasonally Adjusted” Unemployment U-3 was 3.7% for the second month in a row. This is the lowest level since December 1969 when it was 3.5%. The lowest level reached in the 1968-1969 timeframe was 3.4% where it hovered from September 1968 through May 1969. The only other time that unemployment was this low since they began tracking unemployment in 1948 was briefly in 1948 and again in 1951-53.

Employment is at an all time record 150.753 million the previous high was set in June 2018. Last month employment was 149.738 million so the actual increase in jobs was over 1 million, although the “Seasonally Adjusted” jobs increase was “only” 250,000. Even that was significantly higher than the projected 208,000.

Previous Record Low Unemployment

Jan Feb Mar Apr May Jun Jul Aug Sep Oct Nov Dec
1965 4.9% 5.1% 4.7% 4.8% 4.6% 4.6% 4.4% 4.4% 4.3% 4.2% 4.1% 4.0%
1966 4.0% 3.8% 3.8% 3.8% 3.9% 3.8% 3.8% 3.8% 3.7% 3.7% 3.6% 3.8%
1967 3.9% 3.8% 3.8% 3.8% 3.8% 3.9% 3.8% 3.8% 3.8% 4.0% 3.9% 3.8%
1968 3.7% 3.8% 3.7% 3.5% 3.5% 3.7% 3.7% 3.5% 3.4% 3.4% 3.4% 3.4%
1969 3.4% 3.4% 3.4% 3.4% 3.4% 3.5% 3.5% 3.5% 3.7% 3.7% 3.5% 3.5%
1970 3.9% 4.2% 4.4% 4.6% 4.8% 4.9% 5.0% 5.1% 5.4% 5.5% 5.9% 6.1%

Key October Employment and Unemployment Numbers

  • Adjusted U-3 Unemployment-   3.7% unchanged from September down from 3.9% in August.
  • Unadjusted U-3 Unemployment-  3.5% down from 3.6% in September and 3.9% in August and 4.1% in July and 4.2% in June.
  • Unadjusted U-6 Unemployment-  7.0% down from 7.1% in September and 7.4% in August and 7.9% in July, 8.1% in June.
  • Employment 150.753 million up from 149.741 million in September. (Yes over a Million more jobs!)
  • October Labor Force Participation Rate 62.9% up from 62.7% in September. (Higher is Better)

See Current Unemployment Chart for more info.

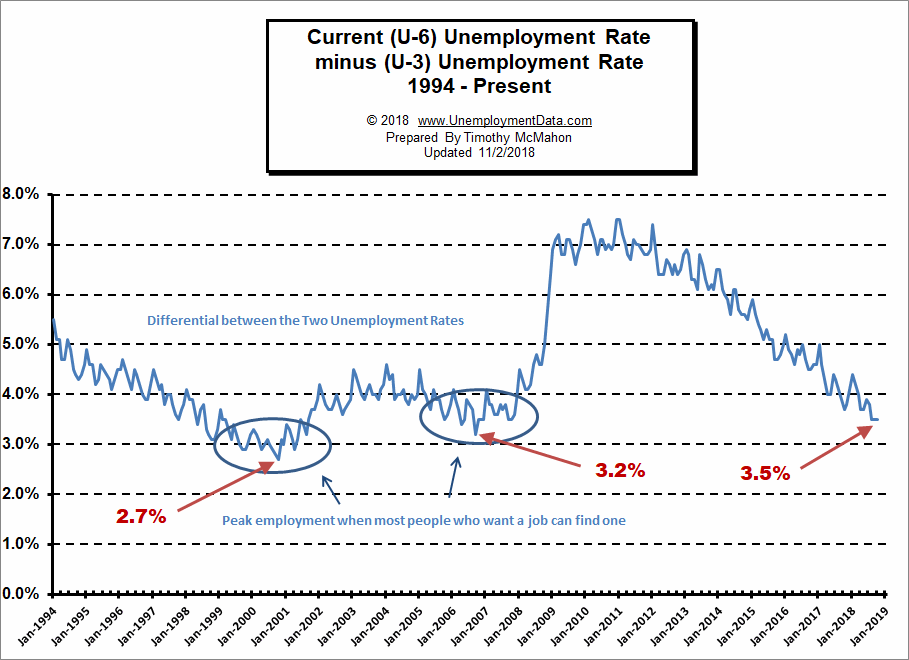
The Differential between U3 and U6 Remains Near September 2006 Lows

Last month the differential between the unadjusted U3 and U6 (reached by subtracting U3 from U6) was at 3.5% and remains there for the 3rd month in a row.

U6 minus U3 Unemployment 11-2-18


See Current U-6 Unemployment Rate for more info.

Employment by Sector

The employment “bubble chart” gives us a good representation of how each sector of the economy is doing (employment wise). As we can see from the chart below  [Read more…] about October Employment Hits New Record High

Filed Under: BLS, Employment Tagged With: 3.7%, BLS, Dec. 1969, lowest level, U-3, U-6, unemployment

Arkansas, California, Idaho, South Carolina, Texas and Washington Set New Unemployment Lows in September

October 20, 2018 by Tim McMahon

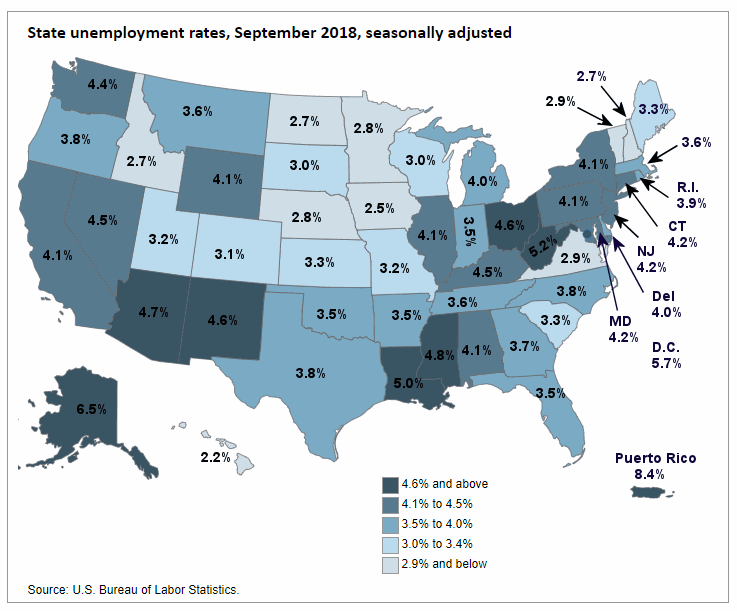
The U.S. Bureau of Labor Statistics reported on Unemployment rates by state on Friday October 19th. Seasonally adjusted unemployment rates for September fell over the previous month in 9 states, were higher in 4 states, and stable in 37 states and the District of Columbia.

Nonfarm payroll employment increased in 1 state, decreased in 9 states, and was stable in 37 states and D.C.

In the following map we can see the states with the lowest unemployment are light colored while the higher unemployment states are darker colored.


Unemployment by State Sept 2018

Unemployment

Arkansas, California, Idaho, South Carolina, Texas and Washington Set New Series Lows

Hawaii had the lowest seasonally adjusted unemployment rate in September, at 2.2%. Arkansas (3.5%), California (4.1%), Idaho (2.7%), South Carolina (3.3%), Texas (3.8%), and Washington (4.4%)  set a new series low since tracking began in 1976. At 6.5% Alaska had the highest jobless rate, not counting Puerto Rico’s 8.4% which is down 2.2% from year ago levels. In total, 13 states had unemployment rates lower than the U.S. figure of 3.7 percent, 12 states plus the District of Columbia and Puerto Rico had higher rates, and 25 states had [Read more…] about Arkansas, California, Idaho, South Carolina, Texas and Washington Set New Unemployment Lows in September

Filed Under: BLS Tagged With: Alaska, Arkansas, California, Florida, Idaho, Oklahoma, South Carolina, State, Texas, unemployment, Washington

Unemployment Reaches Lowest Point Since 1969

October 6, 2018 by Tim McMahon

Seasonally Adjusted U-3 Unemployment RateAccording to the the U.S. Bureau of Labor Statistics (BLS) monthly unemployment survey results for the month of September 2018 the current “Seasonally Adjusted” Unemployment Rate for September is 3.7% the lowest level since December 1969 when it was 3.5%. Unfortunately, by December 1970 unemployment was up to 6.1%.

The lowest level reached in the 1968-1969 timeframe was 3.4% where it hovered from September 1968 through May 1969. The only other time that unemployment was this low since they began tracking unemployment in 1948 was briefly in 1948 and again in 1951-53.


Jan Feb Mar Apr May Jun Jul Aug Sep Oct Nov Dec
1965 4.9% 5.1% 4.7% 4.8% 4.6% 4.6% 4.4% 4.4% 4.3% 4.2% 4.1% 4.0%
1966 4.0% 3.8% 3.8% 3.8% 3.9% 3.8% 3.8% 3.8% 3.7% 3.7% 3.6% 3.8%
1967 3.9% 3.8% 3.8% 3.8% 3.8% 3.9% 3.8% 3.8% 3.8% 4.0% 3.9% 3.8%
1968 3.7% 3.8% 3.7% 3.5% 3.5% 3.7% 3.7% 3.5% 3.4% 3.4% 3.4% 3.4%
1969 3.4% 3.4% 3.4% 3.4% 3.4% 3.5% 3.5% 3.5% 3.7% 3.7% 3.5% 3.5%
1970 3.9% 4.2% 4.4% 4.6% 4.8% 4.9% 5.0% 5.1% 5.4% 5.5% 5.9% 6.1%

Key September Employment and Unemployment Numbers

  • Adjusted U-3 Unemployment:  3.7% down from 3.9% in August, This is the lowest Seasonally Adjusted Unemployment rate since 1969.
  • Unadjusted U-3 Unemployment:  3.6% down from 3.9% in August and 4.1% in July and 4.2% in June.
  • Unadjusted U-6 Unemployment:   7.1% down from 7.4% in August and 7.9% in July, 8.1% in June, and below record lows of 7.3% in May, and 7.4% in April.
  • Employment: 149.741 million up from 149.226 million originally reported for August.
  • September Labor Force Participation Rate: 62.7% unchanged from August but down from July 62.9%.

See Current Unemployment Chart for more info.

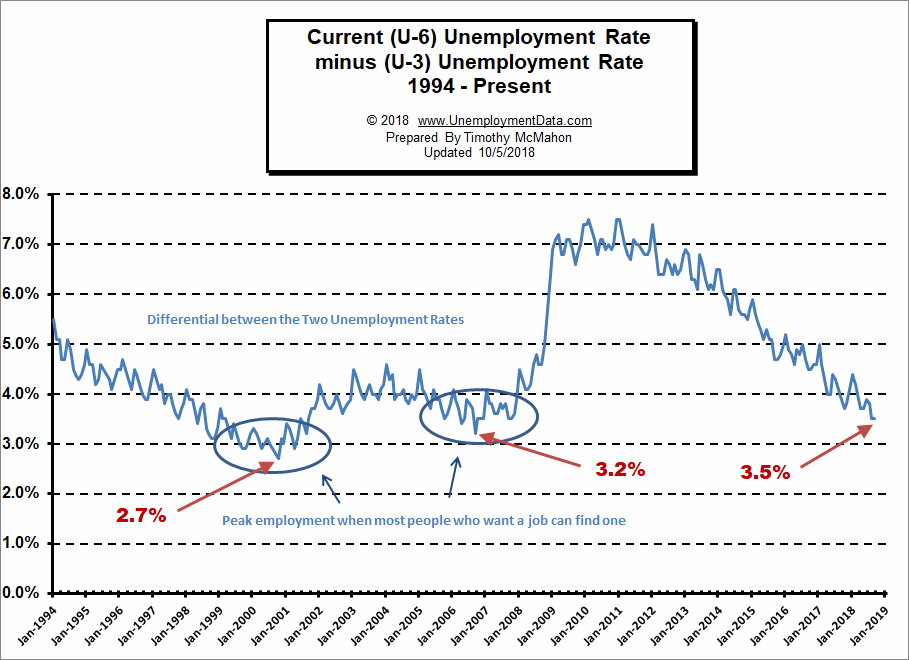
Full Employment is Near – Differential between U3 and U6 nearing September 2006 Lows

Last month we incorrectly reported that the differential between the unadjusted U3 and U6 (reached by subtracting U3 from U6) was at 3.2% when in fact it was only at 3.5% so it still had a little way to go to reach the 3.2% low of September 2006. This month, although both U3 and U6 have fallen the differential remains at the 3.5% level.

U6 minus U3 Unemployment Rate

See Current U-6 Unemployment Rate for more info.

Employment by Sector

The employment “bubble chart” gives us a good representation of how each sector of the economy is doing (employment wise). As we can see from the chart below  [Read more…] about Unemployment Reaches Lowest Point Since 1969

Filed Under: BLS Tagged With: 1969, 2018, Differential, employment, Employment / Population Ratio, Employment by Sector, Labor Force Participation Rate, September, U3 and U6, unemployment rate

Ways to Impress Clients Who Visit Your Office Space

September 19, 2018 by Tim McMahon

Working in a nice office is great for your motivation and it’s something that’s going to keep you inspired and focused all day long. But what happens when someone pays you a visit – is your office really as amazing as you think it is? Different clients pay attention to different things and they’ll spot details that have passed you by, basing their impression of you strictly on your office. That’s why it has to be spotless, professional, comfortable and welcoming, as only this sort of space will tell your clients what kind of a businessperson you are from the moment they walk through the door.

Cluttered Desk

Messy Desk
Image Courtesy of Flickr

A cluttered desk is probably the worst thing that could welcome your clients and it’s definitely one of the worst ways to show that you’re professional, detail-oriented and meticulous about your work. Take care of the mess as soon as possible, organize your desk and remove all the things that aren’t absolutely necessary. A desk that’s almost empty is still better than a desk that’s full of papers, binders, office supplies and other junk you don’t really need. Opting for minimalism is the way to attract your clients’ attention and make them realize how trustworthy and reliable you are.

Proper Wall Colors

If you work for a company that uses its corporate colors on every wall in every office, there’s little you can do regarding the atmosphere in your office. If, however, you work in an office where you can introduce changes whenever you want or if you work from home, you can do wonders with the right choice of wall colors. Clients respond well to certain tones that make them peaceful and calm, so lots of offices all over the world are packed with different shades of beige, grey, yellow and even white. These colors are 

[Read more…] about Ways to Impress Clients Who Visit Your Office Space

Filed Under: Small Business Tagged With: Appliances, business, Desk, Furniture. Gadgets, Meetings, Office Space, Office Trends, refreshments

  • « Go to Previous Page
  • Page 1
  • Interim pages omitted …
  • Page 23
  • Page 24
  • Page 25
  • Page 26
  • Page 27
  • Interim pages omitted …
  • Page 44
  • Go to Next Page »

Primary Sidebar

Search Site

Sponsored:

Here's the Best Day to Buy Nvidia

Did you know Nvidia has an 86% history of soaring, beginning on one particular day every single spring? We call this the "Green Day phenomenon." It works on 5,000 stocks. For example, Tesla has a 100% history of soaring beginning on one particular day every single year.

Click here to see the green days for 5 major stocks today.

Recent Posts

  • May Employment Nothing Burger
  • April 2025 Employment / Unemployment Report
  • Would More Jobs Help Social Security?
  • March 2025- Employment / Unemployment Report
  • February 2025 Jobs Report

Resources

  • Bureau of Labor Statistics Current Population Survey Monthly survey of households conducted by the Bureau of Census for BLS. It provides data on the labor force, employment, unemployment, etc.
  • Capital Professional Services Providing web design and development and Internet marketing services
  • Elliott Wave University Using the Elliott Wave Principle to improve investment performance
  • Financial Trend Forecaster Featuring Moore Inflation Predictor, NYSE Rate of Change and NASDAQ Rate of change
  • InflationData.com Inflation calculators, databases, etc.
  • Intergalactic Web Designers Web design and development services
  • Your Family Finances

Articles by Category

Articles by Date

Disclaimer

At UnemploymentData.com we are not registered investment advisors and do not provide any individualized advice. Past performance is not necessarily indicative of future performance and future accuracy and profitable results cannot be guaranteed.

Privacy & Terms of Use

Privacy Statement & Terms of Use

Do Not Sell My Information

Copyright © 2025 · News Pro on Capital Professional Services, LLC. All rights reserved · Log in