
The U.S. Bureau of Labor Statistics (BLS) released its July
employment / unemployment report on August 7th, 2026.
Employment / Unemployment
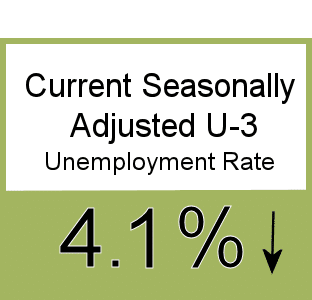
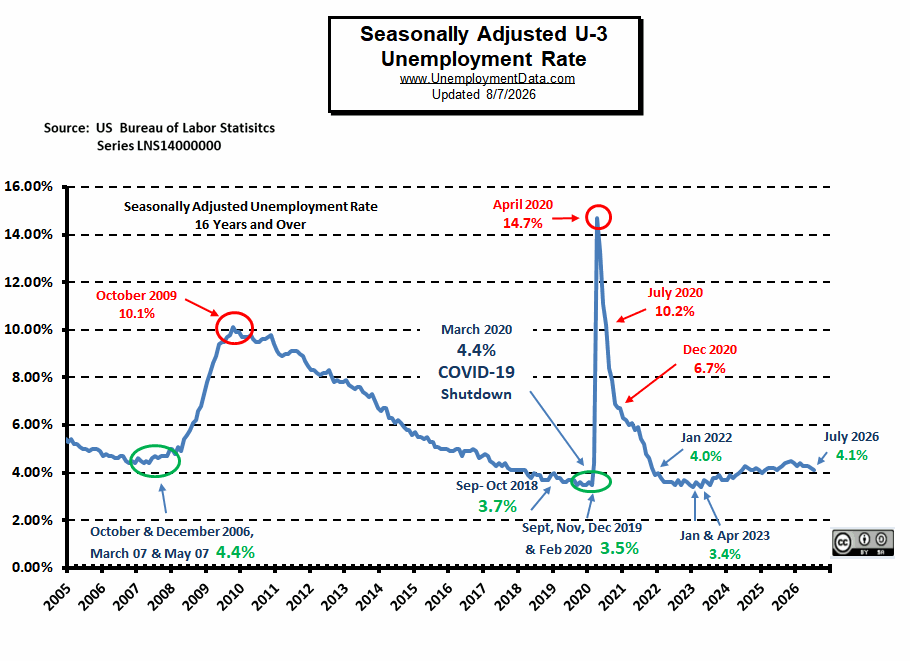
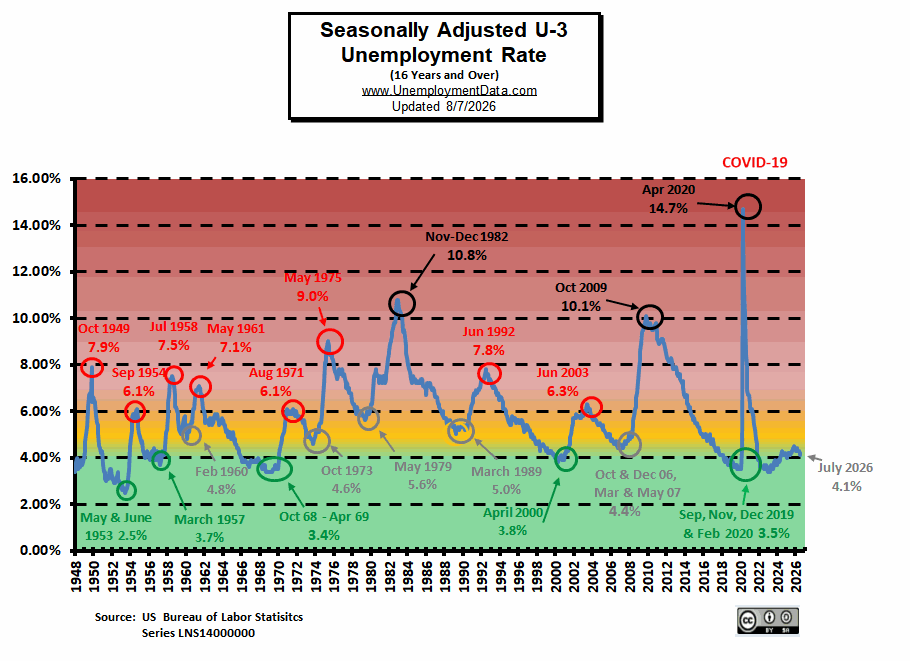
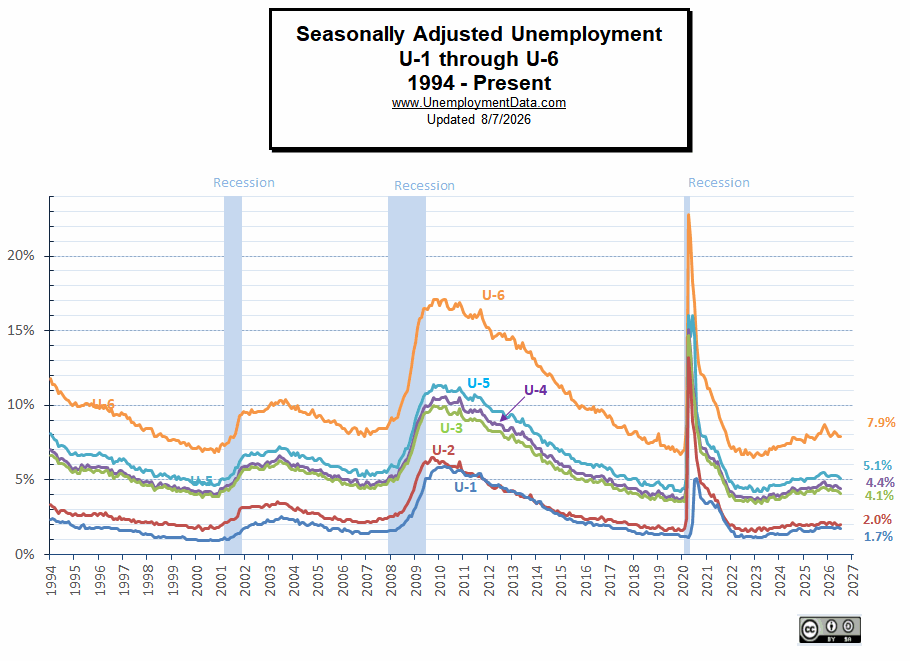
- Seasonally Adjusted U-3 is 4.1% down from 4.2%
- Unadjusted U-3 is 4.4% Unchanged
- Unadjusted U-6 is 8.3% up from 8.2%
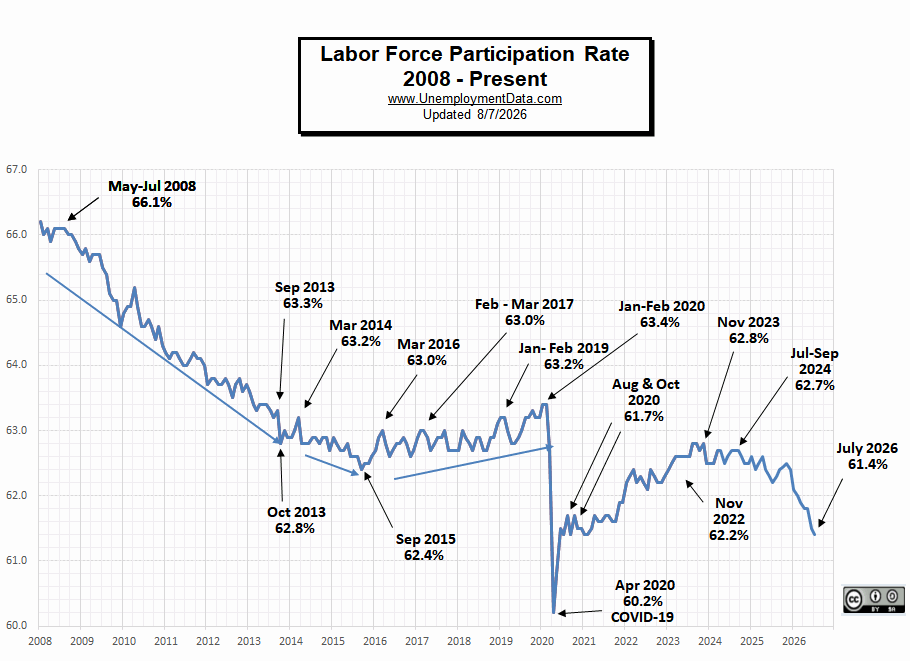
- Labor Force Participation is 61.4% down from 61.5%
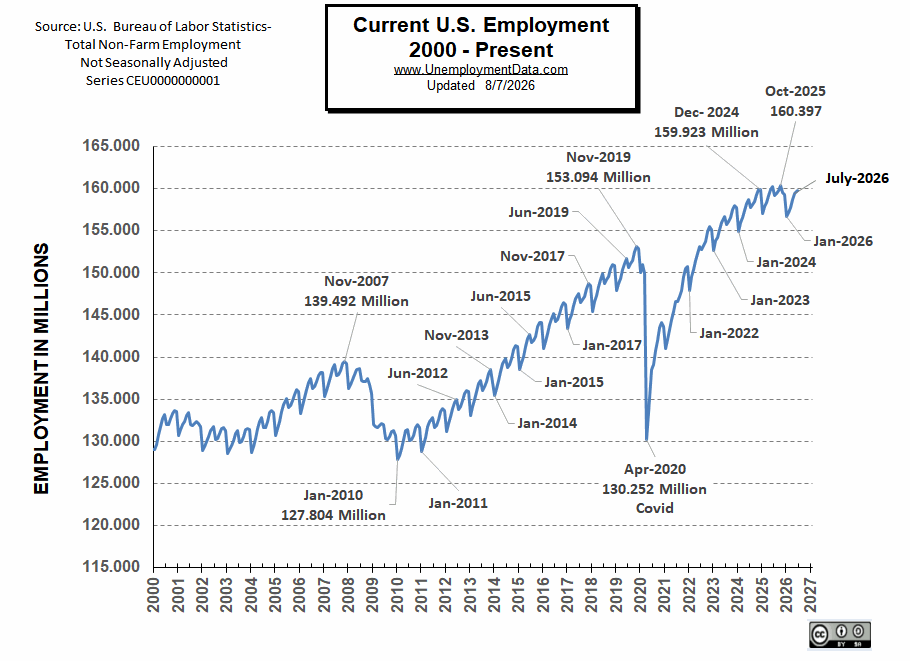
- Unadjusted Employment fell from 159.748 million to 158.649 million
- Next Update: September 4th, 2026
Summary:
Despite the Adjusted U-3 Unemployment Rate being DOWN, this report is weaker than the headline unemployment rate suggests. Although the decline in unemployment looks encouraging at first glance, but actual employment (not the employment percentage rate) is down by -1. 18 million based on the original reported numbers or -1.099 million based on current numbers.
According to the Commissioner of the U.S. Bureau of Labor Statistics:
“Both total nonfarm payroll employment (-23,000) and the unemployment rate (4.1 percent) changed little in July, the U.S. Bureau of Labor Statistics reported today. Employment continued to trend up in health care. …
… In July, the number of people jobless less than 5 weeks edged down to 2.0 million and is down by 344,000 over the year. The number of long-term unemployed (those jobless for 27 weeks or more) edged down over the month to 1.8 million but changed little over the year. The long-term unemployed accounted for 25.5 percent of all unemployed people in July.”
As usual, they are talking about “Seasonally Adjusted Jobs”.
Looking at the Unadjusted Establishment Survey report, we see…
The BLS is currently reporting employment of 158.649 million. Last month, the BLS reported employment of 159.830 million for June, which they have adjusted down to 159.748 million a decrease of -82,000. Original May numbers were 159.467 million, adjusted to 159.386 million, a decrease of –81,000. But based on the revised numbers, employment is still up by 382,000 since July 2025.
Current Unemployment Rate Chart
Current Employment Chart
 See Current Employment for more information.
BLS: July 2026 Employment by Sector
The BLS employment “bubble chart” based on the Establishment Survey Data gives us a good picture of the Seasonally Adjusted employment numbers.
The Bubble’s Size tells us the total Employment for that industry (i.e., larger bubbles mean more people are employed in that sector).
The bubble’s location on the chart tells us that there has been a change in Employment Levels over the most recent month… A bubble further to the right indicates larger job growth. A bubble’s vertical location on the chart shows the average industry salary.
Remember, these are Seasonally Adjusted Numbers, so they aren’t cumulative!
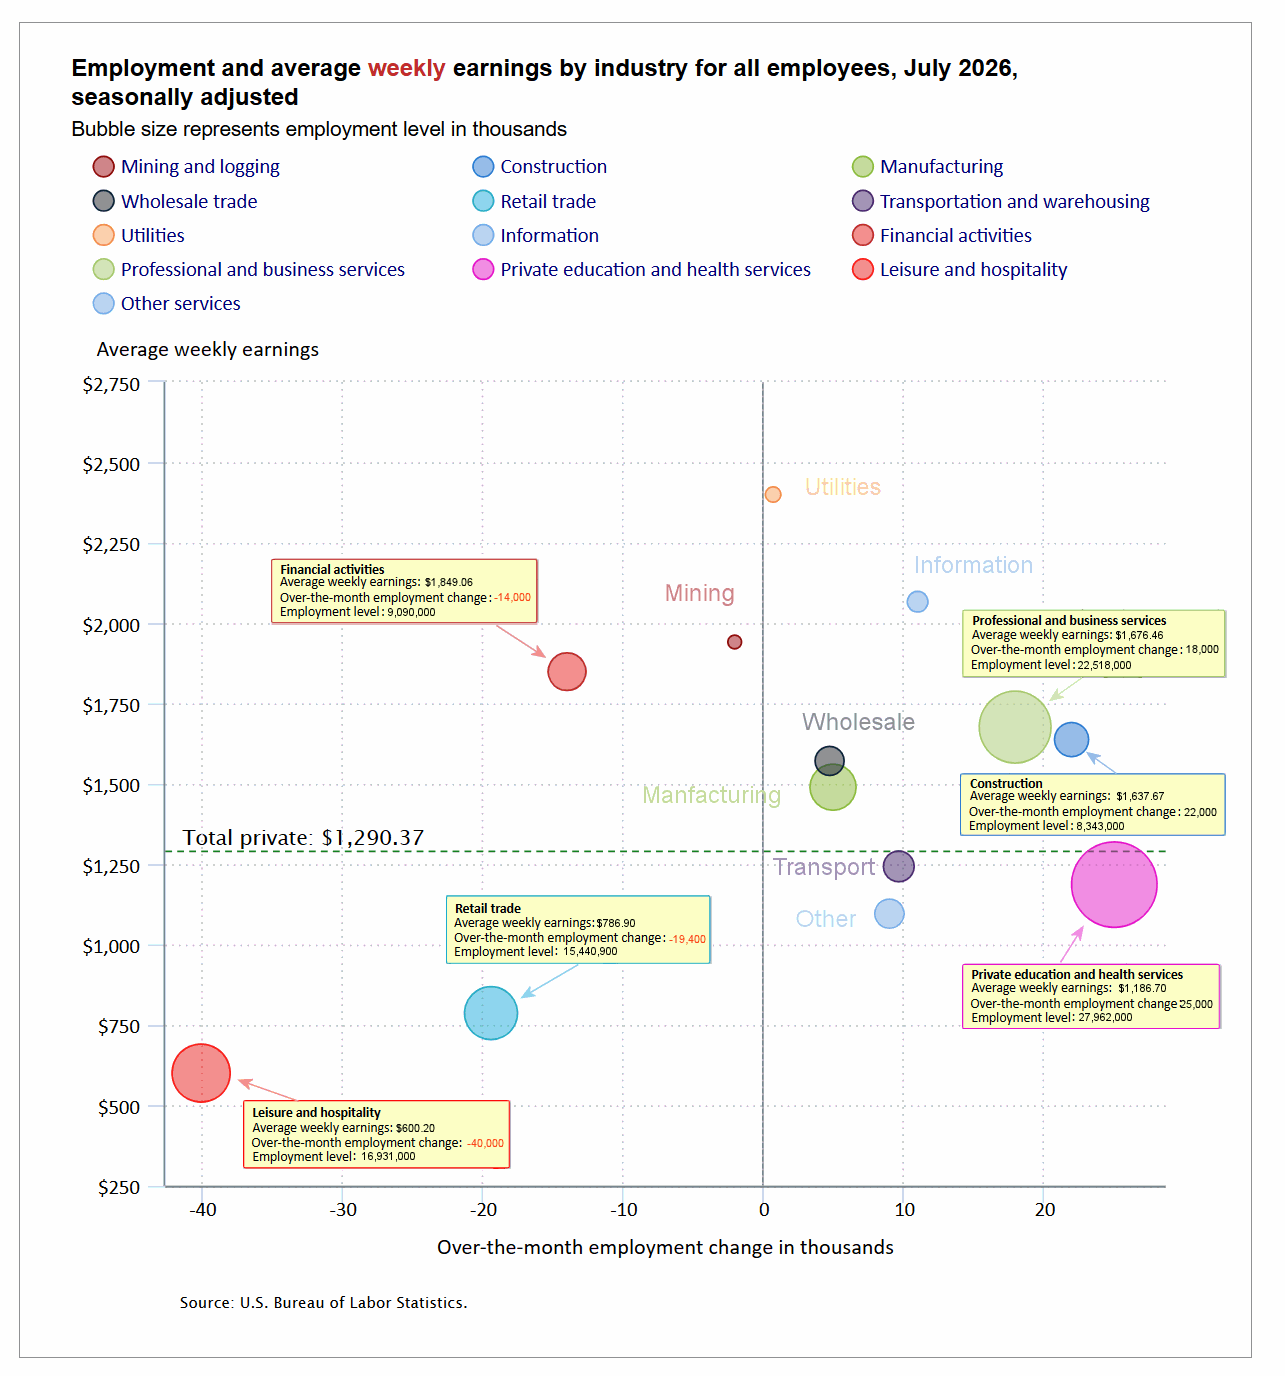 Looking at the above chart, we can see that 4 sectors lost employment in July: Leisure and Hospitality lost the most at -40,000 jobs, Retail lost -19,400 jobs, Financial lost -3,700 jobs, and Mining lost -2,000 jobs.
The biggest gainers were Education and Health at 25,000, Construction at 22,000, and Professional Services at 22,000.
BLS Average Weekly Wages
| Date | Average Weekly Wage |
| July 2026 | $1,290.37 |
| June 2026 | $1,291.05 |
| May 2026 | $1,287.28 |
| April 2026 | $1,283.16 |
| March 2026 | $1,278.40 |
| February 2026 | $1,280.08 |
| January 2026 | $1,274.93 |
| December 2025 | $1,266.08 |
| November 2025 | $1,264.30 |
| October 2025 | $1,258.90 |
| September 2025 | $1,253.43 |
| August 2025 | $1,249.33 |
| July 2025 | $1,249.89 |
| June 2025 | $1,241.46 |
| May 2025 | $1,243.03 |
| April 2025 | $1,236.86 |
| March 2025 | $1,231.20 |
| February 2025 | $1,225.21 |
| January 2025 | $1,223.17 |
| December 2024 | $1,224.17 |
| November 2024 | $1,221.42 |
| October 2024 | $1,216.28 |
| September 2024 | $1,209.31 |
| August 2024 | $1,207.70 |
| July 2024 | $1,199.39 |
| June 2024 | $1,200.50 |
| May 2024 | $1,197.41 |
| April 2024 | $1,191.93 |
| March 2024 | $1,193.34 |
| February 2024 | $1,185.75 |
| January 2024 | $1,178.16 |
| December 2023 | $1,175.46 |
| November 2023 | $1,173.04 |
| October 2023 | $1,166.20 |
| September 2023 | $1,165.47 |
| August 2023 | $1,163.41 |
| July 2023 | $1,157.28 |
| June 2023 | $1,155.15 |
| May 2023 | $1,146.99 |
| April 2023 | $1,147.58 |
| March 2023 | $1,141.34 |
| February 2023 | $1,141.61 |
| January 2023 | $1,146.14 |
| December 2022 | $1,125.73 |
| November 2022 | $1,129.01 |
| October 2022 | $1,124.01 |
| September 2022 | $1,119.87 |
| August 2022 | $1,116.42 |
| July 2022 | $1,116.54 |
| June 2022 | $1,106.76 |
| May 2022 | $1,105.47 |
| April 2022 | $1,102.01 |
| December 2021 | $1,086.46 |
BLS Employment Levels by Industry
July 2026, Seasonally Adjusted Employment
| Industry | Monthly Increase | Ave. Weekly Earnings | July Employment Level | June Employment Level |
|---|---|---|---|---|
| Total private | 30,000 | $1,290.37 | 135,588,000 | 135,613,000 |
| Mining and logging | -2,000 | $1,941.27 | 607,000 | 607,000 |
| Construction | 22,000 | $1,637.67 | 8,343,000 | 8,331,000 |
| Manufacturing | 5,000 | $1,489.55 | 12,611,000 | 12,598,000 |
| Wholesale | 4,700 | $1,571.27 | 6,062,400 | 6,057,900 |
| Retail trade | -19,400 | $786.90 | 15,440,900 | 15,459,700 |
| Transportation and warehousing | 9,700 | $1,243.20 | 6,596,100 | 6,603,700 |
| Utilities | 700 | $2,400.08 | 608,100 | 606,800 |
| Information | 11,000 | $2,066.47 | 2,780,000 | 2,774,000 |
| Financial activities | -14,000 | $1,849.06 | 9,090,000 | 9,104,000 |
| Professional and business services | 18,000 | $1,676.46 | 22,518,000 | 22,507,000 |
| Private education and health services | 25,000 | $1,186.70 | 27,962,000 | 27,973,000 |
| Leisure and hospitality | -40,000 | $600.20 | 16,931,000 | 16,951,000 |
| Other services | 9,000 | $1,096.41 | 6,038,000 | 6,040,000 |
Source: BLS
ADP® National Employment Report
ADP provides an independent (non-government) estimate of private-sector employment and pay, based on data derived from ADP client payrolls. According to ADP®, In collaboration with Stanford Digital Economy Lab.
ADP: Private employers added 44,000 jobs in July
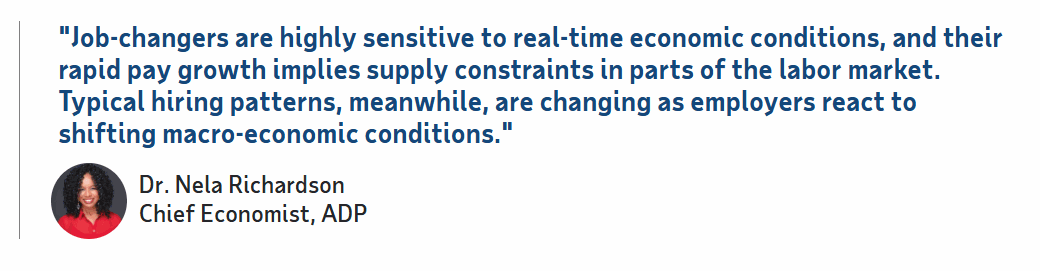
- Sector-level hiring was choppy last month, but pay sent a clear signal. Year-over-year pay for job-changers accelerated to its fastest pace of growth in nearly a year.
Source: ADP®
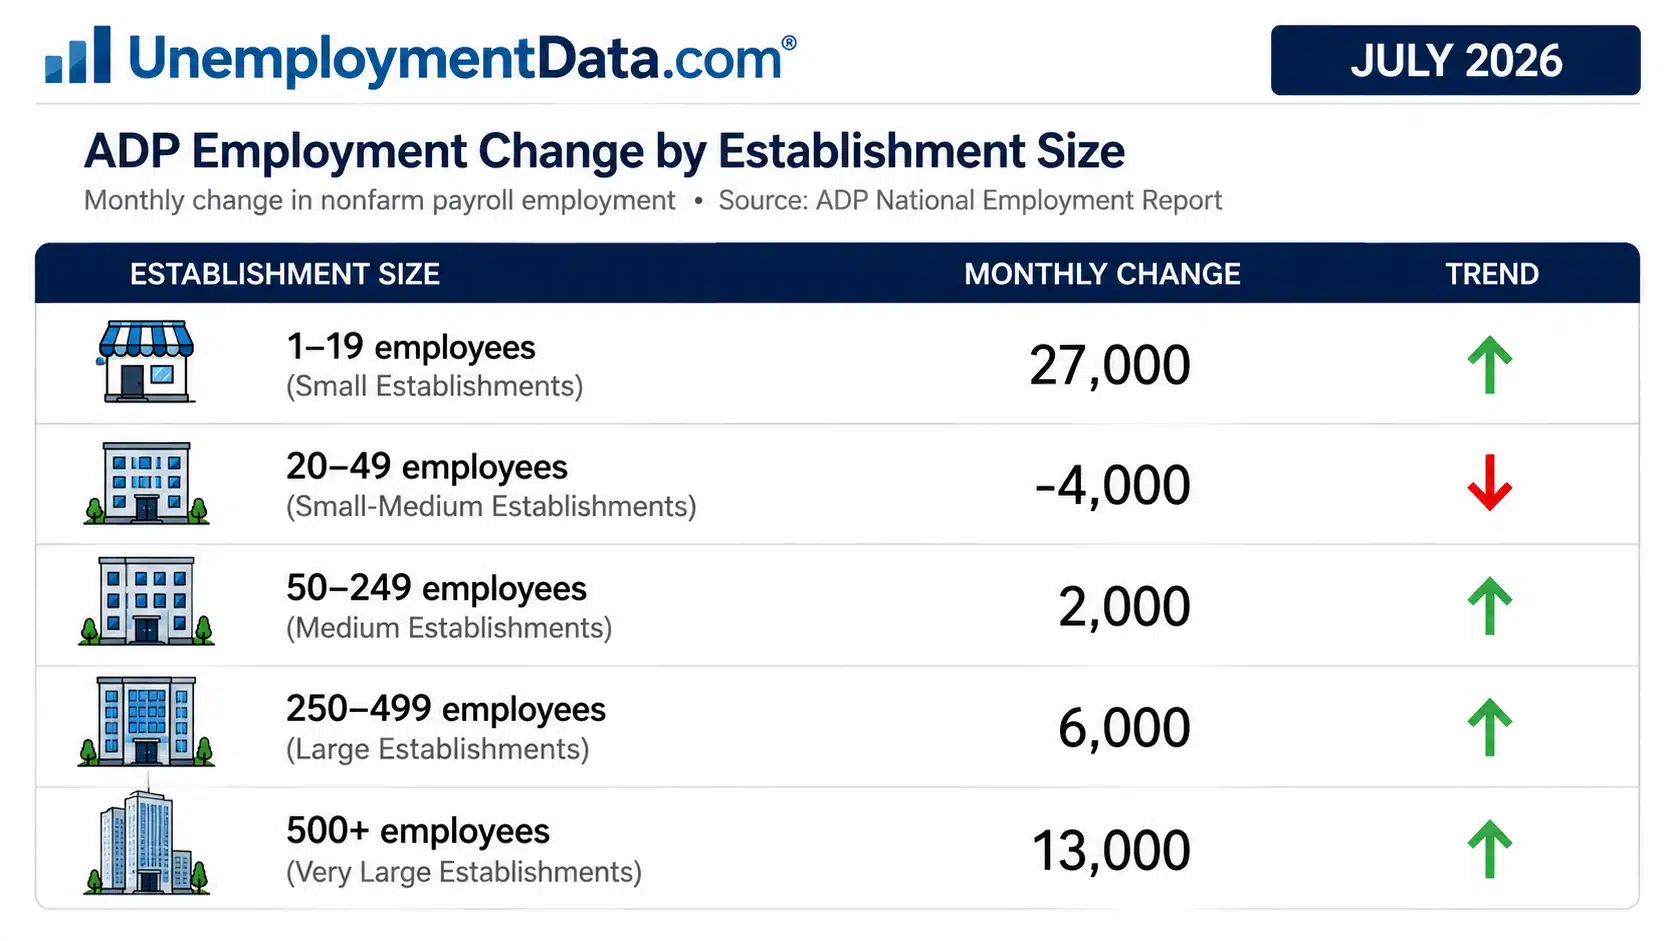
ADP Private Employment by Establishment Size
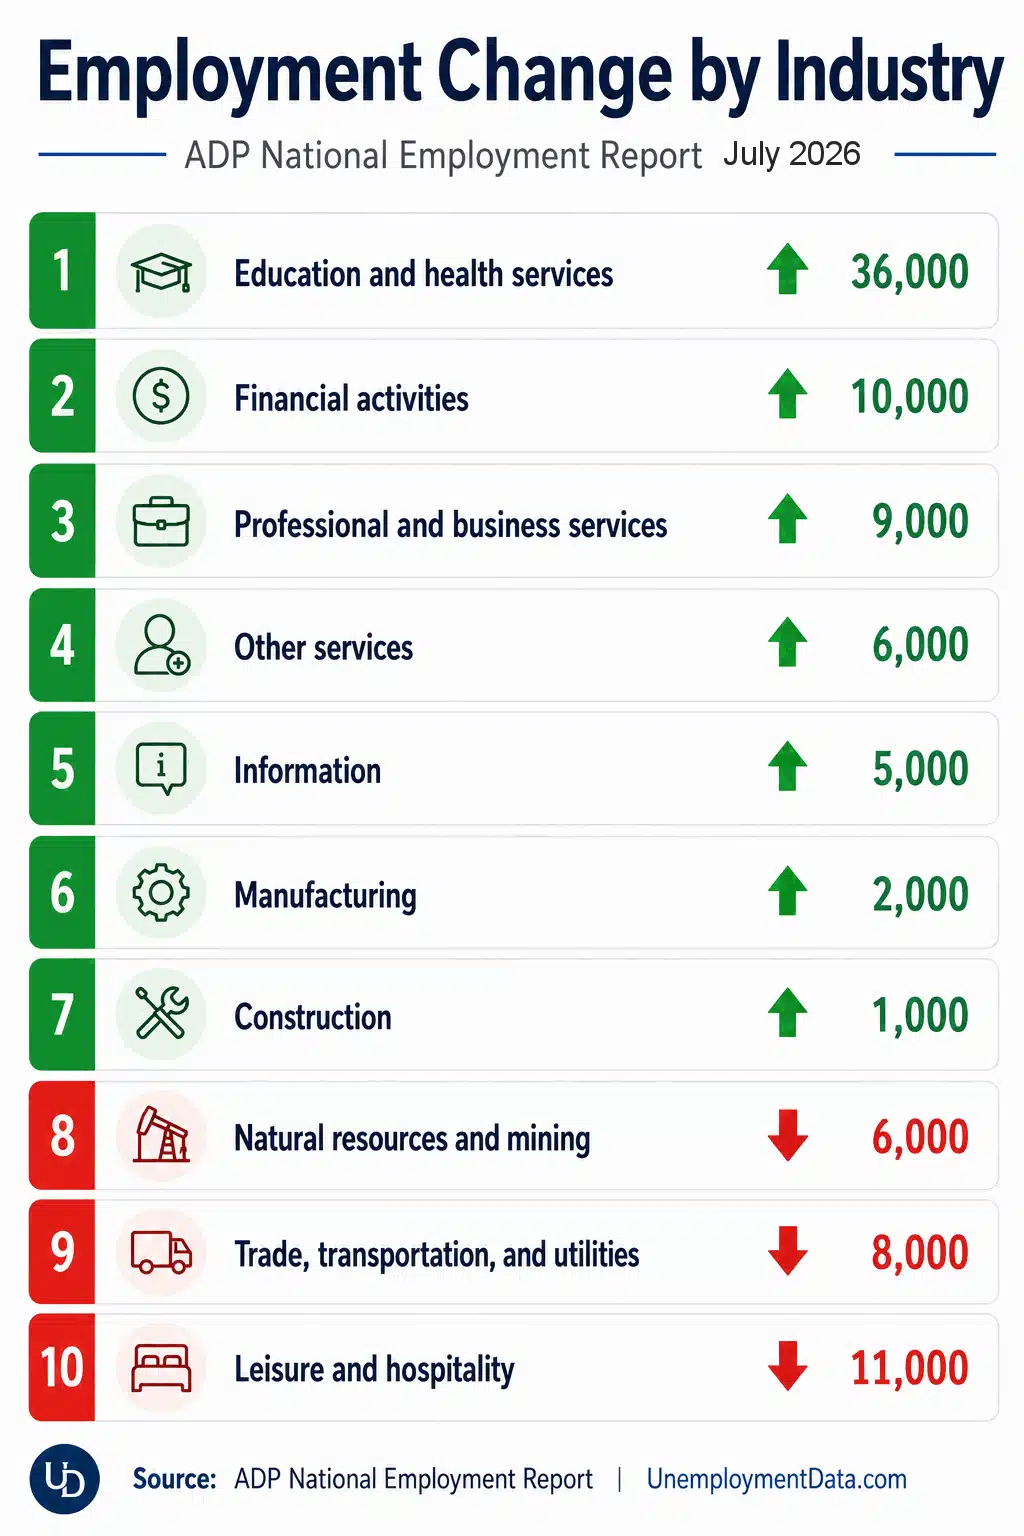
ADP Job Gainers / Losers
Most sectors showed gains, with three losers.
Seasonally Adjusted Unemployment Rate Chart 1948-Present
Less Than Full Employment
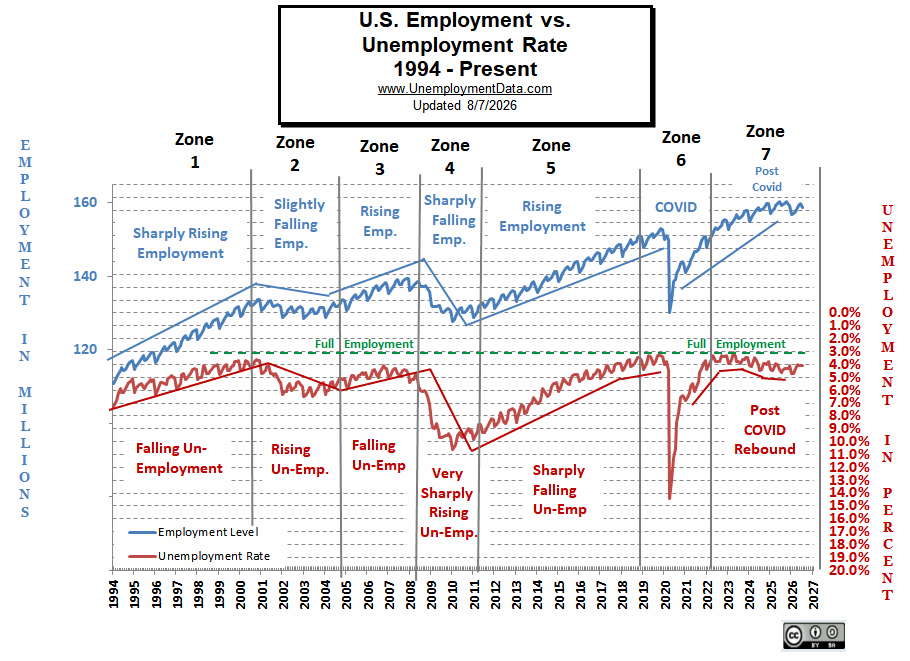
This chart compares employment levels with the (inverted) unemployment rate.
Full Employment is when everyone who wants a job has one. It is generally considered to be around 3%. After the unemployment rate almost touched the magic full employment line in April 2023, it began moving away (i.e., higher unemployment).
Note: The Unemployment rate is inverted to track the employment rate. Neither is Seasonally Adjusted. For more information see Employment vs. Unemployment.
Note: Full employment is not considered to be at zero percent because even when employers are having difficulty finding employees, some people are still unemployed due to either:
- Structural unemployment (mismatch between worker skills and job requirements, i.e., not enough training) or
- Frictional unemployment. There will always be people who have quit or have lost a seasonal job and are in the process of getting a new job. Or simply because they quit their job, knowing it would be easy to find another (hopefully better) job.
Seasonally Adjusted U1 through U6 Unemployment Rates
Labor Force Participation Rate
The LFPR fell slightly from 61.5% in June to 61.4% in July. There has been a downward trend since the November 2023 peak. This may be partially explained by an aging population retiring.
Note: A rising LFPR means that a greater portion of the Non-Institutional population is in the Labor Force.
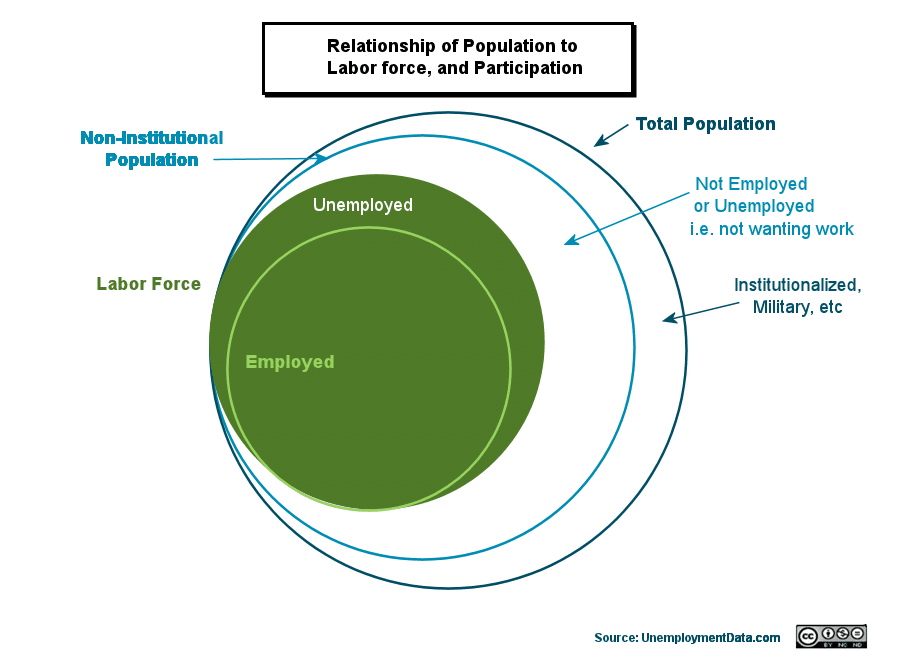
The Labor Force Participation Rate is the percentage of the Non-Institutional Population that makes up the Labor Force.
And the Employment – Population Ratio is the percentage of the Total Population that is Employed. We created a chart to help explain the difference. The Employment–Population Ratio is the percentage of the largest circle to the smallest circle in this diagram. In contrast, the LFPR is the relationship of the 2nd largest circle to the 3rd largest circle (entire green circle).
Employment-Population Ratio
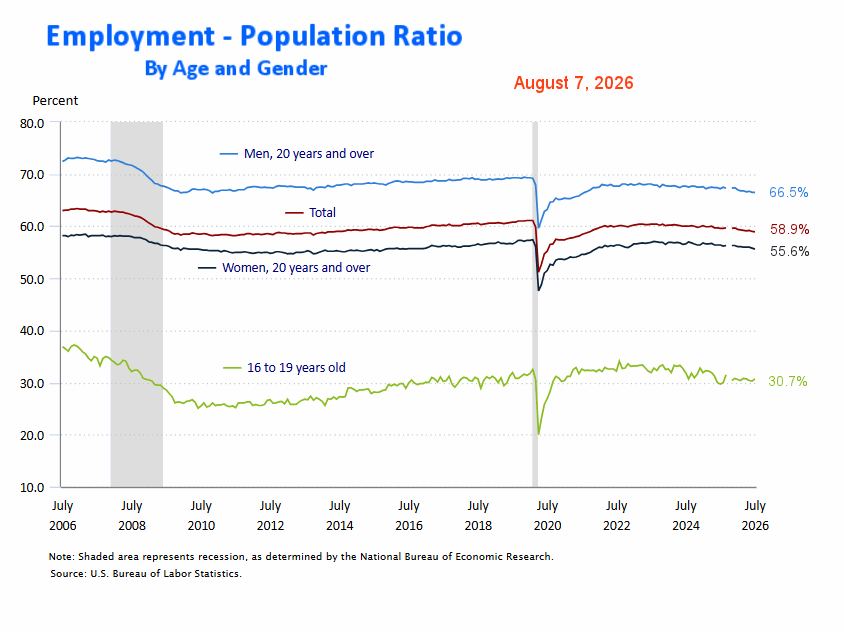
By Gender and Age
This chart shows the Employment-Population Ratio by Gender. Men make up a much larger portion of the workforce, i.e., 66.5% of men are employed, and only 55.6% of women are employed.
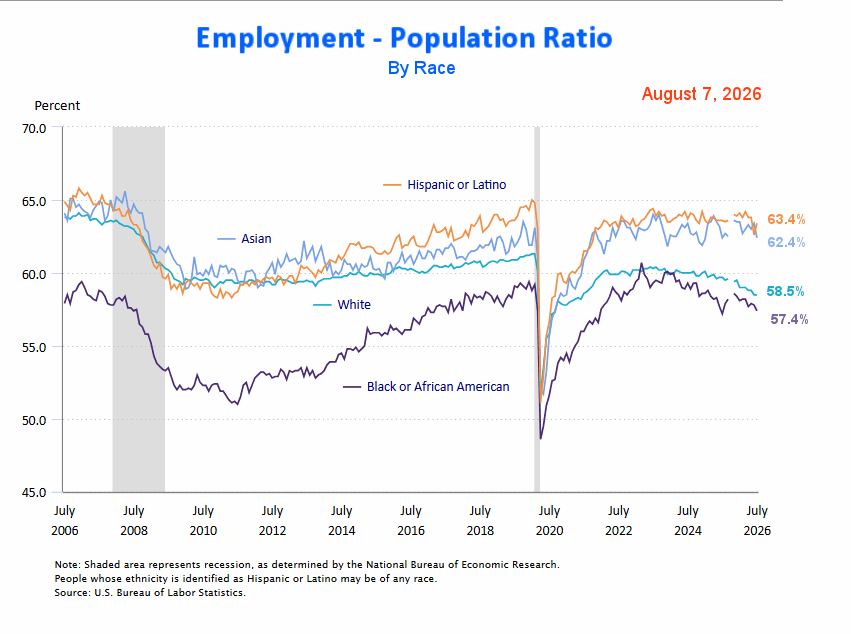
 Employment-Population Ratio by Race
This chart shows the Employment-Population Ratio by Race (including both Men and Women). As we can see, Hispanics and Asians have the highest percentage of their population employed.
 Percent Unemployed 27 weeks or Longer
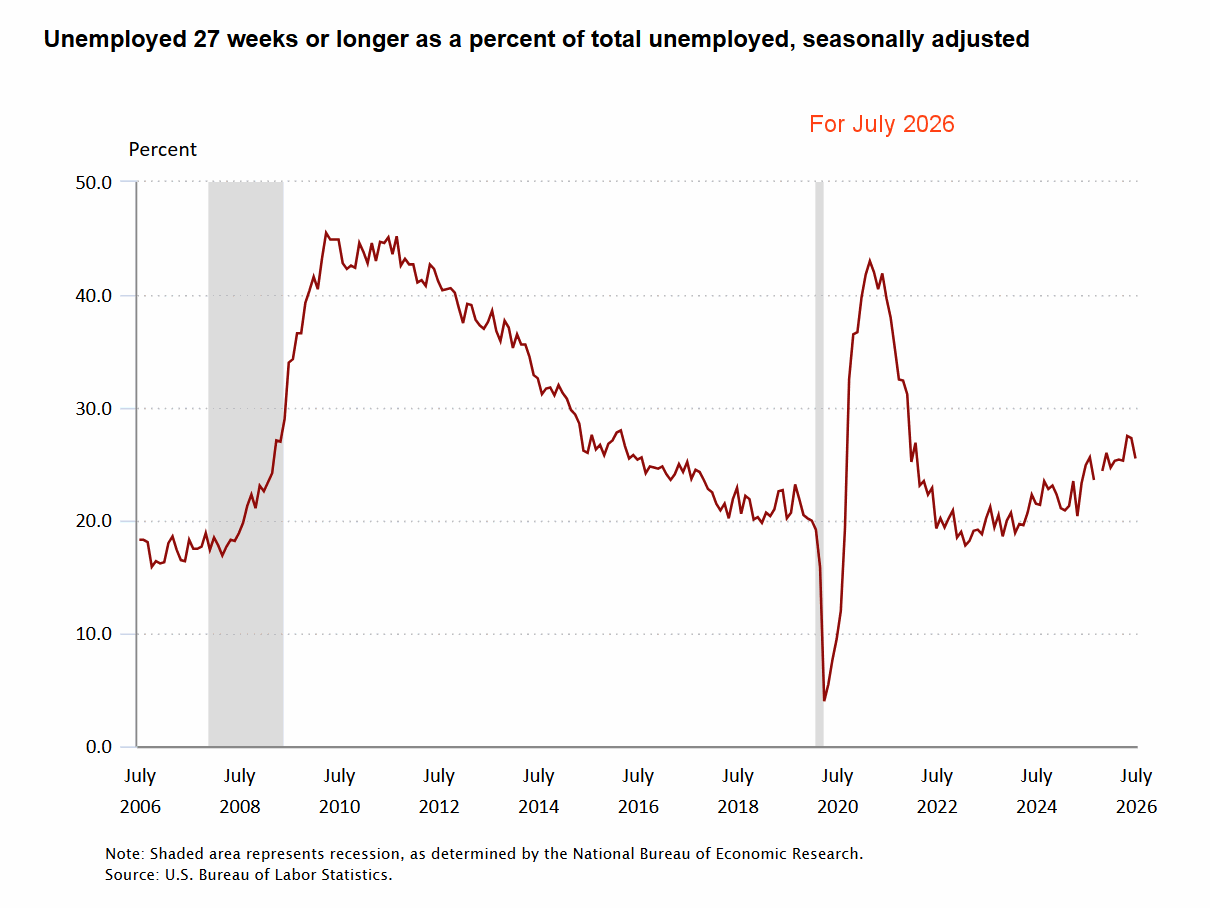
A good sign this month as those unemployed long term dropped sharply.
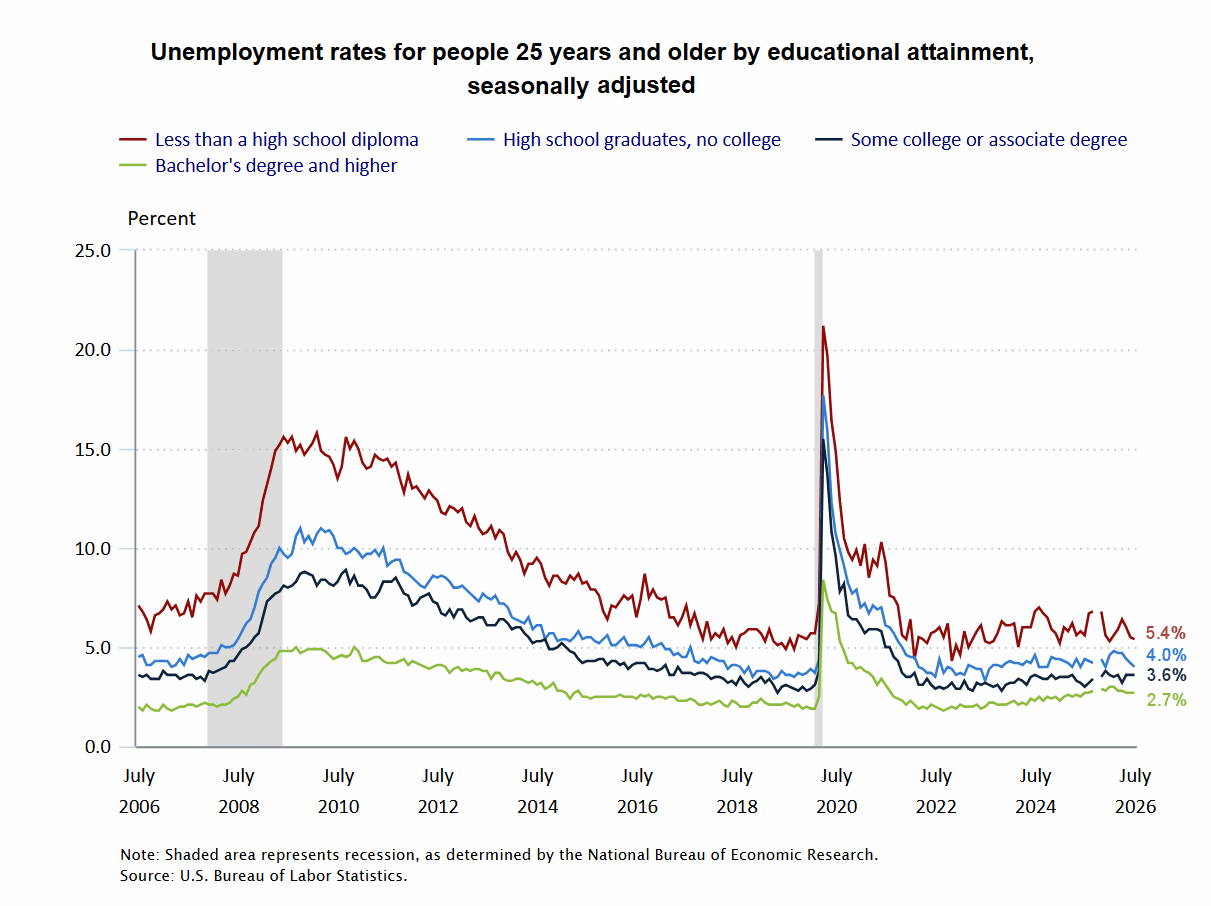
Unemployment by Education
Read more on UnemploymentData.com.
- May Jobs Report for April 2026
- Inflation vs Unemployment Challenge FED’s Resolve
- Jobs AI Can’t Destroy: Careers for 2026 and Beyond
- Why February 2026’s Jobs Report Was an Anomaly, Not a Trend
- April Employment Report for March 2026
- Department of Labor Creates Free AI Training
From InflationData.com
- May 2026: BLS April Inflation
- How will FED Chairman Warsh affect Rates and Inflation?
- Ben Cowan: Is the Fed Heading Toward Checkmate?
- The Truth About Truflation vs. the BLS’s CPI
From Financial Trend Forecaster
- Moore Inflation Predictor
- NYSE ROC
- NASDAQ ROC
- ETH and BTC ROC Signal
- Will New FED Chair Warsh be Hawkish or Dovish?
- Changes at the Federal Reserve: New Leadership, New Direction
- Where the Markets Stand Based on ROC Analysis
- Will the Collapse of OPEC Result in Lower Oil Prices?
- The California Energy Crisis
- Energy Is Non-Fungible: Costing the World Billions
- Aluminum The Battery That Could Render Lithium Obsolete
- The Pipes of Global Finance Are Getting an Upgrade
- U.S. Dollar: What to expect in 2026
- Shiller Price Earnings Ratio 2nd Highest in History
- This Forecasting Tool Nailed the S&P Turns
- Warren Buffett isn’t buying — and that says a lot.
- Debt Ceiling Drama
From OptioMoney
