• About WordPress
    • WordPress.org
    • Documentation
    • Learn WordPress
    • Support
    • Feedback
  • Log In
  • Skip to primary navigation
  • Skip to main content
  • Skip to primary sidebar
  • Home
  • Contact us
  • Related Sites
    • InflationData.com
    • Financial Trend Forecaster
    • Your Family Finances
    • Elliott Wave University
    • Optio Money
  • About
    • Terms of Use
    • Disclaimer & Disclosure
    • Privacy Statement
  • Sitemap
    • 2009-2010 Posts
    • 2011 Posts

UnemploymentData.com

Your Source for Employment and Unemployment Data

Unemployment
  • Charts
    • Current Unemployment Rate Chart
    • Current Employment Rate (Chart and Data)
    • Current Employment vs Unemployment Chart
    • Historical Employment Data
    • Employment Population Ratio
    • Misery Index
  • Unemployment
    • Historical Unemployment Rate Tables
    • What Is U-6 Unemployment?
    • Unadjusted vs. Seasonally Adjusted U-3 Unemployment Rate
    • BLS vs. Gallup Unemployment Numbers
    • Current U-6 Unemployment Rate
    • What is the Labor Force Participation Rate?
    • What is the Real Unemployment Rate?
  • Employment
    • Current Employment Rate (Chart and Data)
    • Historical Employment Data
    • Contacting a Live Person at the State Employment Commission
      • How to Talk to a Live Person at the Virginia Unemployment Commission
      • Florida’s FLUID Unemployment Program
    • Benefits
      • Insurance
      • Retirement
    • Careers
    • Employment Costs
    • Experience
    • Government
    • Job Hunting
      • Interview
      • Resume
  • Find Articles
  • Education
    • Skills
  • General
    • Small Business
      • Outsourcing
    • Success
You are here: Home / Archives for unemployment

unemployment

October Unemployment- Jobs Much Better Than Expected

November 2, 2019 by Tim McMahon

Adj U3 Icon 3-6 upThe U.S. Bureau of Labor Statistics (BLS) released its employment / unemployment report for October on November 1st.

Unemployment is still near record lows. Although the “Seasonally Adjusted” Unemployment Rate for October ticked up from 3.5% in September to 3.6%. However, the unadjusted U-3 Unemployment rate was unchanged at 3.3%. This Jobs report was unexpectedly good despite counting 30,000 “unemployed” strikers at auto manufacturers.

According to the Commissioner of the U.S. Bureau of Labor Statistics:

“Nonfarm payroll employment increased by 128,000 in October, and the unemployment rate was little changed at 3.6 percent. Notable employment gains occurred in food services and drinking places, social assistance, and financial activities. Within manufacturing, employment declined in motor vehicles and parts due to strike activity. Federal government employment was down, reflecting a drop in the number of temporary jobs for the 2020 Census.”

Experts had been predicting that the economy would add no more than 75,000 jobs. In fact, MarketWatch on Thursday told readers that
the report would be “a big dud” due to the impact of the General Motors strike on the overall numbers.
If it hadn’t been for the strike the October numbers would have been even better.

Of course, the Commissioner is talking about “Seasonally Adjusted Jobs” from the “Current Population Survey (CPS)”
rather than looking at the results reported by actual companies in the BLS’ “Current Employment Statistics survey (CES)”
in reality, the BLS has done a lot of “Adjusting” over the last few months.
The original CES numbers the BLS reported for August was 151.517 million people employed in August
then later they adjusted it up to 151.607 million. And for September they originally reported there were 151.949 million employed
and currently they are reporting 152.962 million employed so that is an actual increase of 1.013 million NOT and adjusted increase of 128,000!
But in addition to “Seasonal Adjustment”, they adjusted September’s number up to 152.015 million
so the difference between September and October appears to be less than it actually was.

For more info see our Current Unemployment Chart and Current U.S. Employment Chart commentary:

October Jobs Report Smashes Expectations

  • Unadjusted U-3 was Unchanged at 3.3%!
  • Adjusted U-3 was up slightly from 3.5% to 3.6%!
  • Unadjusted U-6 was Unchanged at 6.5%!
  • Labor Force Participation hits levels not seen since 2013 at recent peak levels of 63.3%.
  • Unadjusted Employment Up
  • The unemployment rate for black Americans nudged lower to 5.4 percent, setting a new record,

Key factors in the BLS report were:
Employment in food services and drinking places rose by 48,000 over the month.
Financial activities employment rose by 15,000, with nearly half of the gain occurring in insurance carriers and related activities (+7,000).

Social assistance added 20,000 jobs in October, with most of the gain occurring in individual and family services.

Financial activities added 16,000 jobs.
Professional and business services added 22,000 jobs.

Health care added 15,000 jobs.

Manufacturing employment declined by 36,000 in October.
Employment in motor vehicles and parts manufacturing decreased
by 42,000, reflecting strike activity.

[Read more…] about October Unemployment- Jobs Much Better Than Expected

Filed Under: BLS Tagged With: BLS, Bureau of Labor Statistics, employment, jobs, Labor, Labor Force, Labor Force Participation Rate, Participation Rate, productivity, Sector, unemployment

September Unemployment Rate Hits 50-Year Low

October 5, 2019 by Tim McMahon

The U.S. Bureau of Labor Statistics (BLS) released its employment / unemployment report for September released on October 4th. Unemployment is at record lows. According to the BLS, the “Seasonally Adjusted” Unemployment Rate for September fell to 3.5% after spending 3 months at 3.7%. The last time unemployment was this low was in December 1969 almost exactly 50 years ago.

According to the Commissioner of the U.S. Bureau of Labor Statistics:

“The unemployment rate declined by 0.2 percentage point to 3.5 percent in September, and nonfarm payroll employment increased by 136,000. Employment continued to trend up in health
care and in professional and business services… Health care employment rose by +39,000 in September… employment continued to trend up in professional and business services +34,000… Employment in transportation and warehousing edged up by +16,000… Government employment also continued to trend up in September +22,000…”

Of course, he is talking about “Seasonally Adjusted Jobs” in reality last month the BLS reported there were 151.517 million people employed in August and this month they are reporting there are 151.949 million employed in September, so that is an increase of 432,000 jobs.

For more info see our Current Unemployment Chart and Current U.S. Employment Chart commentary:

Key September Employment and Unemployment Numbers

This month’s Unemployment report was full of positive news.

  • Adjusted U-3 Unemployment-    3.5% down from 3.7% June through August.
  • Unadjusted U-3 Unemployment-  3.3% down from 3.8% in August and 4.0% in July, it was 4.4% in January.
  • Unadjusted U-6 Unemployment-  6.5% down a whopping -0.8% from 7.3% in August.
  • Unadjusted Employment (Establishment Survey)- 151.949 up from the 151.517 million the BLS reported in August.
  • Labor Force Participation Rate- 63.2% unchanged from August but up from 63.0% in July, and 62.9% June.

Key factors in the BLS report were:

Health care employment increased by 39,000

Professional and business services increased by 34,000

Transportation and warehousing increased by 16,000

Government employment increased by 22,000 approximately 1,000 of those were related to the upcoming census.

Hispanic and African American unemployment are both at the lowest levels on record.


[Read more…] about September Unemployment Rate Hits 50-Year Low

Filed Under: General Tagged With: BLS, Bureau of Labor Statistics, education, employment, Labor, productivity, unemployment

Things You Need to Do Quickly if You’re Unemployed

September 20, 2019 by Guest Contributor

Losing a job is never a good feeling, whether or not you saw it coming ahead of time. However, regardless of why you are no longer employed, it is important that you take action to protect yourself and your family until you find work again. Depending on your age, a job loss may be the perfect time to start thinking about retiring, and collecting Social Security or looking for part-time work. No matter what direction you choose after losing your job, here are some important things you need to do.

File for Unemployment

As we said in Stretch Your Dollars While Between Jobs filing for unemployment should be the first thing you do if you become unemployed through no fault of your own even if you think your unemployment will be short-lived. After all, any extra money you can pick up will be useful while you are unemployed. If you are eligible for Social Security you may want to sign up for that instead. Legal professionals may be able to help with your case. This video explains some factors in choosing when to file for Social Security. It says that if you have the option of filing for Social Security Disability or Social Security retirement benefits you are much better off filing for the disability benefit. This is because disability will be 100% of your benefit while if you are filing early for Social Security your benefit will be reduced.

Alert Your Creditors

If you think there is any possibility that you won’t be able to make the payments on your debts it is important that your creditors know that before you fail to make credit card, car, or other payments. It may be possible to make alternate arrangements to stay current on your debt balances. [Read more…] about Things You Need to Do Quickly if You’re Unemployed

Filed Under: Unemployment Tagged With: career, health insurance, Social Security, unemployment

July Unemployment Unchanged But…

August 3, 2019 by Tim McMahon

Adjusted U3 3.7%The U.S. Bureau of Labor Statistics (BLS) released its monthly unemployment survey results for July on August 2nd. Unemployment is still near record lows but this month’s Unemployment report was a bit of a “mixed bag” with some positive news and some not quite so positive.

According to the Commissioner of the U.S. Bureau of Labor Statistics:

“Nonfarm payroll employment increased by 164,000 in July, and the unemployment rate was unchanged at 3.7 percent. Notable job gains occurred in professional and technical services, health care, social assistance, and financial activities.

The July increase in payroll employment was in line with the average monthly job gain in the first half of the year (+165,000), but below the average monthly job gain of 223,000 for 2018. (Incorporating revisions for May and June, which decreased employment by 41,000, monthly job gains have averaged 140,000 over the past 3 months.) ”

Of course he is talking about “Seasonally Adjusted Jobs” in reality there were 152.307 million people employed according to the BLS’ June report and then they adjusted it down to 152.242 million but in July there are only 151.183 million employed so there was either a decrease of -1.059 million jobs based on the new numbers or a decrease of -1.124 million based on the original numbers. But there were only 148.295 million employed in January so there about 2.88 million more people employed in July than in January.

For more info see our Current Unemployment Chart and Current U.S. Employment Chart commentary:

Key July Employment and Unemployment Numbers

  • Adjusted U-3 Unemployment-   3.7% Unchanged from June 
  • Unadjusted U-3 Unemployment-  4.0% Up from 3.8% in June and 3.4% in May but still below 4.1% in February, and 4.4% in January.
  • Unadjusted U-6 Unemployment-  7.3% down from 7.5% in June Up from 6.7% in May. It was 7.5% in March, 7.7% in February and 8.8% in January.
  • Unadjusted Employment (Establishment Survey)- 151.183 million down from 152.307 million in June up from 148.295 million in January.
  • Labor Force Participation Rate- 63.0% up from 62.9% June, 62.8% in April and May but unchanged from 63.0% in March and still below the peak of 63.2% in February.

Although they rose a notch in June (and stayed there in July), current Seasonally Adjusted U-3 levels are still below the 3.8% lows of 2000. Prior to that, we have to go all the way back to 1969 to see better unemployment levels than we have currently. If we break below 3.4% we have to go all the way back to 1953 (during the Korean War) to find lower levels. And we must remember that there was a massive loss of the workforce due to the war, and a higher percentage of the population was not counted due to “farming”,  so we probably won’t see levels that low again. The 1969 lows occurred during the Vietnam war. Prior to 1969 was a low of 3.7% in 1957 so we are currently at that level. As we can see from the above chart we are in one of only 5 “green zones” where unemployment levels are below 4%. Not even the “boom” period 2006-2007 reached such low levels.

[Read more…] about July Unemployment Unchanged But…

Filed Under: General Tagged With: Charts, education, employment, Industry, Sectors, unemployment

Unemployment By State and Political Party

July 19, 2019 by Tim McMahon

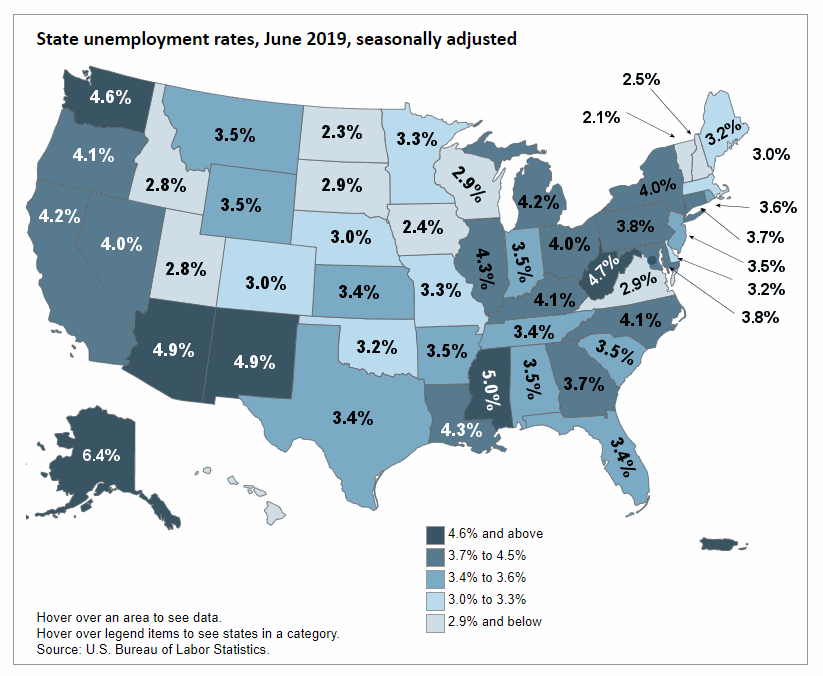
Unemployment rates were lower in June in 6 states and stable in 44 states and the District of Columbia, the U.S. Bureau of Labor Statistics reported today. Three states had jobless rate decreases from a year earlier and 47 states and the District had little or no change.

Vermont had the lowest unemployment rate in June, 2.1 percent. The rates in Alabama (3.5 percent), Arkansas (3.5 percent), New Jersey (3.5 percent), and Texas (3.4 percent) set new series lows. (All state series begin in 1976.) Alaska and Puerto Rico had the highest jobless rates, at 6.4 and 8.4 percent respectively. In total, 13 states had unemployment rates lower than the U.S. figure of 3.7 percent, 9 states and the District of Columbia had higher rates, and 28 states had rates that were not appreciably different from that of the nation.

State Unemployment Rates

Table of U.S. State Political Party statistics as of January 2019

I’ve sorted the following table by political party. If we look at it this way, we can see that [Read more…] about Unemployment By State and Political Party

Filed Under: Unemployment Tagged With: Democrat, Republican, State, unemployment

June Unemployment Higher

July 6, 2019 by Tim McMahon

Adjusted U3 3.7%The U.S. Bureau of Labor Statistics (BLS) released their monthly unemployment survey results for June on July 5th. Unemployment is still near record lows but it has ticked up a bit.

According to the Commissioner of the U.S. Bureau of Labor Statistics:

” Nonfarm payroll employment increased by 224,000 in June, and the unemployment rate was little changed at 3.7 percent.
Over the month, notable job gains occurred in professional and business services, in health care, and in transportation and warehousing.”

Of course the Commissioner is talking about “Seasonally Adjusted Jobs” in reality there were 152.307 million people employed in June up from 151.600 million employed in May so the actual increase was 707,000 new jobs in June. There were only 148.295 million employed in January so there are  over 4 million more people employed in June than in January!

Key factors in the report were:

Employment in Professional and Business Services increased by 51,000…
Health care employment increased by 35,000 in June…
Employment in transportation and warehousing increased by 24,000
Construction employment rose by 21,000…

For more info see our Current Unemployment Chart and Current U.S. Employment Chart commentary:

Key June Employment and Unemployment Numbers

  • Adjusted U-3 Unemployment-   3.7% Up from 3.6% in May 
  • Unadjusted U-3 Unemployment-  3.8% Up from 3.4% in May but still below 4.1% in February, and 4.4% in January.
  • Unadjusted U-6 Unemployment-  7.5% Up from 6.7% in May. It was 7.5% in March, 7.7% in February and 8.8% in January.
  • Unadjusted Employment (Establishment Survey)- 152.307 million up from 151.600 Million in May and  148.295 million in January.
  • Labor Force Participation Rate- 62.9% up from 62.8% in April and May down from 63.0% in March and from the peak of 63.2% in February.

Current Seasonally Adjusted U-3 levels are still below the 3.8% lows of 2000. Prior to that we have to go all the way back to 1969 to see better unemployment levels than we have currently. If we break below 3.4% we have to go all the way back to 1953 to find lower levels and remember that was during the boom that followed WWII with a massive loss of the workforce due to the war so we probably won’t see levels that low again.

[Read more…] about June Unemployment Higher

Filed Under: BLS Tagged With: BLS, Bureau of Labor Statistics, employment, Employment / Population Ratio, Employment by Sector, June 2019, Labor Force Participation Rate, LFPR, unemployment

May Unemployment Still Low

June 8, 2019 by Tim McMahon

Adj U3 Icon 3-6 PercentThe U.S. Bureau of Labor Statistics (BLS) released their monthly unemployment survey results for  May on June 7th. Although Unemployment is still at record lows job creation is less than expected.

According to the U.S. Bureau of Labor Statistics:

The U.S. economy created 75,000 jobs in May and the seasonally adjusted unemployment rate held steady at 3.6 percent. However, economists projected a 175,000 jobs gain and instead only got 75,000 so they were disappointed but that didn’t stop the stock market with the DOW gaining over 1% in a single day.

According to the BLS Commissioner’s report for this month:

“ Nonfarm payroll employment edged up in May (+75,000), and the unemployment rate remained at 3.6 percent.
Employment continued to trend up in professional and business services and in health care… 
In May, 4.4 million people were working part time for economic reasons (also referred to as involuntary part-time workers),
down by 299,000 from the previous month and by 565,000 over the year.”

Key factors in the report were:
Employment in professional and business services increased by 33,000…
Health Care employment rose by 16,000…
Construction employment increased by 4,000…
Seasonally Adjusted U-3 Unemployment remains at its lowest rate since December 1969.

Of course the Commissioner is talking about “Seasonally Adjusted” jobs. In unadjusted terms April had 150.942 million jobs and May had 151.629 million for an actual increase of 687,000 jobs.

For more info see our Current Unemployment Chart and Current U.S. Employment Chart commentary:

Key May Employment and Unemployment Numbers

  • Adjusted U-3 Unemployment-   3.6% unchanged from April
  • Unadjusted U-3 Unemployment-  3.4% up from 3.3% in April but down from 3.9% in March and 4.1% in February, and 4.4% in January.
  • Unadjusted U-6 Unemployment-  6.7% down from 6.9% in April and 7.5% in March, 7.7% in February and 8.8% in January.
  • Unadjusted Employment (Establishment Survey)- 151.629 million up from 150.988 million in April, 149.862 million in March, 149.143 million in February and 148.295 million in January.
  • Labor Force Participation Rate- 62.8% unchanged from April.

Current Seasonally Adjusted U-3 levels are below the 3.8% lows of 2000. Prior to that we have to go all the way back to 1969 to see better unemployment levels than we have currently. If we break below 3.4% we have to go all the way back to 1953 to find lower levels and remember that was during the boom that followed WWII with a massive loss of the workforce due to the war so we probably won’t see levels that low again.

[Read more…] about May Unemployment Still Low

Filed Under: BLS Tagged With: BLS, Bubble, Charts, employment, Sector, U-3, U-6, U-6 Unemployment, unemployment

April Unemployment Lowest since 1969

May 4, 2019 by Tim McMahon

The U.S. Bureau of Labor Statistics (BLS) released their monthly unemployment survey results for April on May 3rd and it is much better than anyone expected.

According to the U.S. Bureau of Labor Statistics:

The U.S. economy created 263,000 jobs in April and the seasonally adjusted unemployment rate dropped to 3.6 percent.

That far exceeded the 180,000 estimated by economists. Last month the economists projected a 175,000 jobs gain and instead got 196,000 for two excellent months in a row.


According to the BLS Commissioner’s report for this month:

“In April, nonfarm payroll employment increased by 263,000, and the unemployment rate declined to 3.6 percent. Over the month, notable job gains occurred in professional and business services, construction, health care, and social assistance. The April employment gain compares with an average monthly gain of 213,000 over the prior 12 months. (The prior 12-month average incorporates revisions for February and March, which increased nonfarm payroll employment by 16,000 on net.)”

Key factors in the report were:
Employment in professional and business services increased by 76,000…
Construction employment rose by 33,000…
Employment in health care increased by 27,000…
Seasonally Adjusted U-3 Unemployment is the lowest rate since December 1969.

Of course the Commissioner is talking about “Seasonally Adjusted” jobs. In unadjusted terms March had 149.862 million jobs while April had 150.988 million jobs for an actual increase of 1,126,000 jobs.

For more info see our Current Unemployment Chart and Current U.S. Employment Chart commentary:

Key April Employment and Unemployment Numbers

  • Adjusted U-3 Unemployment-   3.6% Down from 3.8% in March 
  • Unadjusted U-3 Unemployment-  3.3% down from 3.9% in March and 4.1% in February, and 4.4% in January.
  • Unadjusted U-6 Unemployment-  6.9% down from 7.5% in March, 7.7% in February and 8.8% in January, 7.5% in December.
  • Unadjusted Employment (Establishment Survey)- 150.988 million up from 149.862 million in March, 149.143 million in February and 148.295 million in January.
  • Labor Force Participation Rate- 62.8% down from 63.0% in March and from the peak of 63.2% in February.

Current Seasonally Adjusted U-3 levels are below the 3.8% lows of 2000. Prior to that we have to go all the way back to 1969 to see better unemployment levels than we have currently. If we break below 3.4% we have to go all the way back to 1953 to find lower levels and remember that was during the boom that followed WWII with a massive loss of the workforce due to the war so we probably won’t see levels that low again.

[Read more…] about April Unemployment Lowest since 1969

Filed Under: BLS Tagged With: BLS, employment, Employment by Sector, unemployment

March Unemployment Numbers Celebrated

April 6, 2019 by Tim McMahon

Adjusted U3 UnemploymentThe U.S. Bureau of Labor Statistics (BLS) released their monthly unemployment survey results for March on April 5th and it has the market pundits celebrating. Last month they worried over the mere 20,000 jobs created after projections were for 175,000 jobs.

This month once again the projections were for 175,000 new jobs but the BLS says there were 195,000 new jobs so the market is happy.

As we said in the Current Unemployment Chart commentary:

According to the BLS Commissioner’s report for this month:
“Total nonfarm payroll employment increased by 196,000 in March, and the unemployment rate was unchanged at 3.8 percent, the U.S. Bureau of Labor Statistics reported today. Notable job gains occurred in health care and in professional and technical services… The employment-population ratio was 60.6 percent in March and has been either 60.6 percent or 60.7 percent since October 2018… Health care added 49,000 jobs in March and 398,000 over the past 12 months… Employment in professional and technical services grew by 34,000 in March and 311,000 over the past 12 months. “

Key factors in the report were the unemployment rate for Women dropped to another mega low of 3.3% from 3.6% last month.
Black unemployment was 6.7% and Hispanic Unemployment was 4.7%.

Last month the media was unpleasantly surprised by the Jobs report being lower than the consensus and this month they were pleasantly surprised by the higher than expected jobs. “Economists surveyed by The Wall Street Journal expected that the jobs report would show solid growth by 175,000 jobs”  but instead the report showed 196,000 “Seasonally Adjusted” jobs created, “making March the 102nd straight month of job growth”. In unadjusted terms February had 149.867 million jobs while March had 149.133 million jobs for an actual increase of 724,000 jobs.

Key March Employment and Unemployment Numbers

  • Adjusted U-3 Unemployment-   3.8% unchanged from February but down from 4.0% in January, and 3.9% in December.
  • Unadjusted U-3 Unemployment-  3.9% down from 4.1% in February, and 4.4% in January, but above the 3.7% in December.
  • Unadjusted U-6 Unemployment-  7.5% down from 7.7% in February and 8.8% in January, 7.5% in December.
  • Unadjusted Employment (Establishment Survey)- 149.867 up from 149.143 in February and 148.295 million in January.
  • February Labor Force Participation Rate- 63.0% down from the peak of 63.2% in February, and 63.1% in December.

Current Seasonally Adjusted U-3 levels are still hovering around the lows of 2000. Prior to that we have to go all the way back to 1969 to see better unemployment levels than we have currently. Current levels are rising a bit from a cyclical low not seen since 1969. Also noteworthy is that levels do not stay this low for very long. The longest low like this was the seven month period from October 1968 through April 1969. Prior to 1969 was a one month low of 3.7% in 1957. On the plus side, [Read more…] about March Unemployment Numbers Celebrated

Filed Under: BLS Tagged With: BLS, Bubble Chart, Bureau of Labor Statistics, employment, Employment by Sector, Labor Force, Labor Force Participation, Labor Force Participation Rate, Seasonally Adjusted, U-6, unemployment

February Unemployment- Only 20,000 New Jobs?

March 9, 2019 by Tim McMahon

Unemployment 3.8%The U.S. Bureau of Labor Statistics (BLS) released their monthly unemployment survey results for February on March 8th and it has the market pundits wringing their hands over the mere 20,000 jobs created after projections were for 175,000 jobs. Optimists are blaming the government shutdown combined with the weather causing a lack of construction jobs in the Seasonally Adjusted jobs numbers.

But if job creation is only 20,000 why is Unadjusted U-6 Unemployment down from 8.8% in January to 7.7% in February? Why has the unemployment rate for Hispanics dropped to another mega low of 4.3%? And why is the unemployment rate for Women 3.6%?

The non-seasonally adjusted jobs number is up by 827,000 jobs from January to February compared to an increase of 1.237 million during the same period last year and an increase of 1.03 million from January – February 2017.  So, yes the increase is considerably smaller but as we near full employment it becomes progressively harder to find new employees even if you have jobs available. The problem shifts from a lack of jobs to a lack of qualified employees.

Key February Employment and Unemployment Numbers

  • Adjusted U-3 Unemployment-   3.8% down from 4.0% in January, 3.9% in December and 3.7% in November.
  • Unadjusted U-3 Unemployment-  4.1% down from 4.4% in January, 3.7% in December and 3.5% in November.
  • Unadjusted U-6 Unemployment-  7.7% down from 8.8% in January, 7.5% in December and 7.2% in November.
  • Unadjusted Employment (Establishment Survey)- 149.133 up from 148.201 million in January, 151.190 million in December and 151.244 million in November.
  • February Labor Force Participation Rate- Unchanged at 63.2% up from 63.1% in December and LFPR 62.9% highest since 2013.  
  • 101st straight gain in Seasonally Adjusted Employment- (Household Survey) 156.949 up from 156.694 in January

Current Seasonally Adjusted U-3 levels are hovering around the lows of 2000. Prior to that we have to go all the way back to 1969 to see better unemployment levels than we have currently. Current levels are rising a bit from a cyclical low not seen since 1969. Also noteworthy is that levels do not stay this low for very long. The longest low like this was the seven month period from October 1968 through April 1969. Prior to 1969 was a one month low of 3.7% in 1957. On the plus side, [Read more…] about February Unemployment- Only 20,000 New Jobs?

Filed Under: BLS Tagged With: employment, U-3, U-6, U3, U6, U6 Unemployment, unemployment

  • « Go to Previous Page
  • Page 1
  • Interim pages omitted …
  • Page 5
  • Page 6
  • Page 7
  • Page 8
  • Page 9
  • Interim pages omitted …
  • Page 15
  • Go to Next Page »

Primary Sidebar

Search Site

Sponsored:

URGENT: These Stocks Stand Poised to Benefit from President Trump's Trade Wars!

As the Trump administration moves ahead with aggressive tariff policies on key imports, the mainstream media is scrambling.

This Free Report - which you can download now - reveals the names and ticker symbols of 5 Stock Poised to Benefit Most from President Trump's Tariff Wars.

Click Here to Download Your FREE Stock Report Now.

Recent Posts

  • April 2025 Employment / Unemployment Report
  • Would More Jobs Help Social Security?
  • March 2025- Employment / Unemployment Report
  • February 2025 Jobs Report
  • January 2025 BLS Employment Report

Resources

  • Bureau of Labor Statistics Current Population Survey Monthly survey of households conducted by the Bureau of Census for BLS. It provides data on the labor force, employment, unemployment, etc.
  • Capital Professional Services Providing web design and development and Internet marketing services
  • Elliott Wave University Using the Elliott Wave Principle to improve investment performance
  • Financial Trend Forecaster Featuring Moore Inflation Predictor, NYSE Rate of Change and NASDAQ Rate of change
  • InflationData.com Inflation calculators, databases, etc.
  • Intergalactic Web Designers Web design and development services
  • Your Family Finances

Articles by Category

Articles by Date

Disclaimer

At UnemploymentData.com we are not registered investment advisors and do not provide any individualized advice. Past performance is not necessarily indicative of future performance and future accuracy and profitable results cannot be guaranteed.

Privacy & Terms of Use

Privacy Statement & Terms of Use

Do Not Sell My Information

Copyright © 2025 · News Pro on Capital Professional Services, LLC. All rights reserved · Log in