• About WordPress
    • WordPress.org
    • Documentation
    • Learn WordPress
    • Support
    • Feedback
  • Log In
  • Skip to primary navigation
  • Skip to main content
  • Skip to primary sidebar
  • Home
  • Contact us
  • Related Sites
    • InflationData.com
    • Financial Trend Forecaster
    • Your Family Finances
    • Elliott Wave University
    • Optio Money
  • About
    • Terms of Use
    • Disclaimer & Disclosure
    • Privacy Statement
  • Sitemap
    • 2009-2010 Posts
    • 2011 Posts

UnemploymentData.com

Your Source for Employment and Unemployment Data

Unemployment
  • Charts
    • Current Unemployment Rate Chart
    • Current Employment Rate (Chart and Data)
    • Current Employment vs Unemployment Chart
    • Historical Employment Data
    • Employment Population Ratio
    • Misery Index
  • Unemployment
    • Historical Unemployment Rate Tables
    • What Is U-6 Unemployment?
    • Unadjusted vs. Seasonally Adjusted U-3 Unemployment Rate
    • BLS vs. Gallup Unemployment Numbers
    • Current U-6 Unemployment Rate
    • What is the Labor Force Participation Rate?
    • What is the Real Unemployment Rate?
  • Employment
    • Current Employment Rate (Chart and Data)
    • Historical Employment Data
    • Contacting a Live Person at the State Employment Commission
      • How to Talk to a Live Person at the Virginia Unemployment Commission
      • Florida’s FLUID Unemployment Program
    • Benefits
      • Insurance
      • Retirement
    • Careers
    • Employment Costs
    • Experience
    • Government
    • Job Hunting
      • Interview
      • Resume
  • Find Articles
  • Education
    • Skills
  • General
    • Small Business
      • Outsourcing
    • Success
You are here: Home / Archives for Salary

Salary

February 2023 Unemployment Report

March 11, 2023 by Tim McMahon

The U.S. Bureau of Labor Statistics (BLS) released its employment / unemployment report for February on March 10th 2023.

Employment Up and Unemployment Up? 

Adj U3 Icon 3-6 up


  • Unadjusted Employment rose from 152.836 million to 153.955 million
  • Labor Force Participation rose from 62.4% to 62.5%
  • Adjusted U-3 rose from 3.4% to 3.6%
  • Unadjusted U-3 unchanged at 3.9%
  • Unadjusted U-6 fell from 7.4% to 7.3%


According to the Commissioner of the U.S. Bureau of Labor Statistics:

“Total nonfarm payroll employment rose by 311,000 in February, and the unemployment rate edged up to 3.6 percent, the U.S. Bureau of Labor Statistics reported today. Notable job gains occurred in leisure and hospitality, retail trade, government, and health care. Employment declined in information and in transportation and warehousing.”

You can read the full BLS report here.

As usual, they are talking about “Seasonally Adjusted Jobs”.

Looking at the Unadjusted Establishment Survey report, we see…

Originally the BLS reported employment of 152.844 million for January, which they adjusted down slightly to 152.836 million.

The current estimate for February is 153.955 million which is up 1.11 million from the original number and up 1.12 million from the revised numbers. According to the BLS, this increase didn’t change the unadjusted U-3 number and actually resulted in an increase in unemployment on a seasonally adjusted basis.

ADP® National Employment Report

According to ADP In collaboration with Stanford Digital Economy Lab, private employment was up from January to February by 242,000.

ADP: Private employers added 242,000 jobs in February

Nela Richardson Feb 2023


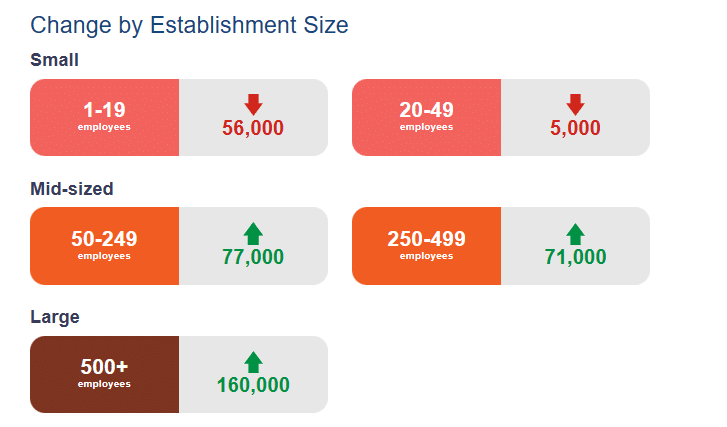
ADP also lists increases by “firm size” and they posted this comment:

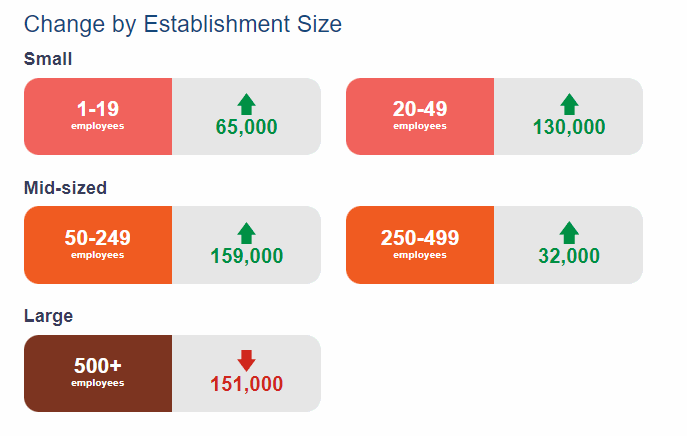
  • Job gains are solid and wage growth remains elevated. A particular area of weakness is with small establishments, which shed jobs every month since August 2022.

But their December report showed small businesses gaining.

December Changes:

ADP Change by Establishment Size

February Changes:


Change by Est Size for Feb 2023

ADP Also Tracks Salary Changes:

[Read more…] about February 2023 Unemployment Report

Filed Under: BLS Tagged With: BLS, Bureau of Labor Statistics, employment, February 2023, Salary, unemployment

Is the Average Worker “Falling Behind”?

July 29, 2022 by Tim McMahon

Wages Up: But are Employees Better Off?

Is the Average Worker Falling Behind/The U.S. Bureau of Labor Statistics released its “Employment Cost Index” report on Friday, July 29th, for the second quarter of 2022.  According to this report, “Wages and salaries increased 5.3 percent for the 12-month period ending in June 2022… Benefit costs increased 4.8 percent over the year.”  This was on top of a 3.2 percent increase in wages for the 12-month period ending in June 2021.

In most recent years, this would be a good thing for employees, but with inflation currently running at over 9% for the year ending in June 2022, workers are actually losing 3.8% in purchasing power. (9.1% inflation minus 5.3% wage increase equals -3.8% purchasing power.) So the answer is that in 2022 workers are NOT better off.

Annual Inflation was 5.4% in June of 2021, so a 3.2% increase in wages left workers 2.2% in the hole last year as well.

The following table shows the annual increase in Total Civilian Compensation (i.e. Wages & Benefits) each June compared to the inflation rate for that year. [Read more…] about Is the Average Worker “Falling Behind”?

Filed Under: Benefits Tagged With: 2022, Average Worker, Falling Behind, Real Wages, Salary

Deciding Which Engineering Degree is Right for You

June 4, 2017 by Tim McMahon

If you think you’d like to become an engineer but aren’t sure which program is right for you there are several factors that you should consider. Often High School graduates only think about how much money they can earn and forget that there is much more to a job than that. You don’t want to spend the next 30 -40 years doing something you don’t enjoy so it is important to look at what the job entails and the environment it is done in. Some engineers spend a lot of time in the field on a job site… others spend their time in an office. Some work with their hands while others work on computers or with chemicals. And finally you have to consider job availability no matter how much you enjoy designing horse saddles if there isn’t much demand for horse saddle engineers you probably won’t be able to find a job doing it.

EngineerIn the table below we have compiled information from the U.S. Bureau of Labor Statistics (BLS) on various fields of engineering, median annual salary, job growth and a basic description of what the position entails. [Read more…] about Deciding Which Engineering Degree is Right for You

Filed Under: Education Tagged With: college, engineering, Growth prospects, job, Position, Salary

Wages Flat Since Last Year but Depend Upon Education

July 26, 2014 by Tim McMahon

Median Salaries Unchanged from Year Ago

According to the current Bureau of Labor Statistics (BLS ) news release on weekly earnings for the second quarter of 2014, the median weekly earnings for a full-time worker was $780 virtually unchanged from year ago levels. The median wage indicates that the same number of people earned more than $780 as earned less working a full-time job.

The data was collected as part of the Current Population Survey, a nationwide sample survey of households conducted by the BLS.

Wages By Education

Wages vary based on a variety of factors including experience but education played a major factor. Full-time workers age 25 and over without a high school diploma had median weekly earnings of only $492. Assuming an average 40 hour work week that would be an average of $12.30/hr. High school graduates with no college earned an average of $666 per week, those with a Bachelors Degree earned an average of $1098 while those with advanced degrees earned an average of $1,377.  [Read more…] about Wages Flat Since Last Year but Depend Upon Education

Filed Under: Education Tagged With: education, Salary

How Much Does a Brick Mason Earn?

February 14, 2013 by Jorgen Rex Olson

Brick Mason Salary

While being among the highest paid trades in the construction industry, brick masons’ wages have been stagnant over recent years due to the slump in the housing industry.

Although their numbers constitute a rather small category within the group of trades making up the construction industry, brick masons do very well in comparison to their colleagues. According to the U.S. Bureau of Labor Statistics, as of May 2011 the mean or average income for a brick mason was $54,210 annually or about $27.04 per hour. This puts them only just below the first-line construction supervisors averaging $59,280 per year or $28.50 hourly. Compare this with their Construction Laborer colleagues earning $26,490 per year and you have a significant wage disparity. Brick masons also do very well in comparison to the technical trades. The mean incomes for electricians, plumbers and heating tradespeople during 2011 were $41,860, $44,330 and $38,470 respectively, or, on average, 23% less than for brick masons.

Construction is Picking Up

Brick Mason SalaryConsidering the recent increase in activity for both residential and commercial construction, all of the building trades, and especially brick masons, have reason to celebrate. The Bureau of Labor Statistics is predicting a 40 percent increase in employment for the bricklaying trade during the ten-year period beginning 2010 through 2020. This compares with only a 14 percent increase for all occupations combined. Given this sudden growth in demand for additional bricklaying capacity, it seems inevitable that wages are bound to rise – or are they? During the single year from May 2010 to May 2011, the median annual income for Brick Masons actually dropped from $46,930 to $46,800; less than 1 percent but still a decrease. The median is that number at which half of the reported wages fall above and the other half is below.

Annual Wages for Brick Masons

Year — Median Income

2002 — $41,840

2003 — $41,550

2004 — $41,740

2005 — $41,860

2006 — $42,980

2007 — $44,070

2008 — $45,630

2009 — $46,740

2010 — $46,930

2011 — $46,800

It is clear from the data, that [Read more…] about How Much Does a Brick Mason Earn?

Filed Under: Careers Tagged With: Brick Mason, Construction, Earnings, Salary, Trades

Primary Sidebar

Search Site

Sponsored:

URGENT: These Stocks Stand Poised to Benefit from President Trump's Trade Wars!

As the Trump administration moves ahead with aggressive tariff policies on key imports, the mainstream media is scrambling.

This Free Report - which you can download now - reveals the names and ticker symbols of 5 Stock Poised to Benefit Most from President Trump's Tariff Wars.

Click Here to Download Your FREE Stock Report Now.

Recent Posts

  • April 2025 Employment / Unemployment Report
  • Would More Jobs Help Social Security?
  • March 2025- Employment / Unemployment Report
  • February 2025 Jobs Report
  • January 2025 BLS Employment Report

Resources

  • Bureau of Labor Statistics Current Population Survey Monthly survey of households conducted by the Bureau of Census for BLS. It provides data on the labor force, employment, unemployment, etc.
  • Capital Professional Services Providing web design and development and Internet marketing services
  • Elliott Wave University Using the Elliott Wave Principle to improve investment performance
  • Financial Trend Forecaster Featuring Moore Inflation Predictor, NYSE Rate of Change and NASDAQ Rate of change
  • InflationData.com Inflation calculators, databases, etc.
  • Intergalactic Web Designers Web design and development services
  • Your Family Finances

Articles by Category

Articles by Date

Disclaimer

At UnemploymentData.com we are not registered investment advisors and do not provide any individualized advice. Past performance is not necessarily indicative of future performance and future accuracy and profitable results cannot be guaranteed.

Privacy & Terms of Use

Privacy Statement & Terms of Use

Do Not Sell My Information

Copyright © 2025 · News Pro on Capital Professional Services, LLC. All rights reserved · Log in