• About WordPress
    • WordPress.org
    • Documentation
    • Learn WordPress
    • Support
    • Feedback
  • Log In
  • Skip to primary navigation
  • Skip to main content
  • Skip to primary sidebar
  • Home
  • Contact us
  • Related Sites
    • InflationData.com
    • Financial Trend Forecaster
    • Your Family Finances
    • Elliott Wave University
    • Optio Money
  • About
    • Terms of Use
    • Disclaimer & Disclosure
    • Privacy Statement
  • Sitemap
    • 2009-2010 Posts
    • 2011 Posts

UnemploymentData.com

Your Source for Employment and Unemployment Data

Unemployment
  • Charts
    • Current Unemployment Rate Chart
    • Current Employment Rate (Chart and Data)
    • Current Employment vs Unemployment Chart
    • Historical Employment Data
    • Employment Population Ratio
    • Misery Index
  • Unemployment
    • Historical Unemployment Rate Tables
    • What Is U-6 Unemployment?
    • Unadjusted vs. Seasonally Adjusted U-3 Unemployment Rate
    • BLS vs. Gallup Unemployment Numbers
    • Current U-6 Unemployment Rate
    • What is the Labor Force Participation Rate?
    • What is the Real Unemployment Rate?
  • Employment
    • Current Employment Rate (Chart and Data)
    • Historical Employment Data
    • Contacting a Live Person at the State Employment Commission
      • How to Talk to a Live Person at the Virginia Unemployment Commission
      • Florida’s FLUID Unemployment Program
    • Benefits
      • Insurance
      • Retirement
    • Careers
    • Employment Costs
    • Experience
    • Government
    • Job Hunting
      • Interview
      • Resume
  • Find Articles
  • Education
    • Skills
  • General
    • Small Business
      • Outsourcing
    • Success
You are here: Home / Archives for Unemployment

Unemployment

Coronavirus Skyrockets March Unemployment

April 4, 2020 by Tim McMahon

Seasonally Adjusted U3 Unemployment

The U.S. Bureau of Labor Statistics (BLS) released its employment / unemployment report for March on April 3rd.

COVID-19 Shutdowns Send Unemployment Rate Soaring

The BLS commissioner emphasized that even though the numbers are collected mid-month and the massive shutdown had just begun it was already having detrimental effects on the unemployment rate and we can expect worse to come.

  • Unadjusted U-3 was Up from 3.8% to 4.5%!
  • Adjusted U-3 was Up from 3.5% to 4.4%!
  • Unadjusted U-6 was Up from 7.4% to 8.9%!
  • Labor Force Participation fell from 63.4% to 62.7%.
  • Unadjusted Employment down by approx. 193,000 jobs.

According to the Commissioner of the U.S. Bureau of Labor Statistics:

“Nonfarm payroll employment declined by 701,000 in March, and the unemployment rate increased to 4.4 percent, reflecting the broad impact on the job market of the coronavirus (COVID-19) and efforts to contain the illness. Employment fell by 459,000 in the leisure and hospitality industry, mainly in food services and drinking places. Notable employment decreases also occurred in health care and social assistance, professional and business services, retail trade, and construction.

It is important to keep in mind that the March survey reference periods for the establishment and household surveys (the pay period or week, respectively, that includes the 12th of the month) predated many business and school closures that occurred in the second half of the month. In addition, data collection for the two surveys was affected by the coronavirus.

Although response rates for both surveys were adversely affected by pandemic-related issues, we still were able to obtain estimates from our two surveys that met BLS standards for accuracy and reliability.”

Of course, he is talking about “Seasonally Adjusted Jobs” from the “Current Population Survey (CPS)”
rather than looking at the results reported by actual companies in their “Current Employment Statistics survey (CES)”

But looking at the CES report we see…
Originally the BLS reported 150.997 million jobs for February and then they added 58,000 jobs to that estimate.
So currently they are saying 151.055 million jobs for February and 150.804 million jobs for March
which is actually a decrease of 193,000 jobs compared to what they originally reported last month. [Read more…] about Coronavirus Skyrockets March Unemployment

Filed Under: BLS, Employment, Unemployment Tagged With: Coronavirus, COVID-19, Employed Part-Time for Economic Reasons, Layoffs, Teenage Unemployment, U1-U6, unemployment

Comparing U.S. and European Unemployment Rates

February 17, 2020 by Tim McMahon

Often we get complacent and think that our situation is the same (or very similar to) other developed countries. But that is not always the case. Today we are going to look at how the unemployment rate in the U.S. compares to that of Europe.

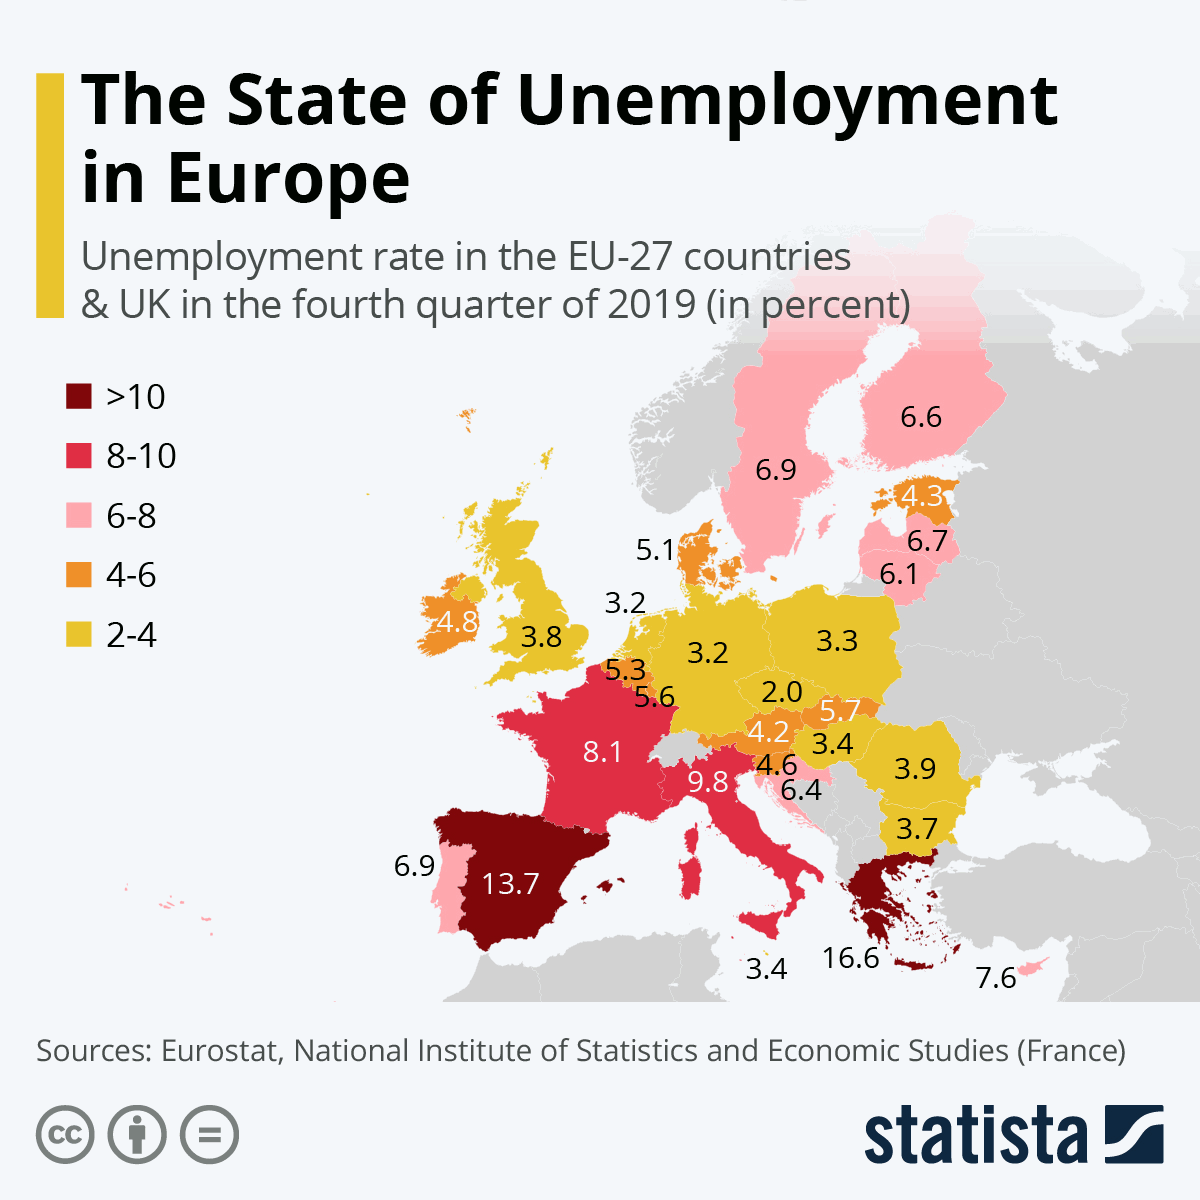
In the following chart created by Statista from data supplied by “Eurostat” and “National Institute of Statistics and Economic Studies (France)” we can see that Europe itself is not one unified block with identical (or even similar) unemployment rates.

Comparing US and European Unemployment Rates

The data in this graphic is from the end of 2019 when unemployment rates in the United States were at 3.5%. We can see that the countries in yellow had comparable unemployment rates to the U.S. i.e.  Germany, Poland, and the Netherlands. Britain, Romania, and Bulgaria were in the high 3’s with the surprise being the Czech Republic coming in at a scant 2.0%. According to an article in The Atlantic, the 2017 elections decimated the “Left and Center” leaving the moderate right and the anti-immigrant far-right. So we are free to conclude that without the influx of cheap labor from Northern Africa, that all of the rest of Europe welcomed with open arms,  the Czech Republic has record low unemployment as only native Czech’s are competing for the jobs.

One of the other surprises is that [Read more…] about Comparing U.S. and European Unemployment Rates

Filed Under: Unemployment Tagged With: Bureaucracy, Efficiency, Europe, taxes, U.S., unemployment

Things You Need to Do Quickly if You’re Unemployed

September 20, 2019 by Guest Contributor

Losing a job is never a good feeling, whether or not you saw it coming ahead of time. However, regardless of why you are no longer employed, it is important that you take action to protect yourself and your family until you find work again. Depending on your age, a job loss may be the perfect time to start thinking about retiring, and collecting Social Security or looking for part-time work. No matter what direction you choose after losing your job, here are some important things you need to do.

File for Unemployment

As we said in Stretch Your Dollars While Between Jobs filing for unemployment should be the first thing you do if you become unemployed through no fault of your own even if you think your unemployment will be short-lived. After all, any extra money you can pick up will be useful while you are unemployed. If you are eligible for Social Security you may want to sign up for that instead. Legal professionals may be able to help with your case. This video explains some factors in choosing when to file for Social Security. It says that if you have the option of filing for Social Security Disability or Social Security retirement benefits you are much better off filing for the disability benefit. This is because disability will be 100% of your benefit while if you are filing early for Social Security your benefit will be reduced.

Alert Your Creditors

If you think there is any possibility that you won’t be able to make the payments on your debts it is important that your creditors know that before you fail to make credit card, car, or other payments. It may be possible to make alternate arrangements to stay current on your debt balances. [Read more…] about Things You Need to Do Quickly if You’re Unemployed

Filed Under: Unemployment Tagged With: career, health insurance, Social Security, unemployment

Stretch Your Dollars While Between Jobs

September 7, 2019 by Tim McMahon

Being in between jobs can have you worrying about how you’re going to pay your bills. Fortunately, there are ways to stretch your dollar so that you can sustain yourself financially until you can find more work. These tips can help you preserve your finances while in between jobs.

File for Unemployment

It seems unemployment always lasts longer than you think so, the first step when you become unemployed is to always file for unemployment if you are eligible (even if you think you will only be unemployed for a short time). Remember there is processing time before your benefits start and if you wait too long you might miss out on some benefits. Also,  be sure to keep up with your paperwork so you don’t miss some benefits during your unemployment. These days you will probably be able to file online so the process should be relatively quick and painless. However, if you have a special situation you may have to call or visit your local unemployment office. Be sure to check to see how much your state allows you to earn and still be eligible to receive unemployment.  Then you can consider picking up some side gigs.

  • Side Hustle—4 Unique Ways to Make Some Extra Money
  • Make Extra Cash with a “Side-Hustle”

Cut Expenses to the Bone

Generally, unemployment benefits don’t equal your previous salary so [Read more…] about Stretch Your Dollars While Between Jobs

Filed Under: Unemployment Tagged With: Expenses, finances, Money, side gig, side hustle, unemployment benefits

Unemployment By State and Political Party

July 19, 2019 by Tim McMahon

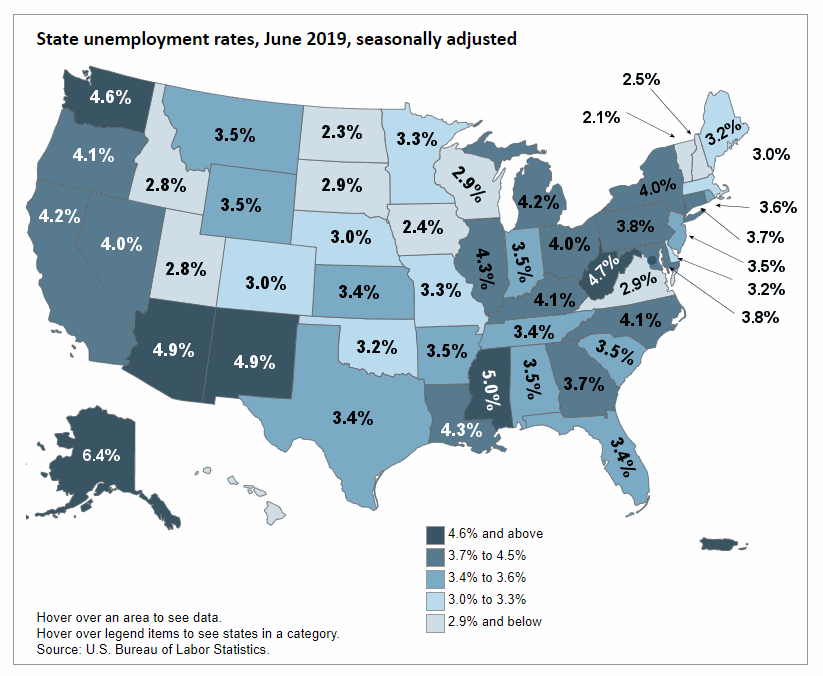
Unemployment rates were lower in June in 6 states and stable in 44 states and the District of Columbia, the U.S. Bureau of Labor Statistics reported today. Three states had jobless rate decreases from a year earlier and 47 states and the District had little or no change.

Vermont had the lowest unemployment rate in June, 2.1 percent. The rates in Alabama (3.5 percent), Arkansas (3.5 percent), New Jersey (3.5 percent), and Texas (3.4 percent) set new series lows. (All state series begin in 1976.) Alaska and Puerto Rico had the highest jobless rates, at 6.4 and 8.4 percent respectively. In total, 13 states had unemployment rates lower than the U.S. figure of 3.7 percent, 9 states and the District of Columbia had higher rates, and 28 states had rates that were not appreciably different from that of the nation.

State Unemployment Rates

Table of U.S. State Political Party statistics as of January 2019

I’ve sorted the following table by political party. If we look at it this way, we can see that [Read more…] about Unemployment By State and Political Party

Filed Under: Unemployment Tagged With: Democrat, Republican, State, unemployment

Unemployment and Employment Charts

January 1, 2019 by Tim McMahon

  • Unemployment Rate Chart – The seasonally adjusted unemployment rate from 1948 to the present is one of the most watched statistics. Where is it now and should you trust it?
  • Current U-6 Unemployment Rate– Many people consider the U-6 the “real” unemployment rate. See where it is now.
  • Current Employment Data – How many jobs are there actually? This chart shows Employment since Jan 2000 and what the current trend is.
  • Historical Employment Data Chart– How Many People Are Actually Employed? This chart shows the actual employment rate without all the mumbo-jumbo. It gives a clear picture of  the employment level in the United States from 1939 to the Present. When employment is rising the economy is growing. When the employment rate levels off or declines times are not so good. Take a look and see how employment rates correspond to recessions over time.
  • Current Employment vs Unemployment Chart When looking at employment vs. unemployment you would think that they are two sides of the same coin but the U.S. Bureau of Labor Statistics (BLS) actually uses two entirely different surveys to calculate them. Looking at both on the same chart we can see some strange anomalies.
  • Misery Index– Created by economist Arthur Okun to help gauge the level of misery the average person is suffering. It is a combination of the inflation rate and the unemployment rate.
  • Unadjusted vs. Seasonally Adjusted Unemployment Rate– Often it appears that the Seasonally Adjusted numbers are going one way, while the unadjusted numbers are going in the opposite direction. Here is how it looks in chart form.
  • Seasonally Adjusted Unemployment Rate in Table form– If you want to see the actual numbers.
  • Is the Government Fudging Unemployment Numbers? Now there is an alternative measurement. We can also see a discrepancy in the Government’s own numbers by looking at the Employment vs. UnEmployment rate.
  • U-6 is the broadest measure of unemployment and includes all classes of Unemployed plus those ”marginally attached” and/or part-time for economic reasons. See What is the U-6 Unemployment Rate? for more details of all the “U” classifications.
  • What is the “Real” Unemployment Rate? Many economists believe that the popularly quoted Unemployment Rate understates the real unemployment rate because it fails to include workers who would like to work but have given up looking because they don’t think there are any jobs available for them.
  • What is the Labor Force Participation Rate? You might think that the Labor Force Participation Rate [LFPR] would mean the percentage of the population that is working but it doesn’t mean that at all. According to the Bureau of Labor Statistics the “Labor Force” is made up of both employed and unemployed people.  Unemployed people are defined as those who are actively looking for work. Once you stop looking (i.e discouraged workers) you are no longer in the official labor force.


Filed Under: Featured, Unemployment Tagged With: employment rate, employment rate chart, unemployment, unemployment rate, unemployment rate chart

Key July Employment and Unemployment Numbers

August 4, 2018 by Tim McMahon

U-3 Unemployment 3.9%The U.S. Bureau of Labor Statistics (BLS) released their monthly employment survey results for the month of July on Friday August 3rd .

The current “Seasonally Adjusted” Unemployment Rate for July (released August 3rd) is 3.9% down from 4.0% last month. It was 3.8% in May and 3.9% in April. Unemployment was  4.1% from October 2017 through March 2018. Seasonally adjusted unemployment bounced around between 4.3% and 4.4% from April through October 2017, after declining from 4.8% in January 2017.

Typically Unemployment levels are worse in June and July so seasonally adjusting takes that into consideration. If we look at Unadjusted Unemployment we see that in 2017 it jumped from 4.1% in May to 4.5% in June at the same time the Seasonally Adjusted numbers simply went from 4.3% to 4.4%.

Key July Employment and Unemployment Numbers

  • Adjusted U-3 Unemployment-   3.9% down from 4.0% in June but up from the 3.8% in May, 3.9% in April but still Below the 4.1% October – March.
  • Unadjusted U-3 Unemployment-  4.1% down from 4.2% in June up from 3.6% in May, 3.7% in April and  4.1% in March.
  • Unadjusted U-6 Unemployment-   7.9% down from 8.1% in June, up from 7.3% in May, 7.4% in April and from 8.1% in March and 8.6% in February.
  • Employment 148.901 million. BLS adjusted June employment up from 148.912 million as released to 150.057 million.
  • NOTE: On 8/3/2018 with the release of the new July numbers the BLS adjusted the June LFPR down to 62.9% from a recent high of 63.4%

See Current Unemployment Chart for more info.

Employment by Sector

The employment “bubble chart” gives us a good representation of how each sector of the economy is doing (employment wise). As we can see from the chart below [Read more…] about Key July Employment and Unemployment Numbers

Filed Under: Unemployment Tagged With: employment, Employment / Population Ratio, Employment by Sector, Labor Force, LFPR, Participation Rate, unemployment

California at 4.3% has Lowest Unemployment Since 1976

March 27, 2018 by Tim McMahon

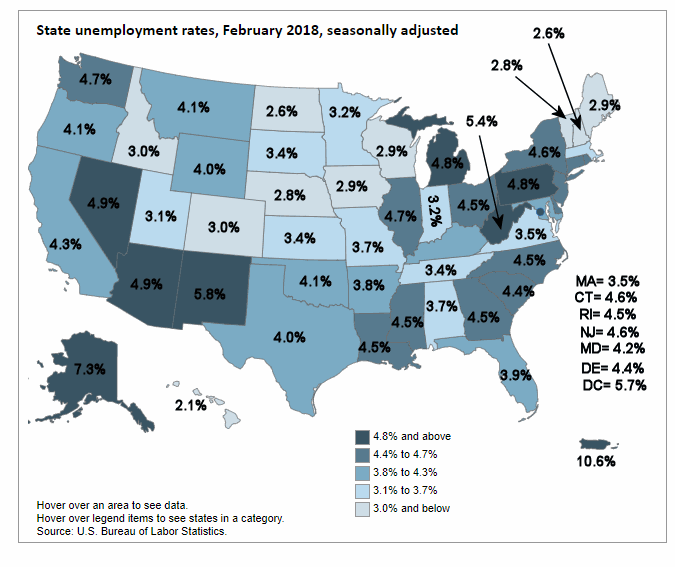
According to the U.S. Bureau of Labor Statistics’ most recent unemployment data broken down by state (released in March for the month of February), Hawaii had the lowest unemployment at 2.1% followed by  North Dakota and New Hampshire at 2.6%. Vermont and Nebraska were also at 2.8%.

The rates in California (4.3%), Maine (2.9%), Mississippi (4.5%), and Wisconsin (2.9%) set new series lows. (All state series begin in 1976.)

Although not technically a state, Puerto Rico had the highest jobless rate at 10.6% followed by Alaska at 7.3% while New Mexico had 5.8%,  the District of Columbia had 5.7% and West Virginia had 5.4%.


February Unemployment by state


The following table lists the  [Read more…] about California at 4.3% has Lowest Unemployment Since 1976

Filed Under: Unemployment Tagged With: state unemployment rates, unemployment

Unemployment By State

January 18, 2018 by Tim McMahon

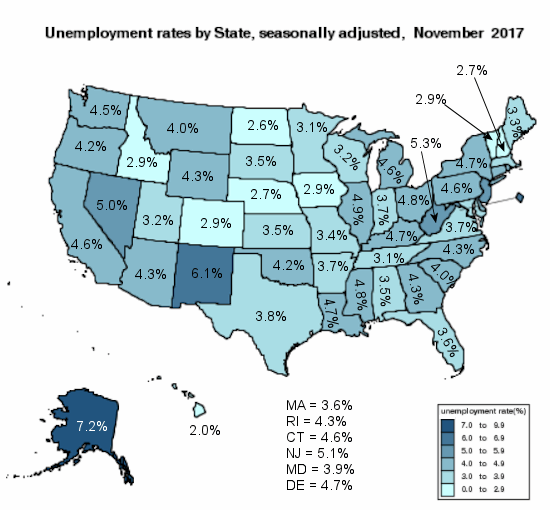
According to the U.S. Bureau of Labor Statistics’ most recent data broken down by state (released in December for the month of November), Hawaii had the lowest unemployment at 2.0% followed by several Western States including North Dakota (2.6%), Nebraska (2.7%), Colorado, Idaho and Iowa all at 2.9%.  Somehow New Hampshire managed to also be among the lowest also at 2.7% with Vermont at 2.9%.

Although California has been touted as having the fastest growing labor force it ranked number 35 in unemployment rates with unemployment at 4.6% well below the national average of 4.1%.

Unemployment by State

The following table lists the  [Read more…] about Unemployment By State

Filed Under: Unemployment Tagged With: State, Unemployment by State, unemployment rate

What You Can do When Your Unemployment Benefits are Denied

October 31, 2017 by Guest Contributor

DeniedBenefits denied!

That’s the last thing you want to hear after losing your job and applying for unemployment benefits. But, don’t give up! There’s still hope, thanks mainly to the appeal process.

Reasons for Denial

There are several valid reasons for denial of benefits, including:

  • Voluntarily leaving the workplace without just cause
  • Being discharged for work misconduct
  • Not being able or available for work
  • Refusing an offer of suitable work
  • Knowingly making false statements to obtain benefits

If you don’t agree with the reason provided for the denial of unemployment benefits, you can appeal the decision. So, how exactly do you appeal a denial of unemployment benefits?

Act Fast

Time is key in the appeal process. Depending on the state’s requirements, you have somewhere between 10 and 30 days to request an appeal. Unemployment agencies are sticklers for timeframes so missing a deadline without good reason will not help your chances.

It’s OK to go Pro Se

You don’t have to hire an attorney to [Read more…] about What You Can do When Your Unemployment Benefits are Denied

Filed Under: Unemployment Tagged With: Case, Denied, Hearing, Judge, Lawyer, unemployment

  • « Go to Previous Page
  • Page 1
  • Page 2
  • Page 3
  • Page 4
  • Interim pages omitted …
  • Page 9
  • Go to Next Page »

Primary Sidebar

Search Site

Sponsored:

URGENT: These Stocks Stand Poised to Benefit from President Trump's Trade Wars!

As the Trump administration moves ahead with aggressive tariff policies on key imports, the mainstream media is scrambling.

This Free Report - which you can download now - reveals the names and ticker symbols of 5 Stock Poised to Benefit Most from President Trump's Tariff Wars.

Click Here to Download Your FREE Stock Report Now.

Recent Posts

  • April 2025 Employment / Unemployment Report
  • Would More Jobs Help Social Security?
  • March 2025- Employment / Unemployment Report
  • February 2025 Jobs Report
  • January 2025 BLS Employment Report

Resources

  • Bureau of Labor Statistics Current Population Survey Monthly survey of households conducted by the Bureau of Census for BLS. It provides data on the labor force, employment, unemployment, etc.
  • Capital Professional Services Providing web design and development and Internet marketing services
  • Elliott Wave University Using the Elliott Wave Principle to improve investment performance
  • Financial Trend Forecaster Featuring Moore Inflation Predictor, NYSE Rate of Change and NASDAQ Rate of change
  • InflationData.com Inflation calculators, databases, etc.
  • Intergalactic Web Designers Web design and development services
  • Your Family Finances

Articles by Category

Articles by Date

Disclaimer

At UnemploymentData.com we are not registered investment advisors and do not provide any individualized advice. Past performance is not necessarily indicative of future performance and future accuracy and profitable results cannot be guaranteed.

Privacy & Terms of Use

Privacy Statement & Terms of Use

Do Not Sell My Information

Copyright © 2025 · News Pro on Capital Professional Services, LLC. All rights reserved · Log in