![]() The U.S. Bureau of Labor Statistics (BLS) released their monthly unemployment survey results for January on February 1st. “Seasonally Adjusted” Unemployment U-3 is 4.0% up from 3.9% in December. Unadjusted U-3 was 4.4% up from 3.7% in December and 3.5% in November.
The U.S. Bureau of Labor Statistics (BLS) released their monthly unemployment survey results for January on February 1st. “Seasonally Adjusted” Unemployment U-3 is 4.0% up from 3.9% in December. Unadjusted U-3 was 4.4% up from 3.7% in December and 3.5% in November.
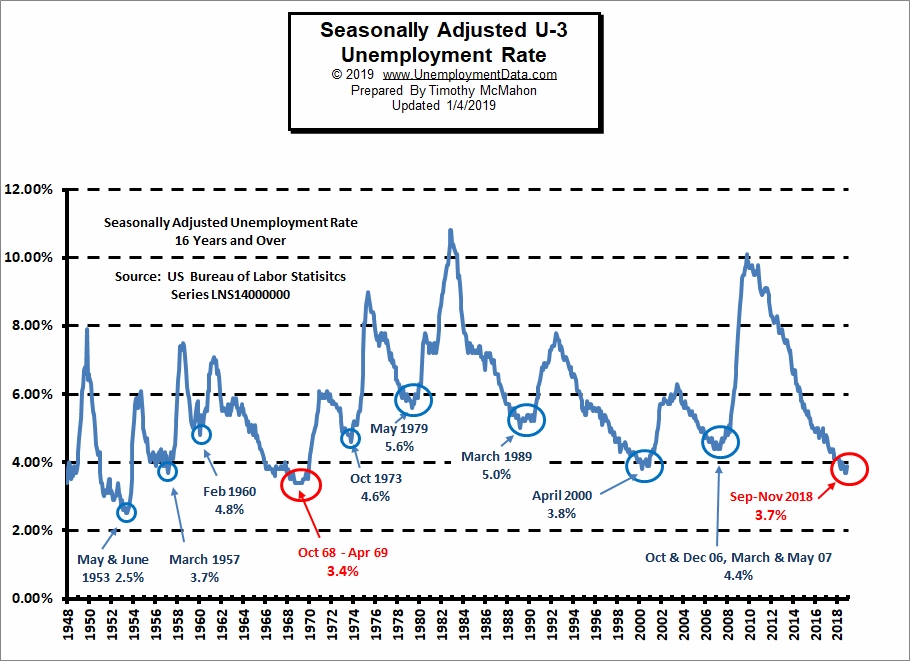
Looking back, Seasonally Adjusted U-3 started 2017 at 4.8% then it bounced around between 4.3% and 4.4% from April through October 2017, then it stayed at 4.1% from October 2017 through March 2018. It bounced between 3.8% and 4.0% from April through August 2018 before falling to 3.7% in September – November. So unemployment is currently at the same level as it was from April through August 2018.
Key January Employment and Unemployment Numbers
- Adjusted U-3 Unemployment- 4.0% up from 3.9% in December and 3.7% in November.
- Unadjusted U-3 Unemployment- 4.4% up from 3.7% in December and 3.5% in November.
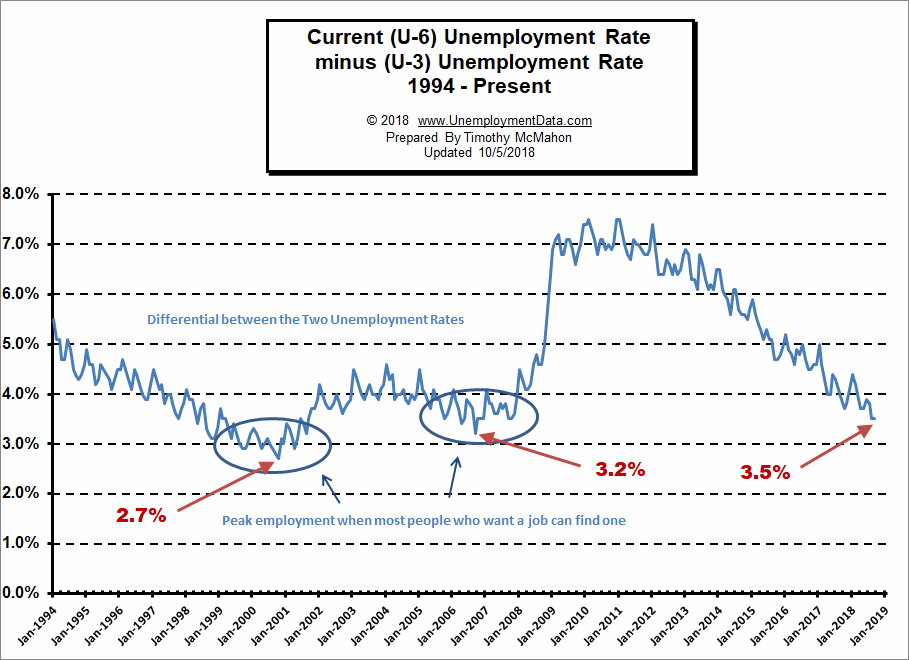
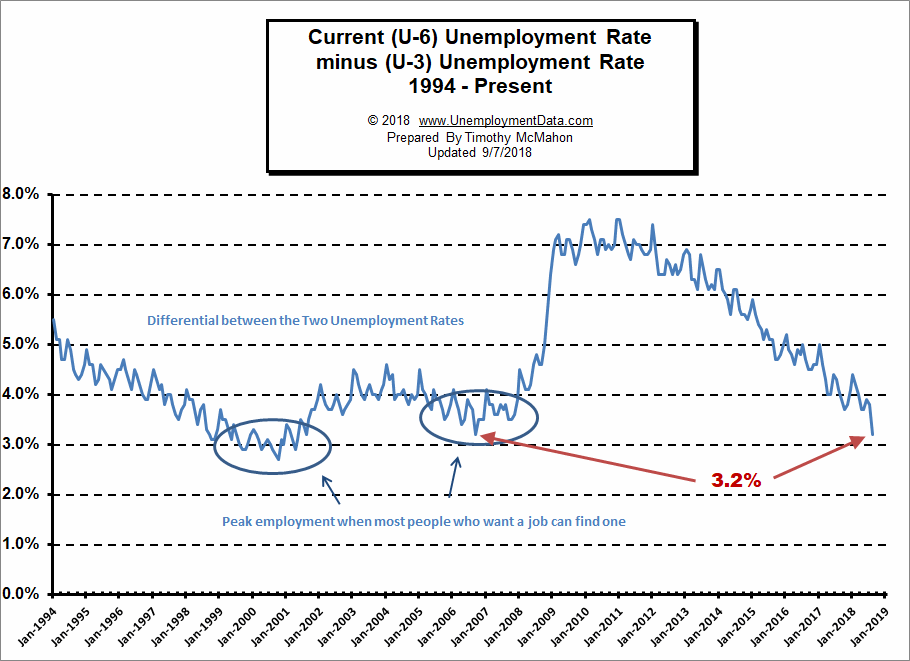
- Unadjusted U-6 Unemployment- 8.8% up from 7.5% in December and 7.2% in November.
- Unadjusted Employment- 148.201 million down from 151.190 million in December and 151.244 million in November.
- January Labor Force Participation Rate- 63.2% up from 63.1% in December and LFPR 62.9%.
- 100th straight gain in Seasonally Adjusted Employment
As I have been saying for a while [Read more…] about January Employment the Good and Bad