The U.S. Bureau of Labor Statistics (BLS) released its employment / unemployment report for April on May 2nd, 2025.
Employment / Unemployment
![]()
- Seasonally Adjusted U3- 4.2% Unchanged
- Unadjusted U3- 3.9% Down from 4.2% in March
- Unadjusted U6- 7.3% Down from 7.9% in March
- Labor Force Participation Rate- 62.6% Up from 62.5%
- Employment- 159.316 million Up from 158.411 million
- Next data release June 6th, 2025
Summary:
Total Employed increased in April, Unadjusted Unemployment was down, but Seasonally adjusted Unemployment remained the same.
According to the Commissioner of the U.S. Bureau of Labor Statistics:
“Total nonfarm payroll employment increased by 177,000 in April, and the unemployment rate was unchanged at 4.2 percent, the U.S. Bureau of Labor Statistics reported today. Employment continued to trend up in health care, transportation and warehousing, financial activities, and social assistance. Federal government employment declined…
Health care added 51,000 jobs in April, about the same as the average monthly gain of 52,000 over the prior 12 months. In April, job growth continued in hospitals (+22,000) and ambulatory health care services (+21,000)…
Employment in transportation and warehousing increased by 29,000 in April…
Financial activities employment continued to trend up (+14,000)…
Employment in social assistance continued its upward trend in April (+8,000) but at a slower pace than the average monthly gain over the prior 12 months (+20,000).
Within government, federal government employment declined by 9,000 in April and is down by 26,000 since January. (Employees on paid leave or receiving ongoing severance pay are counted as employed in the establishment survey.)”
You can read the full BLS report here.
As usual, they are talking about “Seasonally Adjusted Jobs”.
Looking at the Unadjusted Establishment Survey report we see…
Originally, the BLS reported employment of 158.506 million for March which they adjusted slightly to 158.411 million in April.
They are currently reporting 159.316 million jobs for April which is actually an increase of 810,000 jobs. Based on their original numbers.
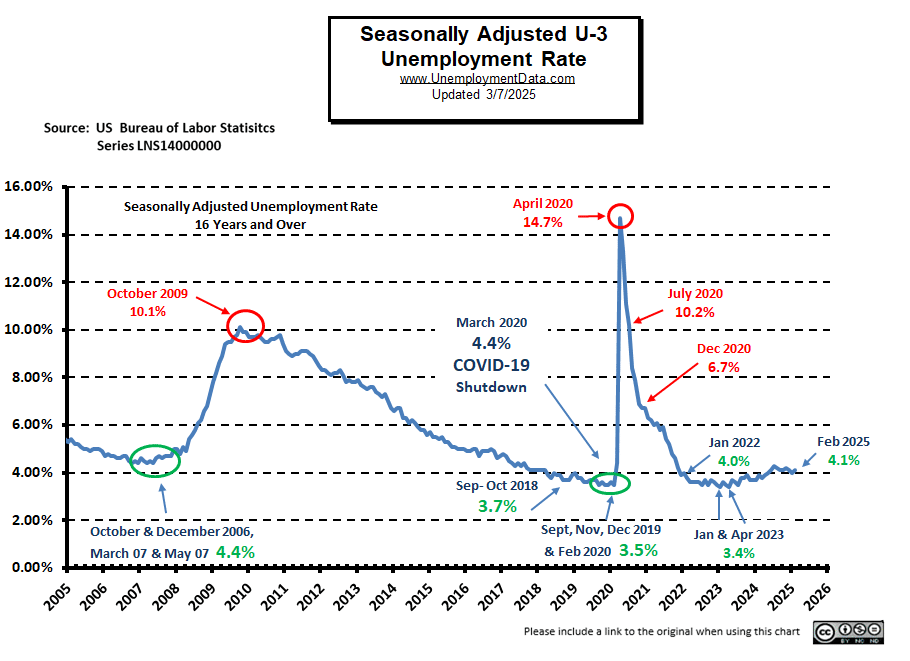
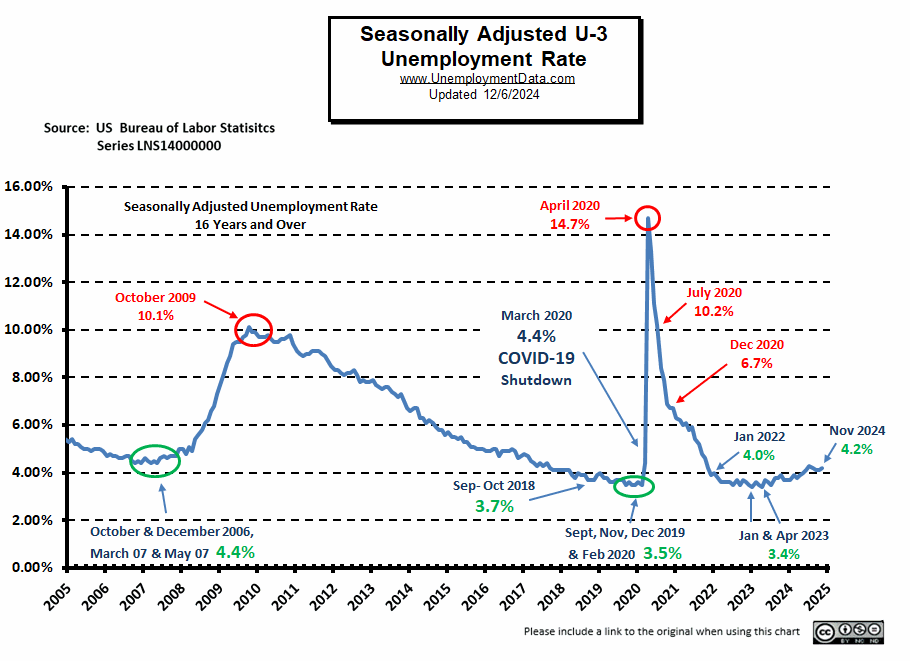
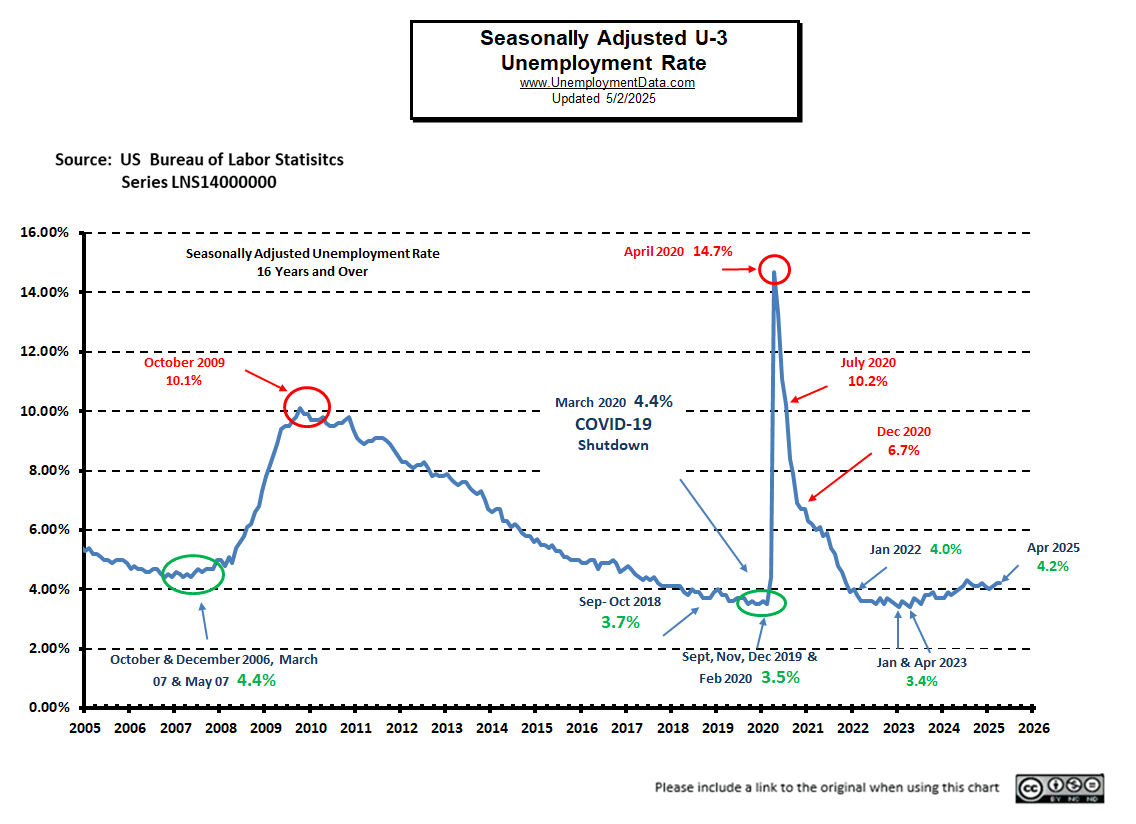
Current Unemployment Rate Chart
As we can see, unemployment is 0.7% above pre-COVID lows of 2019 and 0.8% above the January and April lows of 2023.
 [Read more…] about April 2025 Employment / Unemployment Report