• About WordPress
    • WordPress.org
    • Documentation
    • Learn WordPress
    • Support
    • Feedback
  • Log In
  • Skip to primary navigation
  • Skip to main content
  • Skip to primary sidebar
  • Home
  • Contact us
  • Related Sites
    • InflationData.com
    • Financial Trend Forecaster
    • Your Family Finances
    • Elliott Wave University
    • Optio Money
  • About
    • Terms of Use
    • Disclaimer & Disclosure
    • Privacy Statement
  • Sitemap
    • 2009-2010 Posts
    • 2011 Posts

UnemploymentData.com

Your Source for Employment and Unemployment Data

Unemployment
  • Charts
    • Current Unemployment Rate Chart
    • Current Employment (Chart and Data)
    • Current Employment vs Unemployment Chart
    • Historical Employment Data
    • Employment Population Ratio
    • Misery Index
  • Unemployment
    • Historical Unemployment Rate Tables
    • What Is U-6 Unemployment?
    • Unadjusted vs. Seasonally Adjusted U-3 Unemployment Rate
    • BLS vs. Gallup Unemployment Numbers
    • Current U-6 Unemployment Rate
    • What is the Labor Force Participation Rate?
    • What is the Real Unemployment Rate?
  • Employment
    • Current Employment (Chart and Data)
    • Historical Employment Data
    • Contacting a Live Person at the State Employment Commission
      • How to Talk to a Live Person at the Virginia Unemployment Commission
      • Florida’s FLUID Unemployment Program
    • Benefits
      • Insurance
      • Retirement
    • Careers
    • Employment Costs
    • Experience
    • Government
    • Job Hunting
      • Interview
      • Resume
  • Find Articles
  • Education
    • Skills
  • General
    • Small Business
      • Outsourcing
    • Success
You are here: Home / Archives for BLS

BLS

February Employment Report for January 2026

February 12, 2026 by Tim McMahon Leave a Comment

The U.S. Bureau of Labor Statistics (BLS) released its delayed January
employment / unemployment report
on February 11th, 2026.

Employment / Unemployment 

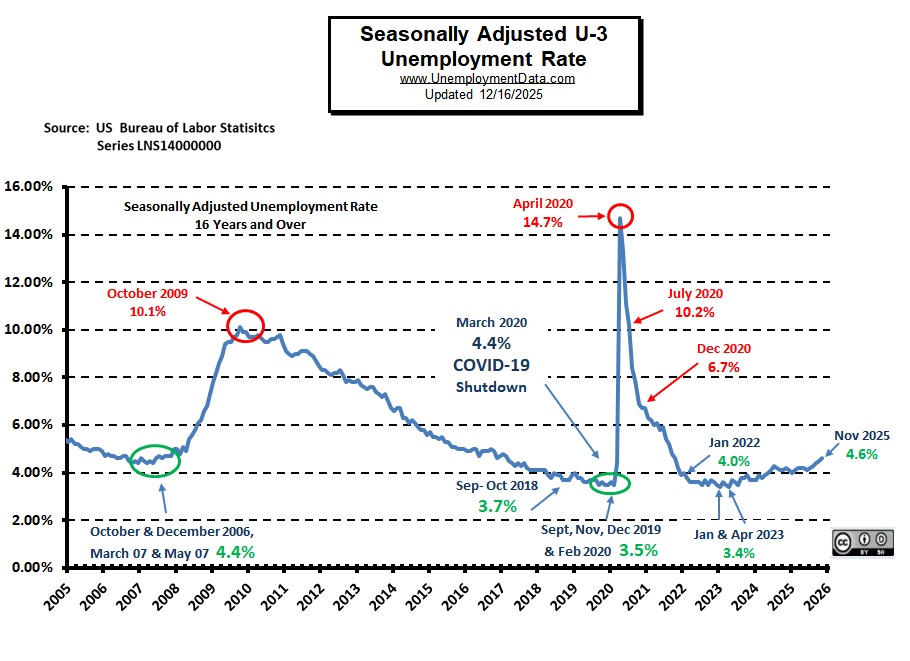
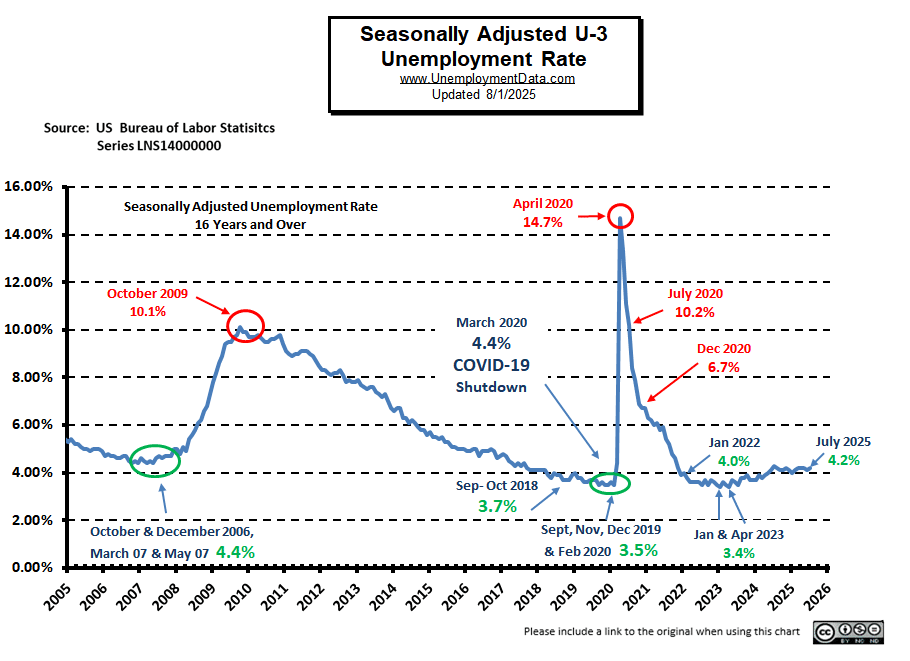
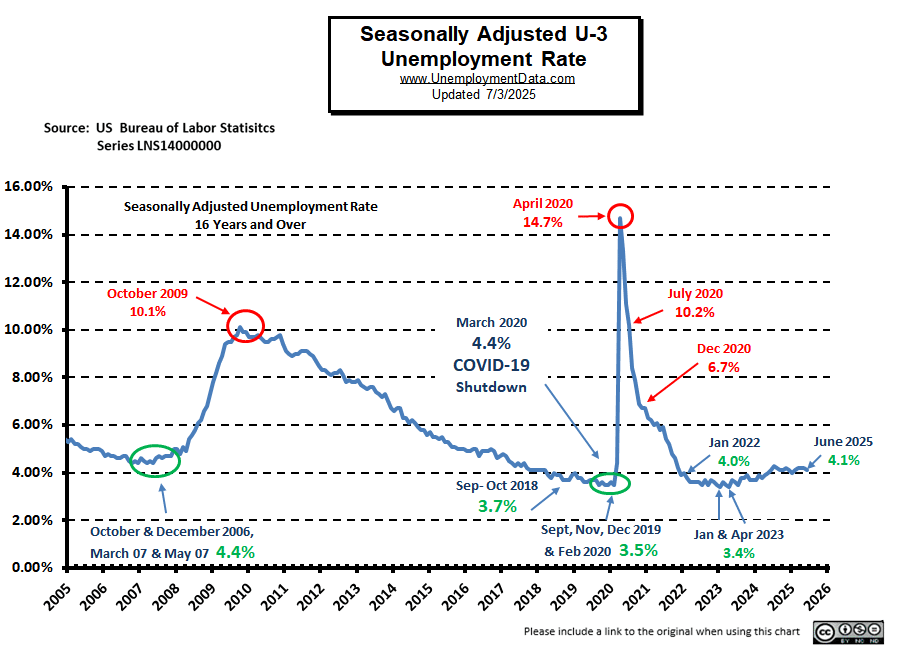
  • Seasonally Adjusted U3-  4.3% in January 
  • Unadjusted U3- 4.6% up from 4.1% in December
  • Unadjusted U6- 8.7% up from 8.2% in December
  • Labor Force Participation Rate- 62.5%
  • Employment- 156.714 million in January
  • December Adjusted Employment #: 159.448 million
  • Originally Released Employment- 160.448 million in December
  • Average BLS January Adjustment since 2000: -2.8 million
  • Next data release March 6, 2026

Summary:

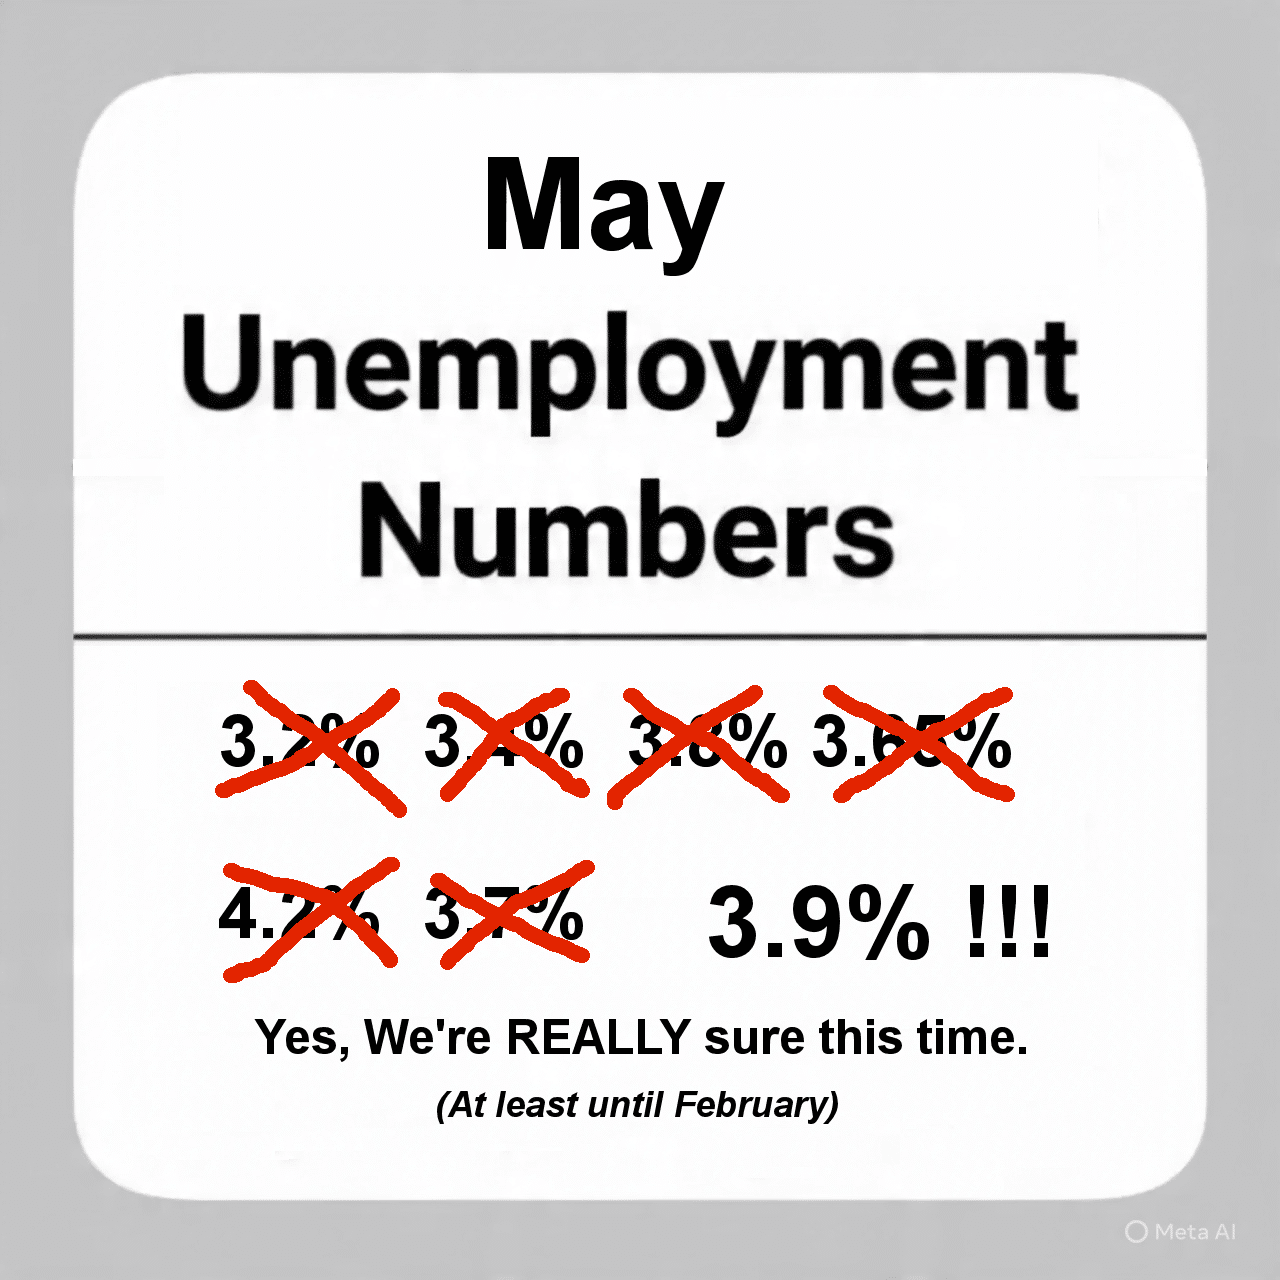
Every February, the BLS adjusts its employment numbers. The average adjustment since 2000 has been a reduction of -2.8 million previously reported jobs. This year was no exception with a reduction of -3.7 million based on the originally released numbers.

Here is the BLS Commissioner’s explanation:
“In accordance with annual practice, the establishment survey data released today have been benchmarked to reflect comprehensive counts of payroll jobs for March 2025. These counts are derived principally from the Quarterly Census of Employment and Wages (QCEW), which counts jobs covered by the Unemployment Insurance (UI) tax system. The benchmark process results in revisions to not seasonally adjusted data from April 2024 forward. Seasonally adjusted data from January 2021 forward are subject to revision. In addition, data for some series prior to 2021, both seasonally adjusted and unadjusted, incorporate other revisions.”

Despite the massive annual adjustment in employment, and the rise of Unadjusted U3 from 4.1% to 4.6%  the Commissioner reported:

“Total nonfarm payroll employment rose by 130,000 in January, and the unemployment rate changed little at 4.3 percent, the U.S. Bureau of Labor Statistics reported today. Job gains occurred in health care, social assistance, and construction, while federal government and financial activities lost jobs…

Both the unemployment rate, at 4.3 percent, and the number of unemployed people, at 7.4 million, changed little in January. These measures are higher than a year earlier, when the jobless rate was 4.0 percent, and the number of unemployed people was 6.9 million.

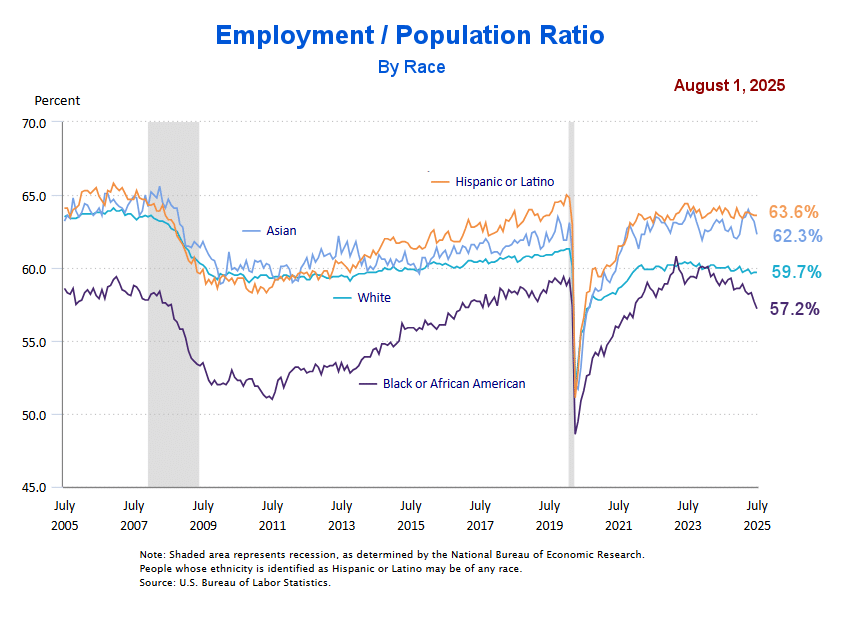
Among the major worker groups, the unemployment rate for teenagers declined to 13.6 percent in January. The jobless rates for adult men (3.8 percent), adult women (4.0 percent), and people who are White (3.7 percent), Black (7.2 percent), Asian (4.1 percent), or Hispanic (4.7 percent) showed little change over the month.”

As always, the Commissioner is talking about adjusted “Household Survey” numbers. Establishment Survey numbers tell a different story. Typically, January is one of the highest unemployment months, which explains the large differential between the adjusted and unadjusted numbers.

[Read more…] about February Employment Report for January 2026

Filed Under: BLS Tagged With: Employment Report, January 2026, Unemployment Report

Unemployment Report for December 2025

January 10, 2026 by Tim McMahon

The U.S. Bureau of Labor Statistics (BLS) released its employment / unemployment report
for December
on January 9th, 2026.

Employment / Unemployment 

Adj U3 Icon 4.4% down

  • Seasonally Adjusted U3-  4.4% in December
  • Unadjusted U3- 4.1% down from 4.3% in November
  • Unadjusted U6- 8.2% down from 8.4% in November
  • Labor Force Participation Rate- 62.4%
  • Employment- 160.448 million in December
  • Employment- 160.640 million in November
  • Next data release February 6, 2026


Summary:

Despite Seasonally Adjusted  BLS statements, if we look at the Unadjusted Establishment Survey report, Total Employed decreased in December, but Unadjusted and Adjusted Unemployment also decreased. Labor Force Participation was also down slightly.

According to the Commissioner of the U.S. Bureau of Labor Statistics:

“Both total nonfarm payroll employment (+50,000) and the unemployment rate (4.4 percent) changed little in December, the U.S. Bureau of Labor Statistics reported today. Employment continued to trend up in food services and drinking places, health care, and social assistance. Retail trade lost jobs…

Since reaching a peak in January, federal government employment is down by 277,000, or 9.2 percent. (Employees on paid leave or receiving ongoing severance pay are counted as employed in the establishment survey.)… Over the past 12 months, average hourly earnings have increased by 3.8 percent. “

You can read the full BLS report here.

As usual, they are talking about “Seasonally Adjusted Jobs”.

Looking at the Unadjusted Establishment Survey report we see…
Originally, the BLS reported employment of 160.652 million for November, 
which they adjusted slightly to 160.640 million jobs for November.

They are currently reporting 160.448 million jobs for December, which is actually a decrease of -204,000 jobs based on their original numbers.

The LFPR was down from 62.5% in November to 62.4% in December. [Read more…] about Unemployment Report for December 2025

Filed Under: BLS Tagged With: BLS, December, unemployment

Unemployment Report for Nov. 2025

December 17, 2025 by Tim McMahon

The U.S. Bureau of Labor Statistics (BLS) released its delayed employment / unemployment report for November
on December 16th, 2025.

Employment / Unemployment 

Adj U3 Icon 4-6up

  • Seasonally Adjusted U3- 4.6% Up from 4.4% in September
  • Unadjusted U3- 4.3% unchanged from September
  • Unadjusted U6- 8.4% Up from 7.7% in September
  • Labor Force Participation Rate- 62.5% Up from 62.4%
  • Employment- 160.411 million in October
  • Employment- 160.652 million in November
  • Next data release- January 9, 2026
  • October Unemployment Data not available due to gov’t shutdown

Summary:

Although unemployment information for October is not available Employmentdata was still collected. Total Employed increased in both October and November. Unadjusted Unemployment was 4.3% in both September and November, but Seasonally adjusted Unemployment increased in November.

According to the Commissioner of the U.S. Bureau of Labor Statistics:

“Total nonfarm payroll employment changed little in November (+64,000) and has shown little net change since April, the U.S. Bureau of Labor Statistics reported today. In November, the unemployment rate, at 4.6 percent, was little changed from September. Employment rose in health care and construction in November, while the federal government continued to lose jobs…

Federal government employment continued to decrease in November (-6,000). This follows a sharp decline of 162,000 in October, as some federal employees who accepted a deferred resignation offer came off federal payrolls. Federal government employment is down by 271,000 since reaching a peak in January. (Federal employees on furlough during the government shutdown were counted as employed in the establishment survey because they received pay, even if later than usual, for the pay period that included the 12th of the month. Employees on paid leave or receiving ongoing severance pay are counted as employed in the establishment survey.)”

You can read the full BLS report here.

As usual, they are talking about “Seasonally Adjusted Jobs”.

Looking at the Unadjusted Establishment Survey report, we see…
Originally, the BLS reported employment of 159.732 million for September.
They are currently reporting 160.411 million jobs for October and 160.652 million for November, which is actually an increase of 241,000 jobs from October to November. The LFPR was up from 62.4% in September to 62.5% in November.

Current Unemployment Rate Chart

As we can see, unemployment is above pre-COVID lows of 2019 and the January and April lows of 2023.

Seasonally Adj U-3 Unemployment Rate2 for Nov25 [Read more…] about Unemployment Report for Nov. 2025

Filed Under: BLS Tagged With: employment, November, unemployment

Delayed September 2025 Unemployment Report Released

November 20, 2025 by Tim McMahon

The U.S. Bureau of Labor Statistics (BLS) released its employment / unemployment report for September on November 20th, 2025.Seasonally Adjusted U3 Unemployment

Employment / Unemployment 


  • Delayed Due to Government Shut Down
  • Last Available BLS Data (for September)
  • Seasonally Adjusted U3- 4.4% Up from 4.3%
  • Unadjusted U3- 4.3% Down from 4.5% in August
  • Unadjusted U6- 7.7% Down from 8.2% in August
  • Labor Force Participation Rate- 62.4% Up from 62.3%
  • Employment- 159.732 million Up from 159.415 million
  • Next data release December 16, 2025

Summary:

Total Employed increased in September, Unadjusted Unemployment was down, but Seasonally adjusted Unemployment increased.

According to the Commissioner of the U.S. Bureau of Labor Statistics:

“Total nonfarm payroll employment edged up by 119,000 in September but has shown little change since April, the U.S. Bureau of Labor Statistics reported today. The unemployment rate, at 4.4 percent, changed little in September. Employment continued to trend up in health care, food services and drinking places, and social assistance. Job losses occurred in transportation and warehousing and in federal government…

Publication of September data was delayed by more than 6 weeks because of a lapse in federal appropriations. Collection of September data for the household survey had been completed in accordance with our normal schedule prior to the federal government shutdown. September estimates from the establishment survey include both data collected on our normal schedule prior to the shutdown and also September data that businesses self-reported electronically during the shutdown…

Establishment survey data for October 2025 will be published with the November 2025 data… Household survey data were not collected for the October 2025 reference period “

You can read the full BLS report here.

Current Unemployment Rate Chart

Seasonally Adjusted Unemployment is up from 4.3% to 4.4%. As we can see, unemployment is 1% above the January and April lows of 2023 but relatively unchanged over the last year.

Seasonally Adj U-3 Unemployment Rate2 Sep 25 [Read more…] about Delayed September 2025 Unemployment Report Released

Filed Under: BLS Tagged With: 2025, Government shutdown, September

No BLS Employment Data for October 2025 But ADP Says 42K New Jobs

November 7, 2025 by Tim McMahon

The U.S. Bureau of Labor Statistics data regarding the Unemployment situation in October was not released on November 7th as scheduled due to the continuing Federal Government shutdown.

Although AI automation is improving company profitability, it is also reducing the need for lower-level employees as Senior employees become more productive by using AI. This is squeezing younger employees. Back in May, Microsoft announced it would cut nearly 4% of its workforce, particularly in sales (~6,000 jobs), as it realigns around heavy AI investments. Reuters

Not all the news is bad…

Amazon will cut about 14,000 corporate jobs as the online retail giant ramps up spending on artificial intelligence while cutting costs elsewhere… However, simultaneously, it is hiring 250,000 seasonal workers, the same as last year’s holiday season. AP News

“In 2023, IBM made headlines with the announcement of nearly 8,000 layoffs, primarily from support roles such as Human Resources. The goal? To replace these workers with artificial intelligence (AI), automating repetitive tasks and increasing efficiency. However, just months later, the company found itself doing something it hadn’t anticipated: rehiring many of those workers… despite these significant savings, IBM’s workforce actually grew after the layoffs. Arvind Krishna, the CEO, explained to the Wall Street Journal that while AI had helped streamline operations, it also allowed the company to reinvest in other areas. Rather than eliminating jobs permanently, IBM found that the freed-up resources were being directed towards higher-value roles.”  GlassAlmanac

Meta Platforms is cutting roughly 600 artificial intelligence jobs… even as it continues to hire more workers for its superintelligence lab. Intellizence

Interestingly, more than half of the companies that perform layoffs citing automation/AI now say they regret the decision. TechRepublic+1

So, although AI reducing jobs is creating headlines, the truth may be entirely different. Throughout history, ever since the Luddite Weavers in the early 1800s, workers have feared the loss of jobs due to technological advances. But the truth is that after the initial displacements, technology has created more (and higher-paying) jobs than it has destroyed. Of course, the displaced workers suffer initially and retraining is often required. But those able to adapt to the changes are often better off in the end, while those unable to adapt suffer.

Many years ago, I said, “The only thing constant in life is change.  Those who adapt quickest thrive, those who adapt slowly survive, those who don’t adapt at all are relegated to the lowest levels of existence, poverty, and misery. The key to success is to adapt quickly… it will put you at the head of the pack.”  – Tim McMahon

Based on the alternative data from ADP we see: [Read more…] about No BLS Employment Data for October 2025 But ADP Says 42K New Jobs

Filed Under: BLS, Employment Tagged With: October 2025, October 2025 Employment Report

August 2025 Employment Situation

September 6, 2025 by Tim McMahon

The U.S. Bureau of Labor Statistics (BLS) released its employment / unemployment report for August on September 5th, 2025.

Employment / Unemployment 

Adj U3 Icon 4-3 up

  • Seasonally Adjusted U3- 4.3% Up from 4.2%
  • Unadjusted U3- 4.5% Down from 4.6% in July
  • Unadjusted U6- 8.2% Down from 8.3% in July
  • Labor Force Participation Rate- 62.3% Up from 62.2%
  • Employment- 159.410 million Up from 159.210 million
  • Next data release October 3, 2025

Summary:

Total Employed increased in August, Unadjusted Unemployment was down, but Seasonally adjusted Unemployment increased.

According to the Commissioner of the U.S. Bureau of Labor Statistics:

“Total nonfarm payroll employment changed little in August (+22,000) and has shown little change since April, the U.S. Bureau of Labor Statistics (BLS) reported today. The unemployment rate, at 4.3 percent, also changed little in August. A job gain in health care was partially offset by losses in federal government and in mining, quarrying, and oil and gas extraction…

Federal government employment continued to decline in August (-15,000) and is down by 97,000 since reaching a peak in January. (Employees on paid leave or receiving ongoing severance pay are counted as employed in the establishment survey.)”

As usual, they are talking about “Seasonally Adjusted Jobs”.

Looking at the Unadjusted Establishment Survey report, we see…
Originally, the BLS reported employment of 159.227 million jobs for July, 
which they adjusted slightly to 159.210 million in September.

They are currently reporting 159.410 million jobs for August, which is an increase of 200,000 jobs based on their new numbers or 183,000 based on their original numbers. The LFPR increased from 62.2% to 62.3%.

Current Unemployment Rate Chart

Seasonally Adjusted Unemployment is up from 4.2% to 4.3%. As we can see, unemployment is 0.9% above the January and April lows of 2023 but relatively unchanged over the last year.

Seasonally Adj U-3 Unemployment Rate2 Aug 25 [Read more…] about August 2025 Employment Situation

Filed Under: BLS Tagged With: ADP, August 2025, BLS

BLS Data Controversy

August 8, 2025 by Tim McMahon

Unemployment number changes whiteboardOver the years, I have frequently mentioned the ongoing data revisions of the employment numbers. So much so, that we maintain a list of the originally published employment numbers and the currently published numbers. We also highlight the change every month in our eTrends Newsletter (See Subscription box on Right) when the BLS releases its new numbers.

Last year, the BLS OVERESTIMATED employment in November and December 2024 by more than 1/2 million each month, i.e.,  515,000 in December and 678,000 in November. But that was after declaring in February that they were overestimating employment by roughly that amount every month.

Data Fudging or Legit Revision?

Throughout 2023 and 2024, the BLS consistently published high employment numbers. But then, a couple of months later, when no one was paying much attention, they would adjust the numbers down by roughly half a million. [Read more…] about BLS Data Controversy

Filed Under: BLS Tagged With: BLS, BLS Fudging Numbers, Fudging, Numbers, Revision, Trump

Early Warning Signs of a Weakening Economy in July 2025

August 2, 2025 by Tim McMahon

The U.S. Bureau of Labor Statistics (BLS) released its employment / unemployment report for July on August 1st, 2025.

Employment / Unemployment 

Adj U3 Unemployment 4.2%


  • Seasonally Adjusted U3- 4.2% Up from 4.1%
  • Unadjusted U3- 4.6% Up from 4.4% in June
  • Unadjusted U6- 8.3% Up from 8.1% in June
  • Labor Force Participation Rate- 62.2% Down from 62.3%
  • Employment- 159.227 million Down from 160.293 million
  • Next data release September 5, 2025

Summary:

Total Employed decreased in July, Unadjusted Unemployment was up, as was Seasonally Adjusted Unemployment. There are a few early warning signs of a slowing Labor Market.

According to the Commissioner of the U.S. Bureau of Labor Statistics:

“Total nonfarm payroll employment changed little in July (+73,000) and has shown little change since April, the U.S. Bureau of Labor Statistics (BLS) reported today. The unemployment rate, at 4.2 percent, also changed little in July. Employment continued to trend up in health care and in social assistance. Federal government continued to lose jobs…

Federal government employment continued to decline in July (-12,000) and is down by 84,000 since reaching a peak in January. (Employees on paid leave or receiving ongoing severance pay are counted as employed in the establishment survey.)”

As usual, they are talking about “Seasonally Adjusted Jobs”.

Looking at the Unadjusted Establishment Survey report, we see…
Originally, the BLS reported employment of 160.475 million for June, 
which they adjusted down to 160.293 million as of this month.

They are currently reporting 159.227 million jobs for July, which is actually a monthly decrease of 1,248,000 jobs based on their original numbers or 1,066,000 based on their new numbers.

Early Warning Signs of a Weakening Economy

Although the U3 Seasonally Adjusted Unemployment rate is only up 1/10th of a percent, and the BLS Commissioner tried to put an optimistic spin on it, the number of job openings in the U.S. fell by 275,000 to around 7.4 million last month. So, hiring is slacking off.

Unadjusted Establishment Survey jobs are down by 1,248,000 jobs based on their original June numbers.

The LFPR is down from 62.3% to 62.2%, back to November 2022 levels.

Also, the “Starbucks Indicator” created by Stansberry’s Credit Opportunities editor Mike DiBiase, which says that when Starbucks sales decline for several quarters in a row, the economy is weakening. And that’s exactly what we’re seeing today. Earlier this week, Starbucks reported same-store sales fell 2%. That marked the sixth straight quarter of falling same-store sales.

And, as the Commissioner said, since Government employees scheduled for downsizing are still being paid, they aren’t being counted as unemployed yet, but when their severance pay runs out, that will spike the unemployment rate.

We may be seeing the beginning of an upturn in unemployment in the longer durations, i.e., it is starting to take longer to find a job, 24.9% of those unemployed have been unemployed for 27 weeks or longer.

And finally, looking at the Employment / Population by Race, we see a declining trend in the Employment of Blacks (i.e., the most vulnerable segment of the population). In the chart below, we can see that it has steadily declined for almost two years now. But it sharply declined this month.Emp-Pop Ratio by Race July 2025aOn the plus side,

ADP’s Chief Economist says, “Employers have grown more optimistic”.

Weakening jobs numbers could force Powell to lower interest rates.

The exodus of illegals should open up more jobs for Americans. According to the WSJ, since mid‑2024, over 1.6 million foreign-born workers have left the U.S. labor force. During the same period, U.S.-born workers added roughly 2.5 million jobs, suggesting a shift toward domestic labor filling openings formerly held by immigrants. One Example: After ICE removes illegal workers, job applicants flood meatpacking plant to replace them.

Also, Trump is negotiating Billions in increased manufacturing investment in the U.S., so in the longer run, jobs should increase, but in the meantime, we may be in for a bit of a rough patch.

Despite these early signs of weakening, FED Chairman Powell didn’t reduce rates at Wednesday’s meeting, citing concerns of rising inflation. But, the market has noted the signs of weakness, and the Futures market has increased the odds of a rate cut in September, from 38% on Wednesday to 85% after Friday’s jobs report.

Current Unemployment Rate Chart

Seasonally Adjusted Unemployment is up from 4.1% to 4.2%. As we can see, unemployment is 0.8% above the January and April lows of 2023 but relatively unchanged over the last year.

Seasonally Adj U-3 Unemployment Rate Chart [Read more…] about Early Warning Signs of a Weakening Economy in July 2025

Filed Under: BLS Tagged With: 2025, BLS, jobs, July

June Seasonally Adjusted Unemployment Down

July 4, 2025 by Tim McMahon

The U.S. Bureau of Labor Statistics (BLS) released its employment / unemployment report for June on July 3rd, 2025.

Employment / Unemployment 

Adj U3 Icon 4-1


  • Seasonally Adjusted U3- 4.1% Down from 4.2%
  • Unadjusted U3- 4.4% Up from 4.0% in May
  • Unadjusted U6- 8.1% Up from 7.4% in May
  • Labor Force Participation Rate- 62.3% Down from 62.4%
  • Employment- 160.475 million Up from 159.958 million
  • Next data release August 1, 2025

Summary:

Total Employed increased in June, Seasonally Adjusted Unemployment was down, but  Unadjusted Unemployment increased.  Economists were predicting a bad report, but a superficial look makes this appear to be a good report. This shocked the legacy media, thinking that it turned out better than expected. But a deeper look shows cracks appearing. Wages pretty much across the board fell, with average weekly earnings down slightly. And U6 unadjusted unemployment went up from 7.4% to 8.1% and U3 unadjusted unemployment went up from 4.0% to 4.4%. Typically, June unemployment increases due to students entering the workforce, but…

According to ADP the economy lost -33,000 jobs…

According to the Commissioner of the U.S. Bureau of Labor Statistics:

“Total nonfarm payroll employment increased by 147,000 in June, and the unemployment rate changed little at 4.1 percent, the U.S. Bureau of Labor Statistics reported today. Job gains occurred in state government and health care. Federal government continued to lose jobs…

Both the unemployment rate, at 4.1 percent, and the number of unemployed people, at 7.0 million, changed little in June. The unemployment rate has remained in a narrow range of 4.0 percent to 4.2 percent since May 2024…”

You can read the full BLS report here.

As usual, they are talking about “Seasonally Adjusted Jobs”.

Looking at the Unadjusted Establishment Survey report we see…
Originally the BLS reported employment of 159.964 million for May
which they adjusted slightly to 159.958 million in July.

They are currently reporting 160.475 million jobs for June which is actually an increase of 511,000 jobs based on their original numbers or 517,000 based on their new May numbers. The LFPR decreased from 62.4% to 62.3%.

Current Unemployment Rate Chart

As we can see, unemployment is 0.6% above pre-COVID lows of 2019 and the January and April lows of 2023.

Seasonally Adj U-3 Unemployment Rate2 Jun 25 [Read more…] about June Seasonally Adjusted Unemployment Down

Filed Under: BLS Tagged With: ADP, BLS, June 2025, unemployment

May Employment Nothing Burger

June 6, 2025 by Tim McMahon

The U.S. Bureau of Labor Statistics (BLS) released its employment / unemployment report for May on June 6th, 2025.

Employment / Unemployment 

Adj U3 4.2 percent unchanged


  • Seasonally Adjusted U3- 4.2% Unchanged
  • Unadjusted U3- 4.0% Up from 3.9% in April
  • Unadjusted U6- 7.4% Up from 7.3% in April
  • Labor Force Participation Rate- 62.4% Down from 62.6%
  • Employment- 159.964 million Up from 159.238 million
  • Next data release July 3rd, 2025


Summary:

Although Total Employed increased slightly in May, and Unadjusted Unemployment was up slightly, Seasonally adjusted Unemployment stayed exactly the same indicating that although unemployment increased it was typical for the month of May. And unemployment has been in a narrow range for an entire year.

According to the Commissioner of the U.S. Bureau of Labor Statistics:

“Total nonfarm payroll employment increased by 139,000 in May, and the unemployment rate was unchanged at 4.2 percent, the U.S. Bureau of Labor Statistics reported today. Employment continued to trend up in health care, leisure and hospitality, and social assistance. Federal government continued to lose jobs… 

The unemployment rate held at 4.2 percent in May and has remained in a narrow range of 4.0 percent to 4.2 percent since May 2024. The number of unemployed people, at 7.2 million, changed little over the month…

In May, the employment-population ratio declined by 0.3 percentage point to 59.7 percent. The labor force participation rate decreased by 0.2 percentage point to 62.4 percent.”

You can read the full BLS report here.

As usual, they are talking about “Seasonally Adjusted Jobs”.

Looking at the Unadjusted Establishment Survey report we see…
Originally the BLS reported employment of 159.316 million for April
which they adjusted slightly to 159.238 million in June.

They are currently reporting 159.964 million jobs for May which is actually an increase of +648,000 jobs based on their original numbers or +726,000 jobs based on their new adjusted numbers. The LFPR was lower at 62.4%.

Current Unemployment Rate Chart

As we can see, unemployment is 0.7% above pre-COVID lows of 2019 and 0.8% above the January and April lows of 2023.

Seasonally Adj U-3 Unemployment Rate2 May 25 [Read more…] about May Employment Nothing Burger

Filed Under: BLS Tagged With: 2025, BLS, employment, May, unemployment

  • Page 1
  • Page 2
  • Page 3
  • Interim pages omitted …
  • Page 11
  • Go to Next Page »

Primary Sidebar

Rate Any Stock In Seconds

Get a detailed stock report showing its true value, safety score, and ideal timing to buy. Plus, receive a color coded Buy, Sell, or Hold recommendation.

Get Your Free Stock Analysis Here.

Recent Posts

  • February Employment Report for January 2026
  • Unemployment Report for December 2025
  • Unemployment Report for Nov. 2025
  • Delayed September 2025 Unemployment Report Released
  • No BLS Employment Data for October 2025 But ADP Says 42K New Jobs

Search Site

Resources

  • Bureau of Labor Statistics Current Population Survey Monthly survey of households conducted by the Bureau of Census for BLS. It provides data on the labor force, employment, unemployment, etc.
  • Capital Professional Services Providing web design and development and Internet marketing services
  • Elliott Wave University Using the Elliott Wave Principle to improve investment performance
  • Financial Trend Forecaster Featuring Moore Inflation Predictor, NYSE Rate of Change and NASDAQ Rate of change
  • InflationData.com Inflation calculators, databases, etc.
  • Intergalactic Web Designers Web design and development services

Articles by Category

Articles by Date

Disclaimer

At UnemploymentData.com we are not registered investment advisors and do not provide any individualized advice. Past performance is not necessarily indicative of future performance and future accuracy and profitable results cannot be guaranteed.

Privacy & Terms of Use

Privacy Statement & Terms of Use

Do Not Sell My Information

Copyright © 2026 · News Pro on Capital Professional Services, LLC. All rights reserved · Log in