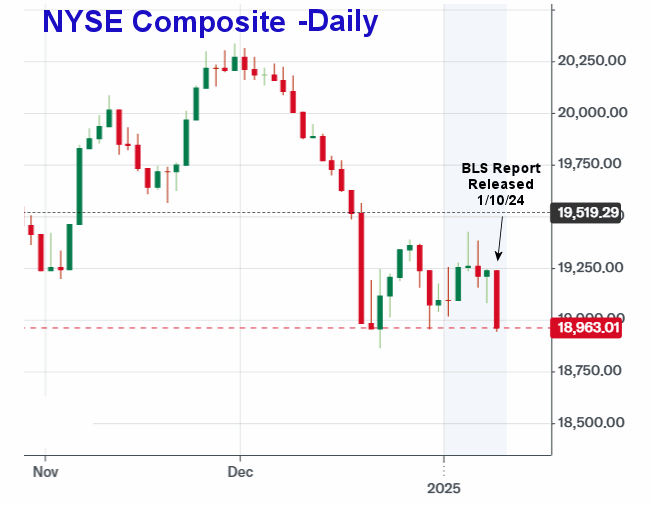
The U.S. Bureau of Labor Statistics (BLS) released its employment / unemployment report for June on July 3rd, 2025.
Employment / Unemployment
![]()
- Seasonally Adjusted U3- 4.1% Down from 4.2%
- Unadjusted U3- 4.4% Up from 4.0% in May
- Unadjusted U6- 8.1% Up from 7.4% in May
- Labor Force Participation Rate- 62.3% Down from 62.4%
- Employment- 160.475 million Up from 159.958 million
- Next data release August 1, 2025
Summary:
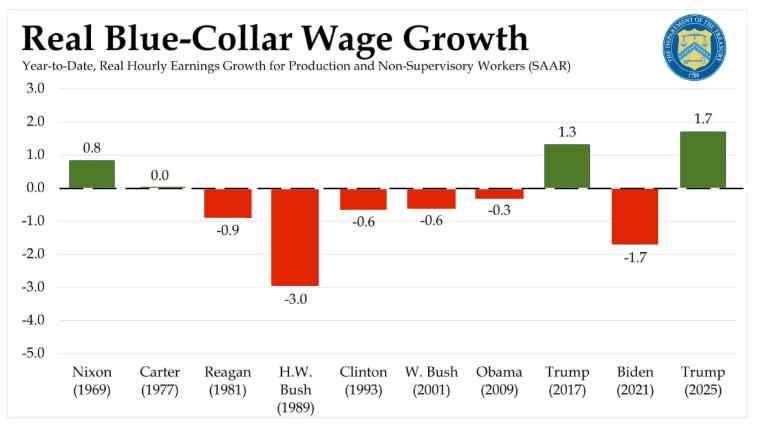
Total Employed increased in June, Seasonally Adjusted Unemployment was down, but Unadjusted Unemployment increased. Economists were predicting a bad report, but a superficial look makes this appear to be a good report. This shocked the legacy media, thinking that it turned out better than expected. But a deeper look shows cracks appearing. Wages pretty much across the board fell, with average weekly earnings down slightly. And U6 unadjusted unemployment went up from 7.4% to 8.1% and U3 unadjusted unemployment went up from 4.0% to 4.4%. Typically, June unemployment increases due to students entering the workforce, but…
According to ADP the economy lost -33,000 jobs…
According to the Commissioner of the U.S. Bureau of Labor Statistics:
“Total nonfarm payroll employment increased by 147,000 in June, and the unemployment rate changed little at 4.1 percent, the U.S. Bureau of Labor Statistics reported today. Job gains occurred in state government and health care. Federal government continued to lose jobs…
Both the unemployment rate, at 4.1 percent, and the number of unemployed people, at 7.0 million, changed little in June. The unemployment rate has remained in a narrow range of 4.0 percent to 4.2 percent since May 2024…”
You can read the full BLS report here.
As usual, they are talking about “Seasonally Adjusted Jobs”.
Looking at the Unadjusted Establishment Survey report we see…
Originally the BLS reported employment of 159.964 million for May
which they adjusted slightly to 159.958 million in July.
They are currently reporting 160.475 million jobs for June which is actually an increase of 511,000 jobs based on their original numbers or 517,000 based on their new May numbers. The LFPR decreased from 62.4% to 62.3%.
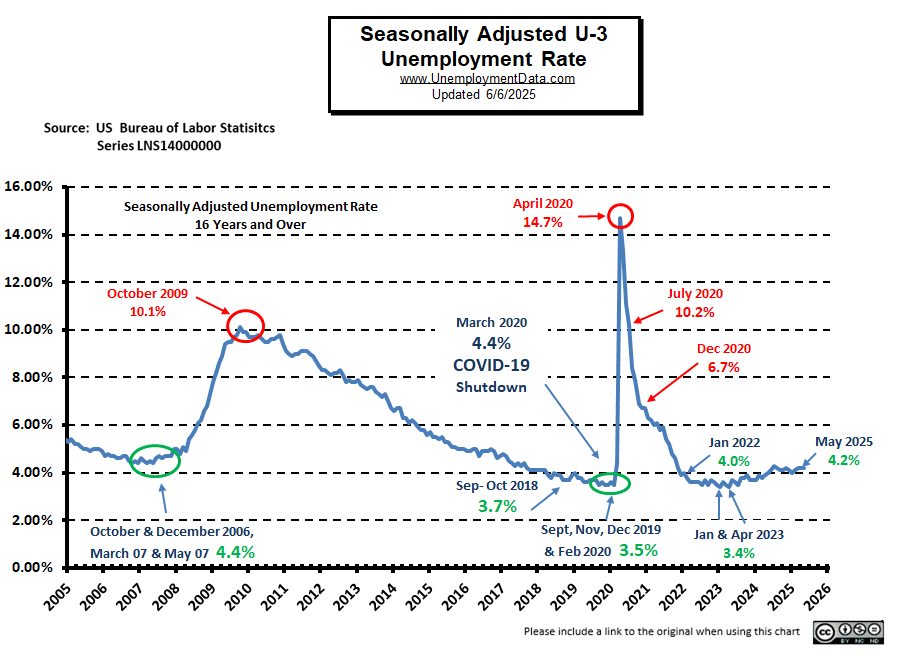
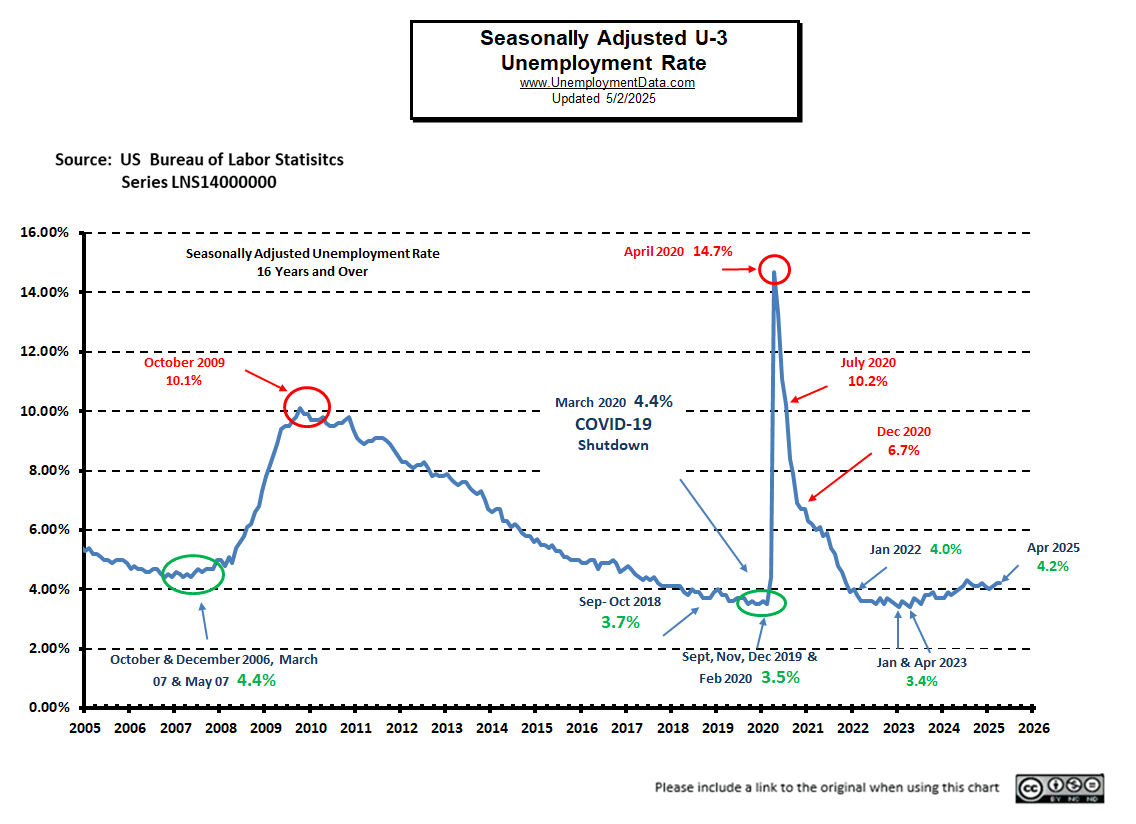
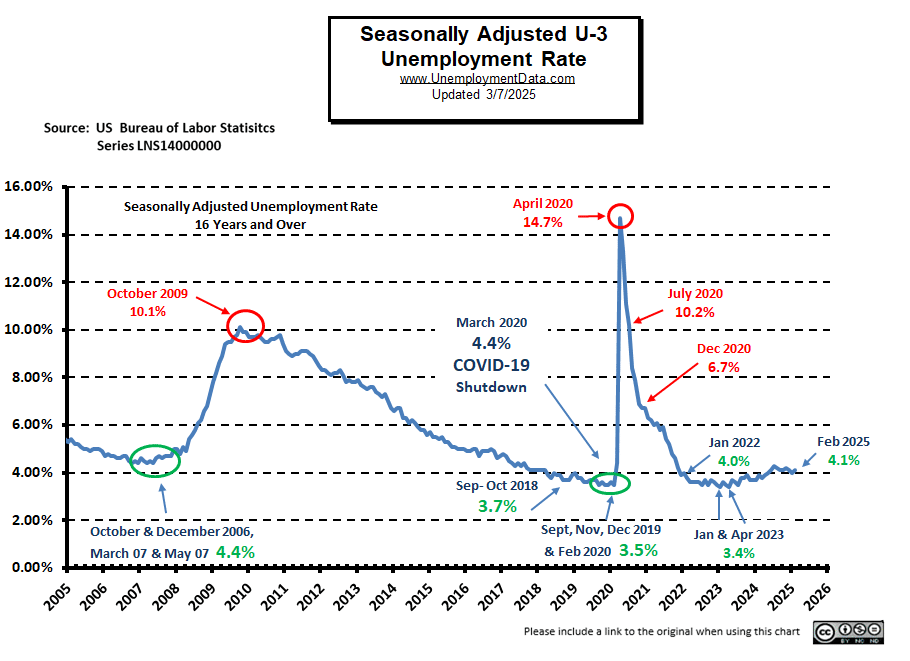
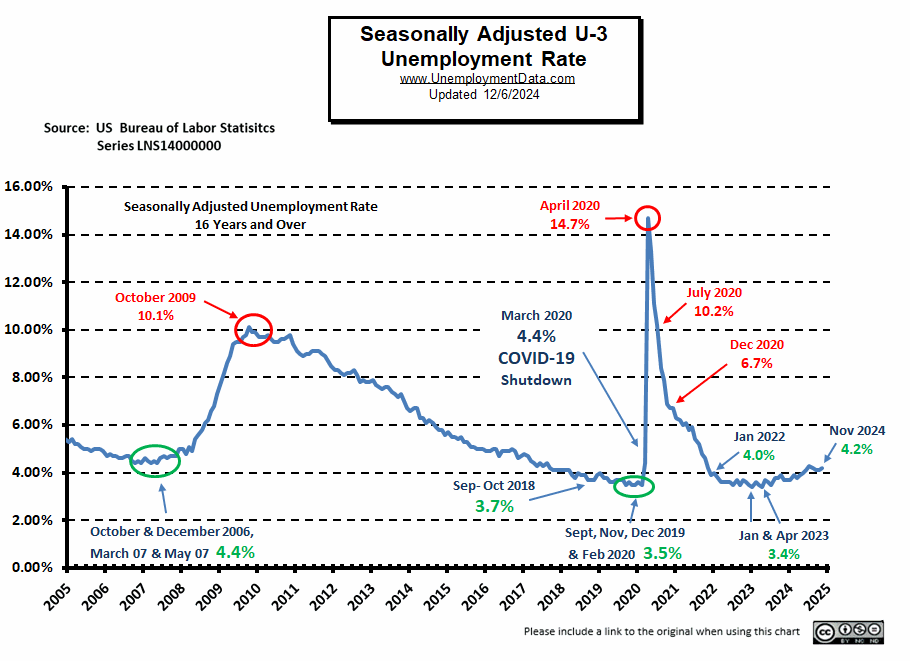
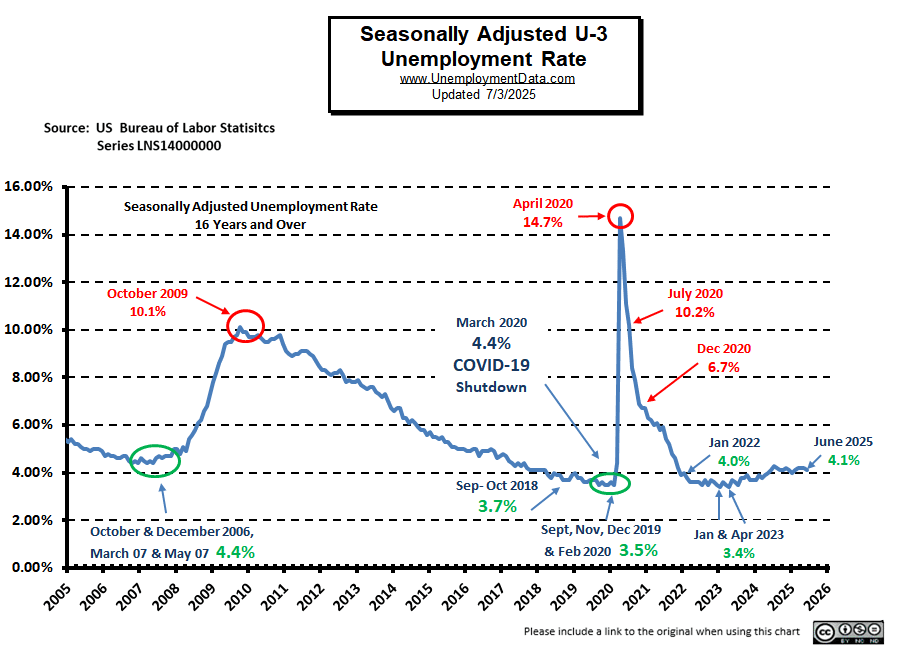
Current Unemployment Rate Chart
As we can see, unemployment is 0.6% above pre-COVID lows of 2019 and the January and April lows of 2023.
 [Read more…] about June Seasonally Adjusted Unemployment Down