
The U.S. Bureau of Labor Statistics (BLS) released its October employment / unemployment report on November 6th, 2026.
Employment / Unemployment
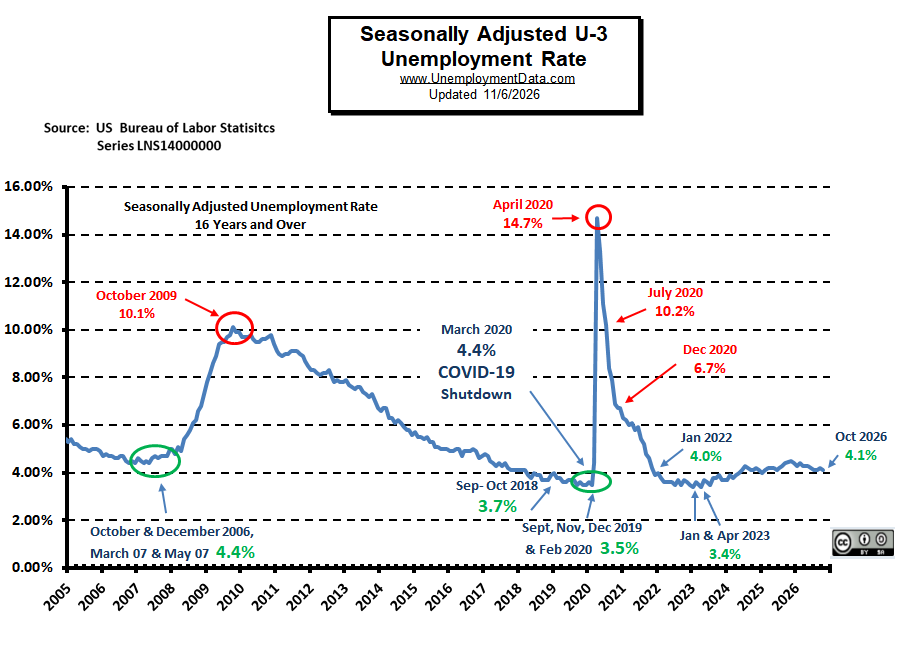
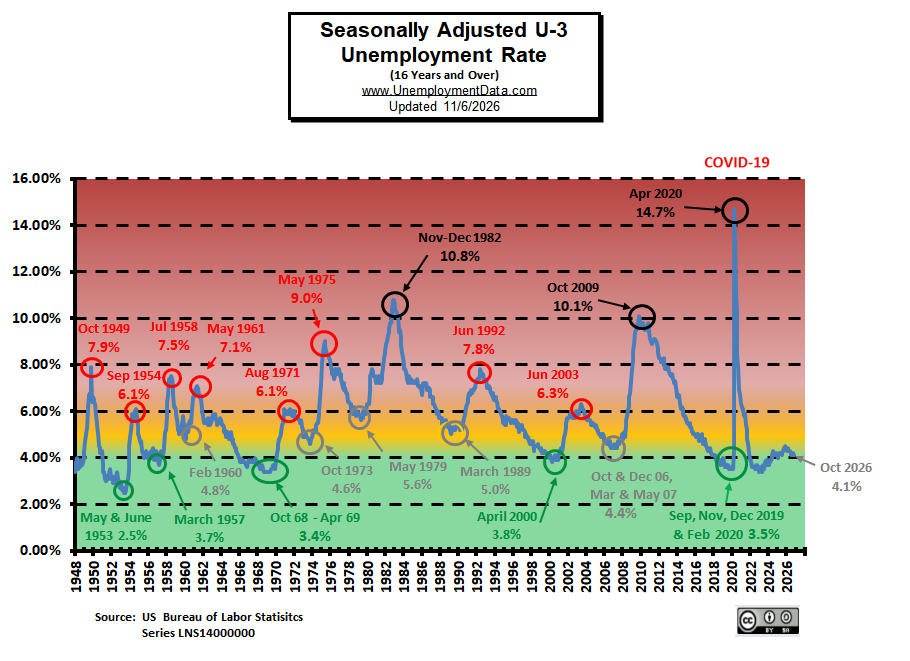
- Seasonally Adjusted U-3 is 4.1% down from 4.2%
- Unadjusted U-3 is 3.9% down from 4.0%
- Unadjusted U-6 is 7.5% up from 7.3%
- Labor Force Participation is 61.9% up from 61.8%
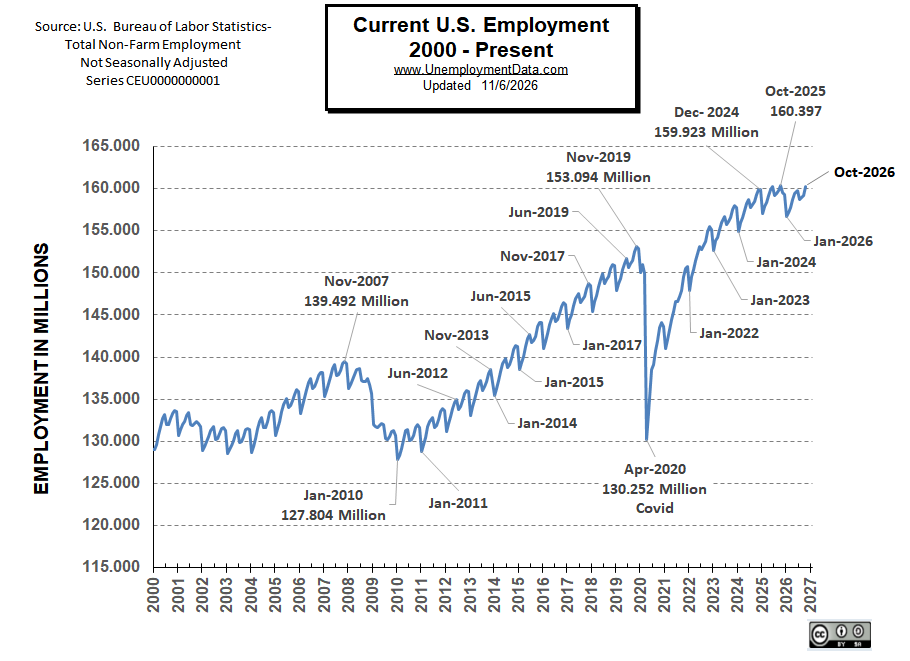
- Unadjusted Employment rose from 159.254 million to 160.277 million
- Next Update: December 4th, 2026
Current Unemployment Rate Chart
Current Employment Chart
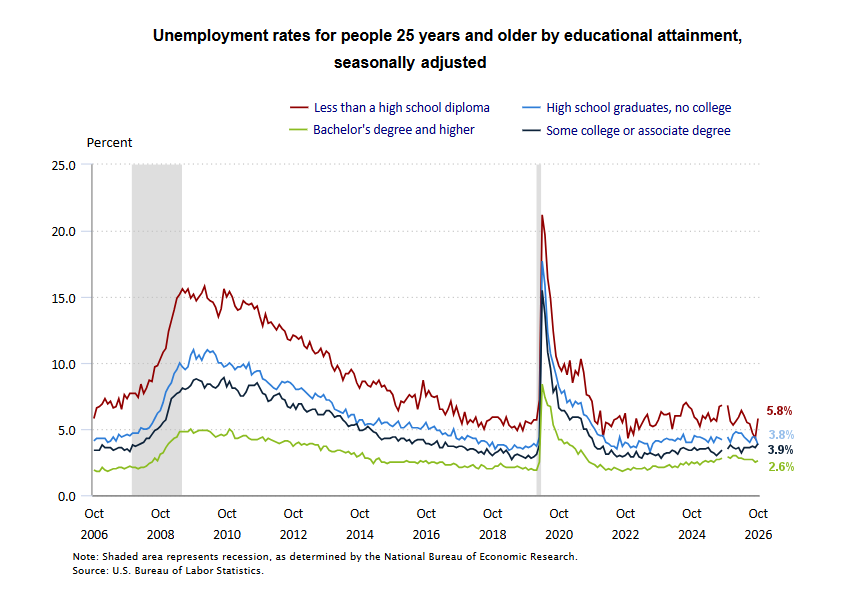
Unemployment by Education
Something rather strange is going on with the Employment by Education. Last month, High School Dropouts had a lower unemployment rate than High School Grads. But this month that number spiked back up sharply. But now, High School Grads have a lower unemployment rate than those with “Some College” or an Associate’s Degree. Strange…
Last month I postulated that it was possible that employers were replacing the deported workers with those without a H.S. degree. and perhaps this month they found they weren’t that good an employee and went to those with a H.S. degree instead?
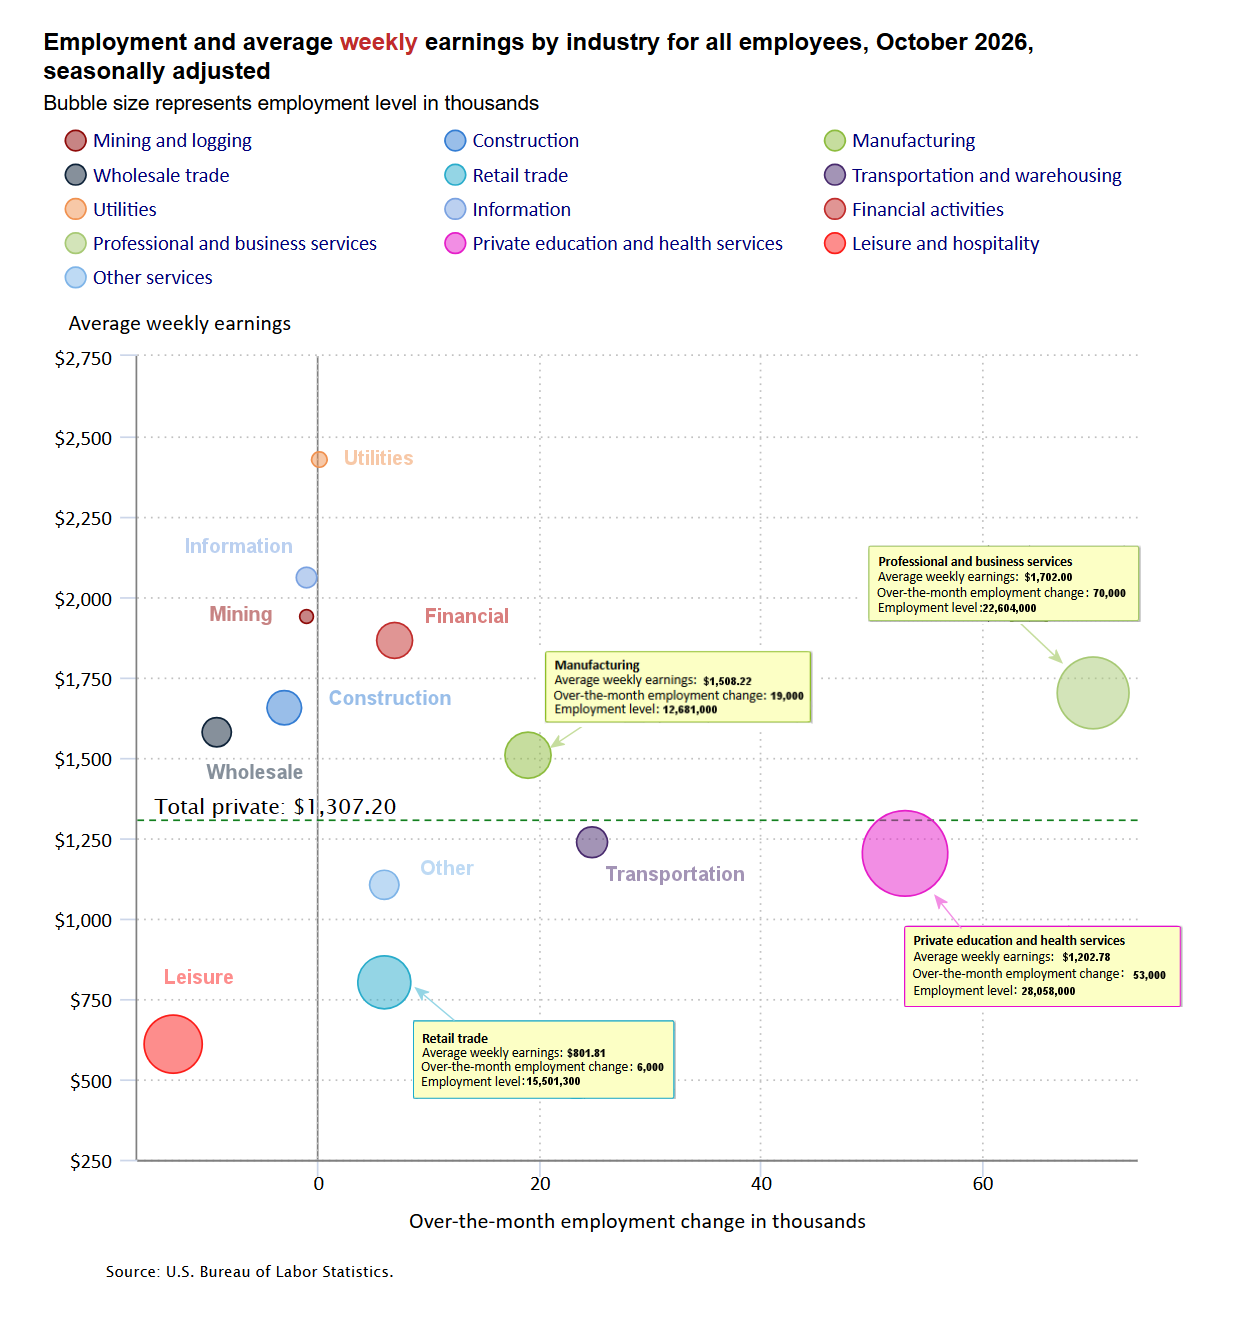
BLS: October 2026 Employment by Sector
Looking at the chart, we can see that Professional and Busines Services was the biggest gainer with an increase of +70,000 jobs. Followed by Education and Health at 53,000 jobs. 4 sectors didn’t show employment growth in October 2026: Leisure and hospitality lost -13,000 jobs, Construction lost -3,000 jobs, Mining and logging lost -1,000 jobs, and Information lost -1,000 jobs.
BLS Average Weekly Wages
| Date | Average Weekly Wage |
|---|---|
| October 2026 | $1,307.20 |
| September 2026 | $1,302.38 |
| August 2026 | $1,298.94 |
| July 2026 | $1,291.05 |
| June 2026 | $1,289.34 |
| May 2026 | $1,285.91 |
| April 2026 | $1,283.16 |
| March 2026 | $1,277.37 |
| February 2026 | $1,278.36 |
| January 2026 | $1,274.25 |
| December 2025 | $1,266.08 |
| November 2025 | $1,269.10 |
| October 2025 | $1,260.27 |
| September 2025 | $1,255.14 |
| August 2025 | $1,252.40 |
| July 2025 | $1,247.27 |
| June 2025 | $1,243.51 |
| May 2025 | $1,240.78 |
| April 2025 | $1,238.92 |
| March 2025 | $1,234.96 |
| February 2025 | $1,229.15 |
| January 2025 | $1,222.14 |
BLS Employment Levels by Industry
October 2026, Seasonally Adjusted Employment
Employment levels are “Seasonally Adjusted” so the Monthly increase is not necessarily what you would expect. For instance Mining and Logging is supposed to be down -1,000 but it actually went down from 609,000 to 605,000, which looks more like -4,000 to me. But Construction went up from 8,359,000 to 8,367,000, an increase of +8,000, but it is down a “Seasonally Adjusted” -3,000.
| Industry | Monthly Increase | Ave. Weekly Earnings | October Employment Level | September Employment Level |
|---|---|---|---|---|
| Total private | 159,000 | $1,307.20 | 135,961,000 | 135,588,000 |
| Mining and logging | -1,000 | $1,939.63 | 605,000 | 609,000 |
| Construction | -3,000 | $1,655.98 | 8,367,000 | 8,359,000 |
| Manufacturing | 19,000 | $1,508.22 | 12,681,000 | 12,683,000 |
| Retail trade | 6,000 | $801.81 | 15,501,300 | 15,488,200 |
| Transportation and warehousing | 24,800 | $1,237.57 | 6,636,100 | 6,606,300 |
| Utilities | 100 | $2,060.90 | 9,085,000 | NA |
| Information | -1,000 | $2,060.90 | 2,734,000 | 2,745,000 |
| Financial activities | 7,000 | $1,865.25 | 9,085,000 | 9,086,000 |
| Professional and business services | 70,000 | $1,702.00 | 22,604,000 | 22,527,000 |
| Private education and health services | 53,000 | $1,202.78 | 28,058,000 | 27,974,000 |
| Leisure and hospitality | -13,000 | $609.45 | 16,964,000 | 17,001,000 |
| Other services | 6,000 | $1,105.20 | 6,045,000 | 6,035,000 |
Source: BLS
ADP® National Employment Report
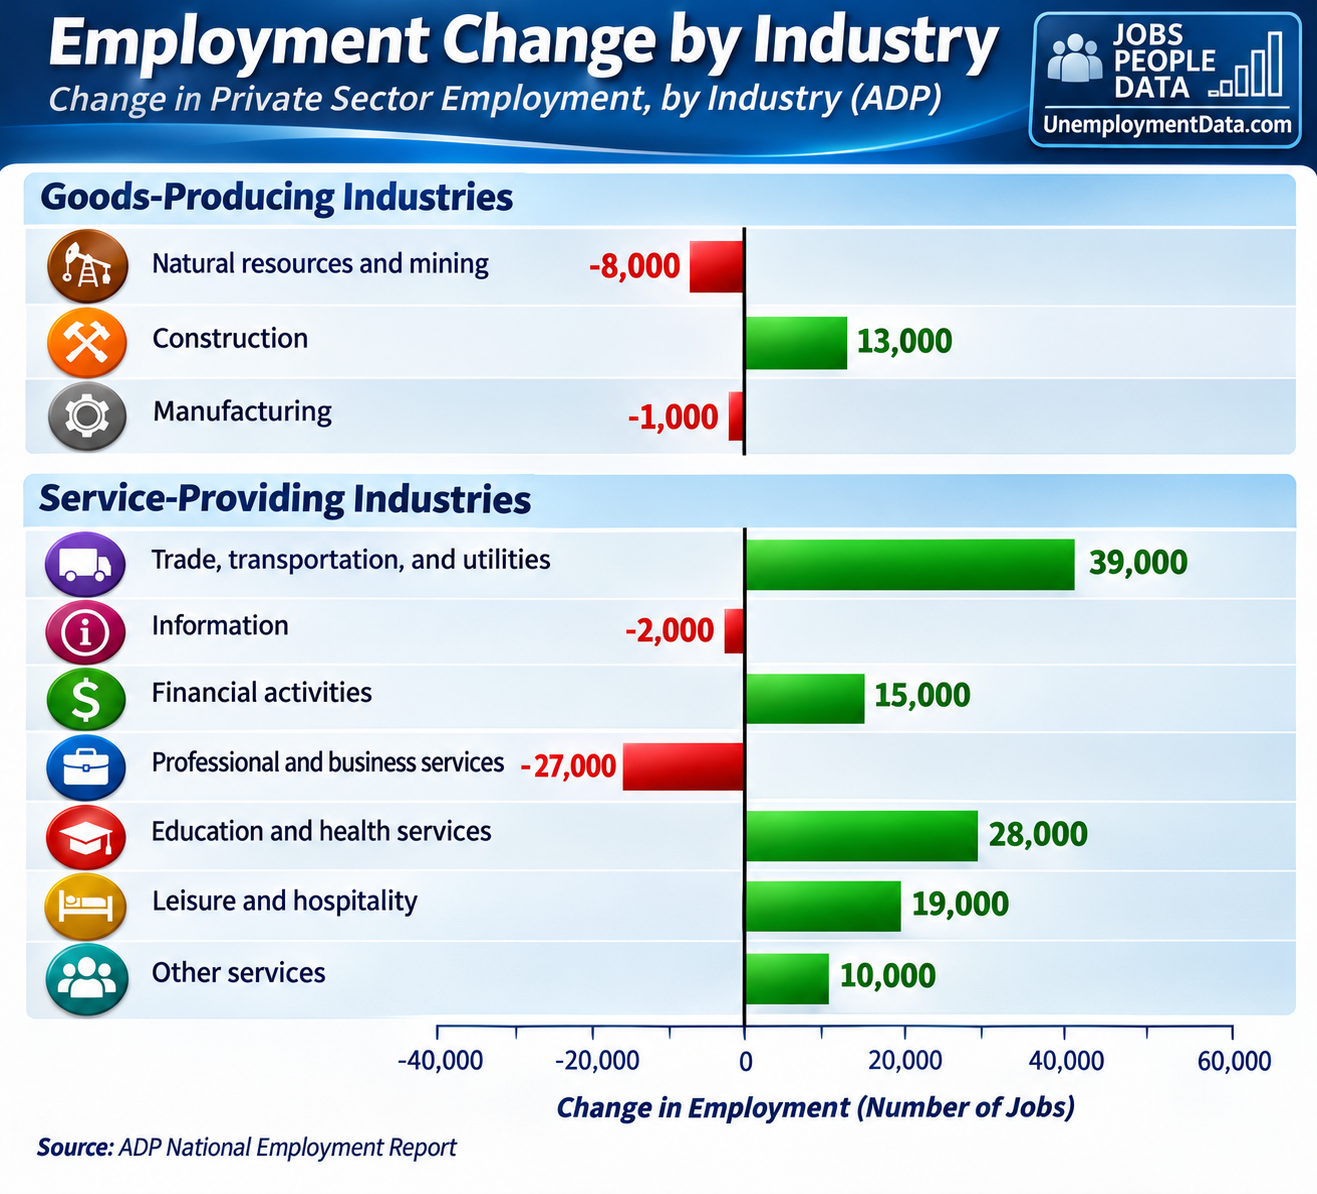
ADP provides an independent (non-government) estimate of private-sector employment and pay, based on data derived from ADP client payrolls. According to ADP®, In collaboration with Stanford Digital Economy Lab. As you can see, the numbers are quite different than those provided by the BLS, for instance BLS says construction lost -3,000 jobs, while ADP says it gained 13,000, which is closer to the +8,000 we saw above without the Seasonal Adjustment.
ADP: Private employers added 86,000 jobs in October
- Hiring showed solid growth for a second month, and pay gains were steady. There were weak spots; professional and business services lost jobs for the third straight month.
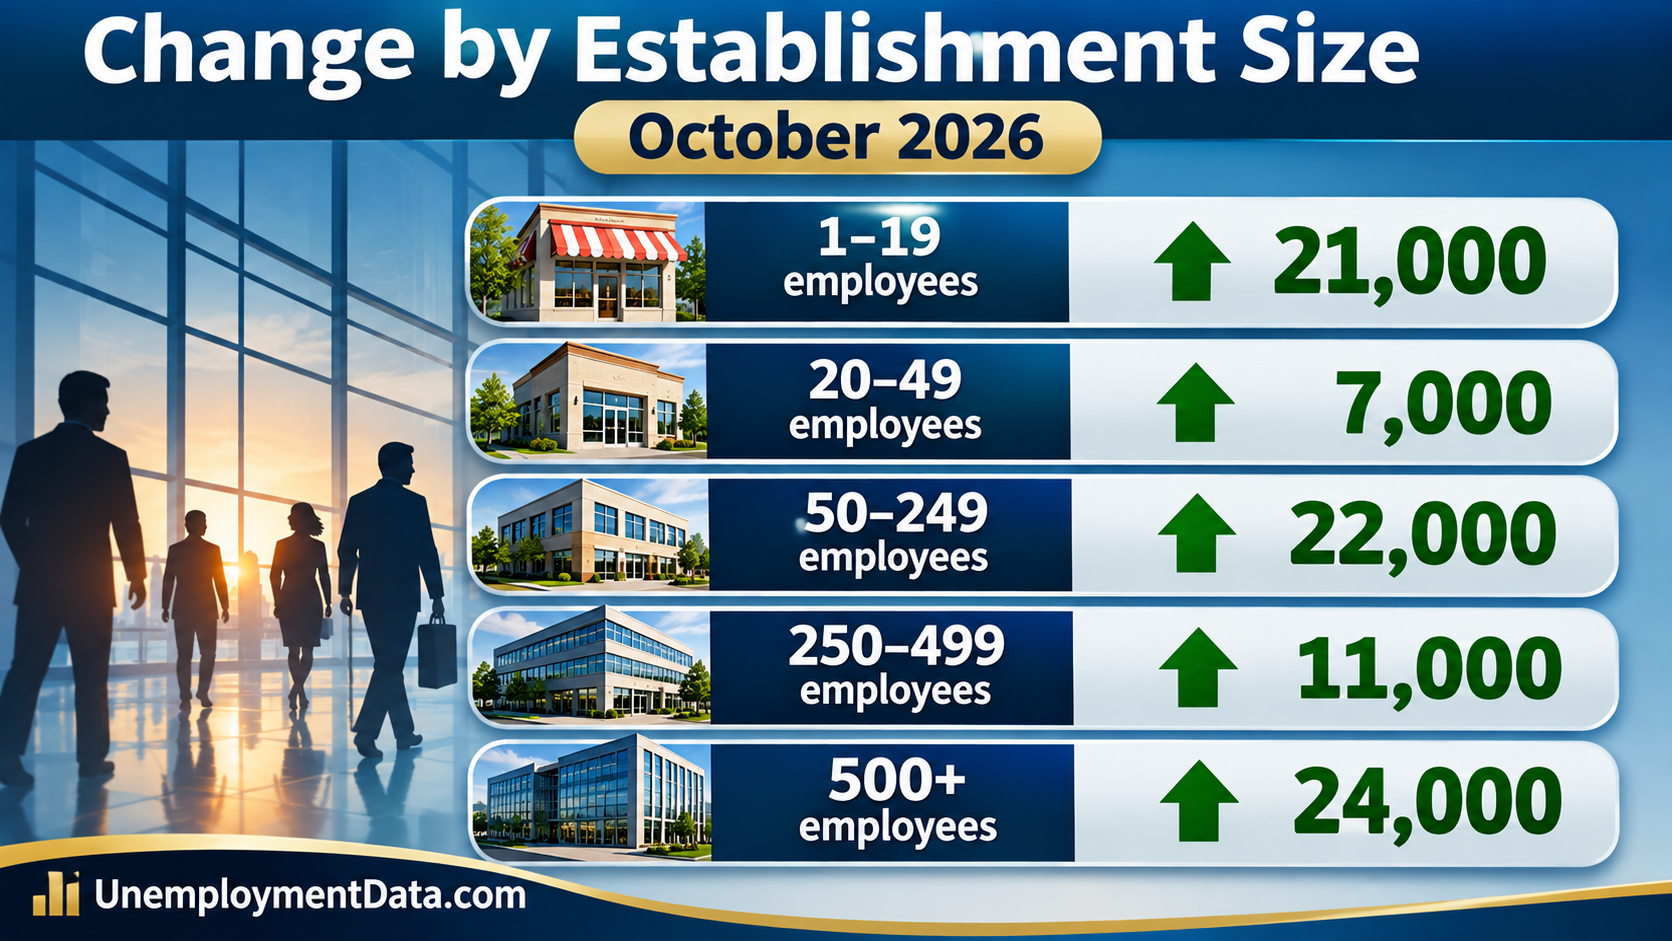
ADP Private Employment by Establishment Size
ADP Job Gainers / Losers
Seasonally Adjusted Unemployment Rate Chart 1948-Present
Less Than Full Employment
This chart compares employment levels with the (inverted) unemployment rate.
Full Employment is when everyone who wants a job has one. It is generally considered to be around 3%.
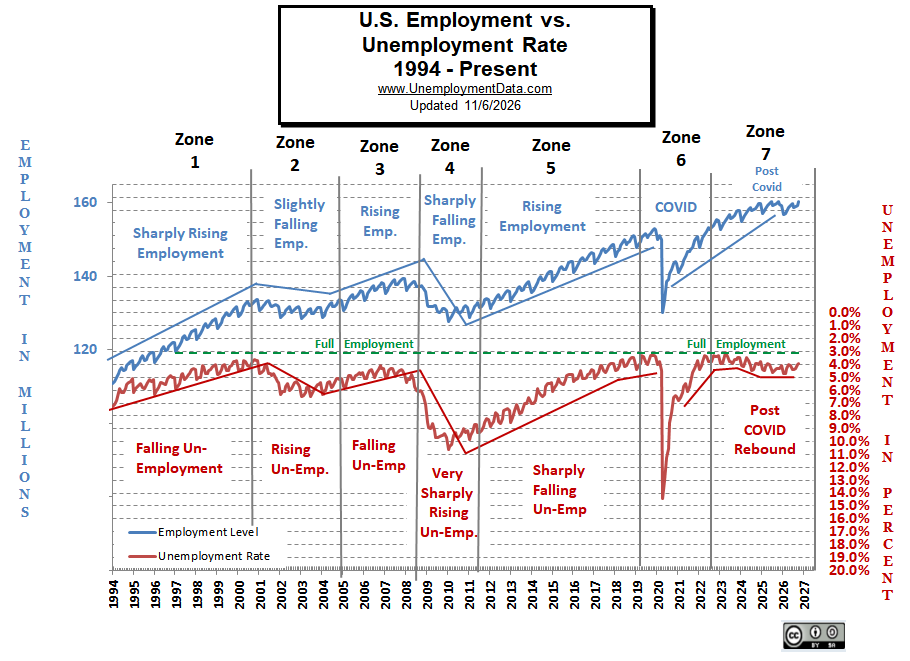
Note: Full employment is not considered to be at zero percent because even when employers are having difficulty finding employees, some people are still unemployed due to either:
- Structural unemployment (mismatch between worker skills and job requirements, i.e., not enough training) or
- Frictional unemployment. There will always be people who have quit or have lost a seasonal job and are in the process of getting a new job.
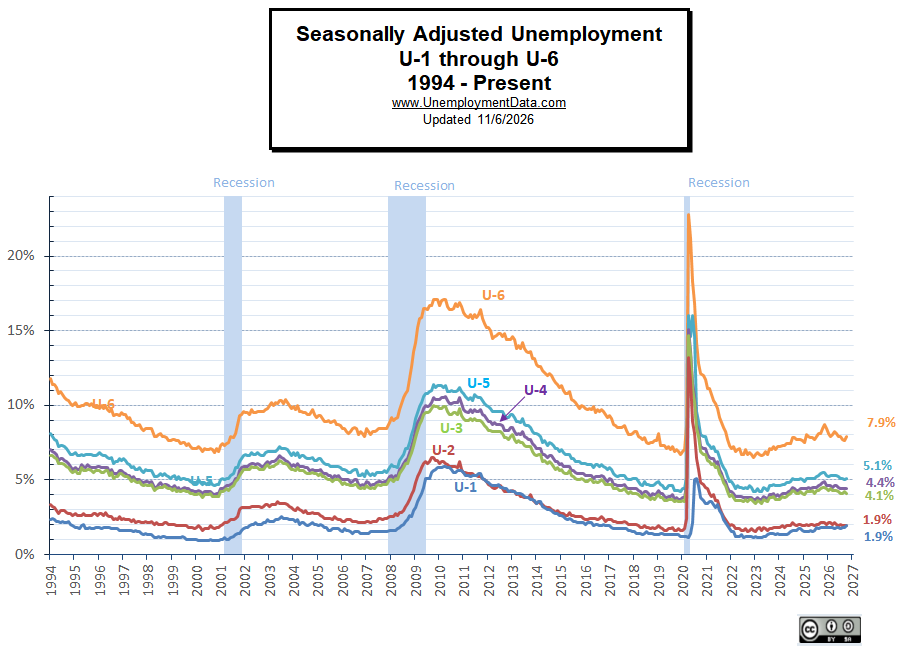
Seasonally Adjusted U1 through U6 Unemployment Rates
Labor Force Participation Rate
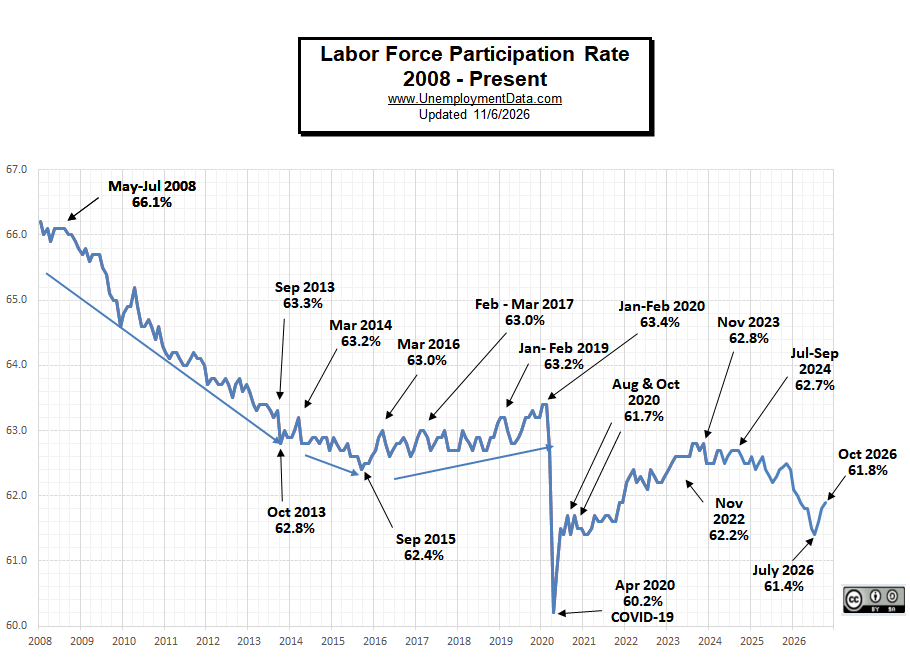
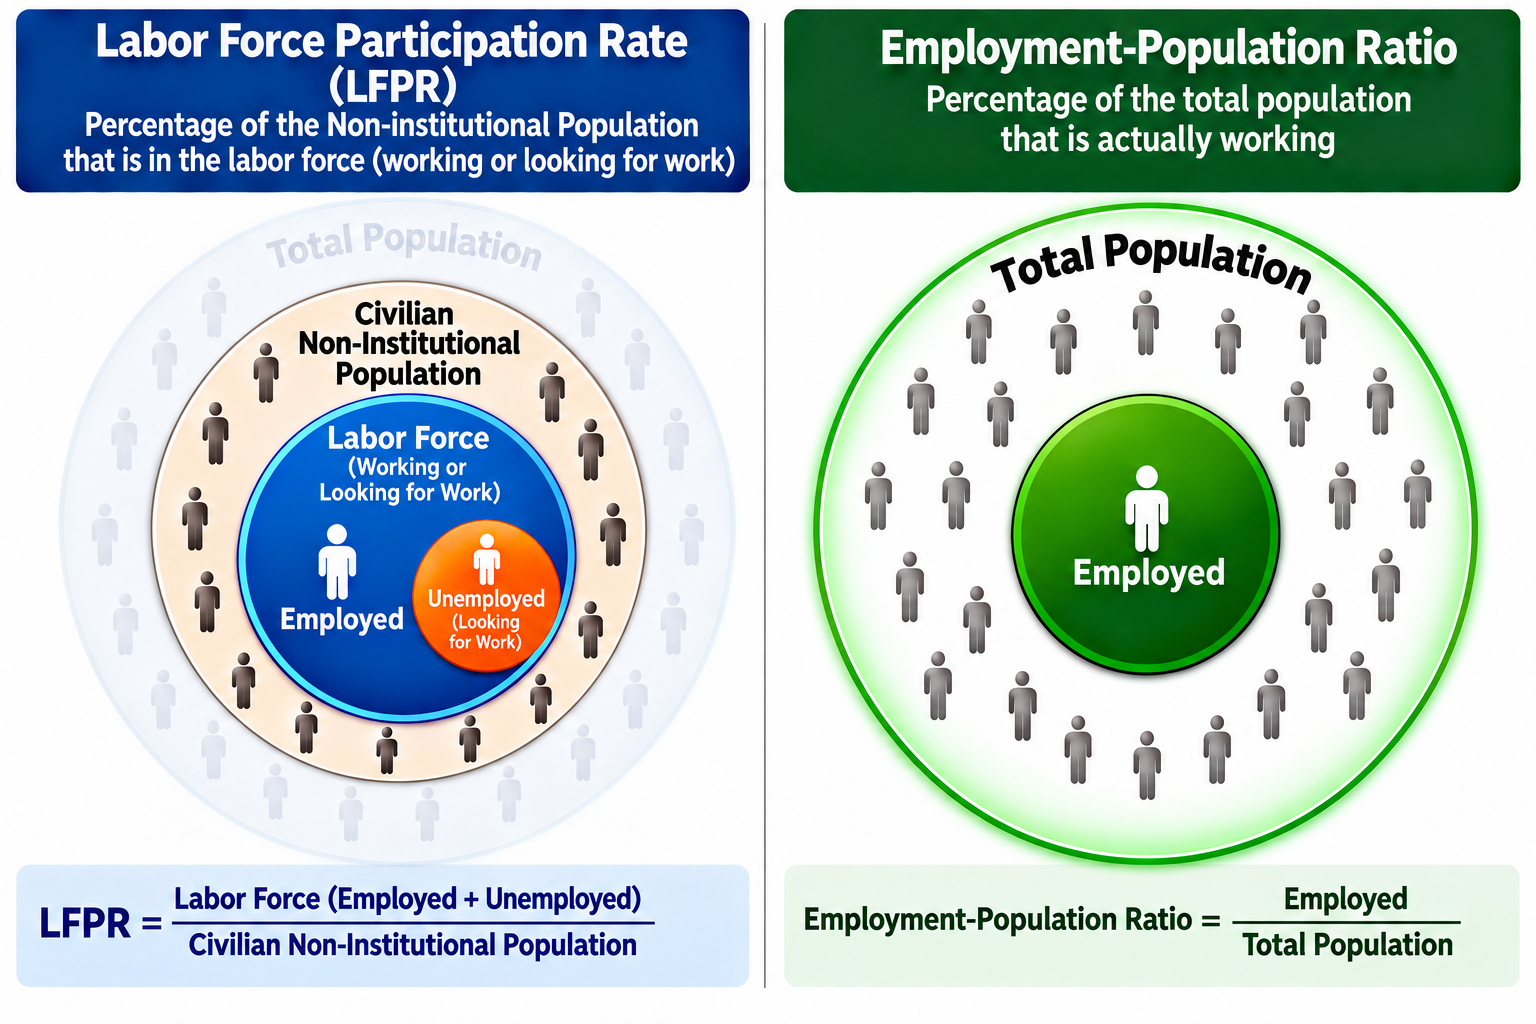
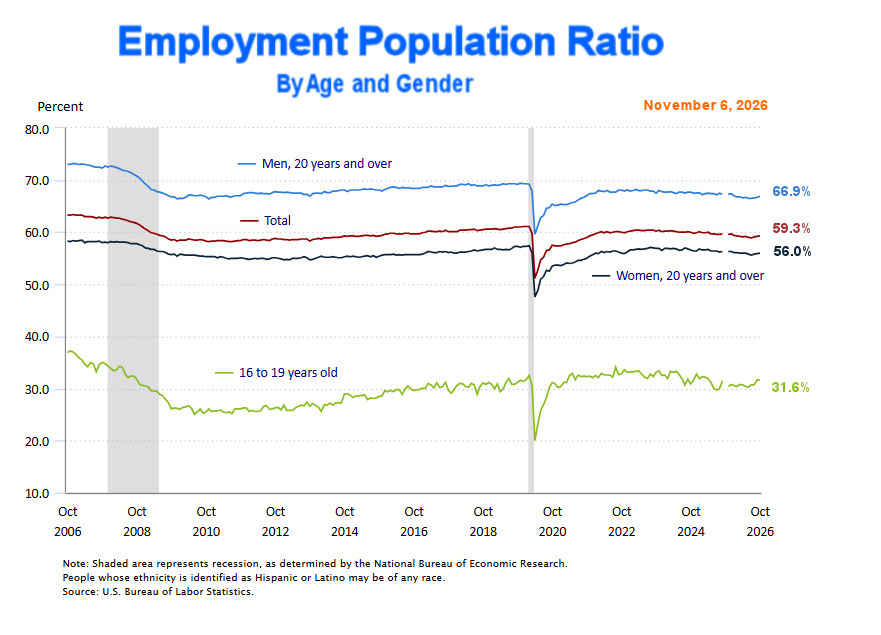
The Labor Force Participation Rate is the percentage of the Non-Institutional Population that makes up the Labor Force.
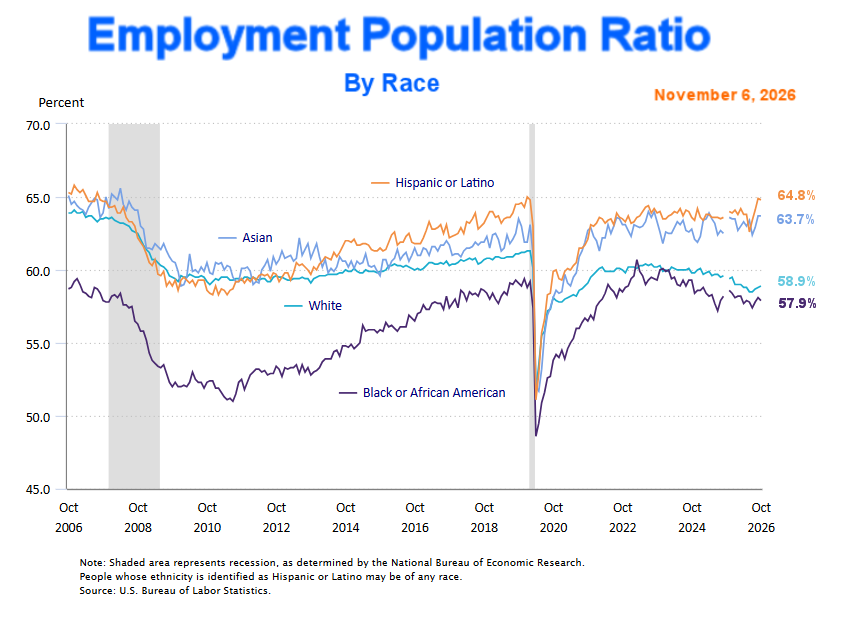
And the Employment – Population Ratio is the percentage of the Total Population that is Employed.
Employment-Population Ratio
By Gender and Age
Employment-Population Ratio by Race
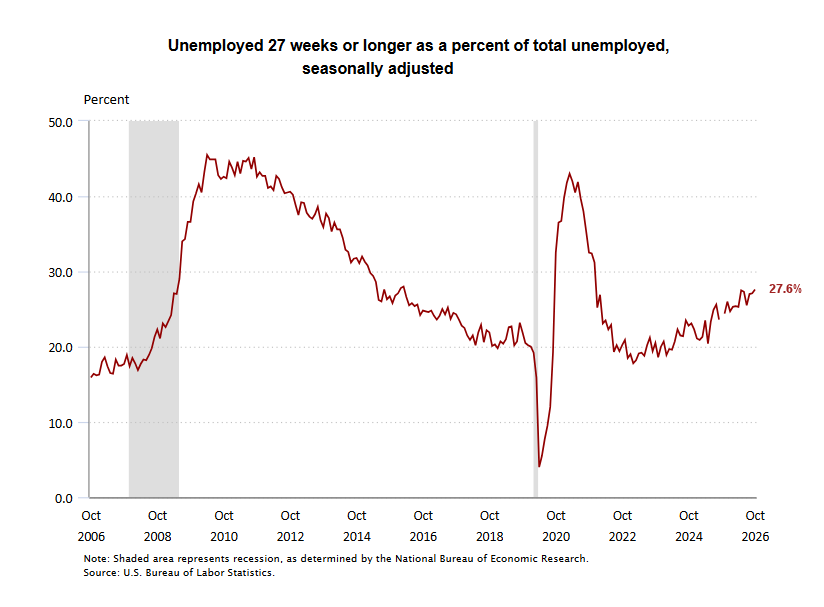
Percent Unemployed 27 weeks or Longer
Those unemployed 27 weeks or longer is creeping up. Currently, 27.6% of all unemployed have been unemployed for more than 6 months.
 Read more on UnemploymentData.com.
From InflationData.com
- September Inflation Spikes on Oil Price Surge
- Fed Raises Rates Into Oil Inflation Shock
- Inflation-Adjusted Gasoline and Oil Prices
From Financial Trend Forecaster
- Moore Inflation Predictor
- NYSE ROC
- NASDAQ ROC
- Crypto ROC Charts
- What Does a “Gigawatt of AI” Really Mean?
- Can Scott Bessent Stop a Bond Market Debt Spiral?
- Nvidia’s $500 Billion AI Financing Strategy Could Reshape the AI Industry
- We May Already Be Living in the Singularity
- Ethereum Generates a “BUY” Signal
- How Affordable Was the 1950s American Dream?
- What Is the K-Shaped Economy? Everything You Need to Know
- The Hidden Cost of “Free” Healthcare and College in Scandinavia

Leave a Reply