• About WordPress
    • WordPress.org
    • Documentation
    • Learn WordPress
    • Support
    • Feedback
  • Log In
  • Skip to primary navigation
  • Skip to main content
  • Skip to primary sidebar
  • Home
  • Contact us
  • Related Sites
    • InflationData.com
    • Financial Trend Forecaster
    • Your Family Finances
    • Elliott Wave University
    • Optio Money
  • About
    • Terms of Use
    • Disclaimer & Disclosure
    • Privacy Statement
  • Sitemap
    • 2009-2010 Posts
    • 2011 Posts

UnemploymentData.com

Your Source for Employment and Unemployment Data

Unemployment
  • Charts
    • Current Unemployment Rate Chart
    • Current Employment Rate (Chart and Data)
    • Current Employment vs Unemployment Chart
    • Historical Employment Data
    • Employment Population Ratio
    • Misery Index
  • Unemployment
    • Historical Unemployment Rate Tables
    • What Is U-6 Unemployment?
    • Unadjusted vs. Seasonally Adjusted U-3 Unemployment Rate
    • BLS vs. Gallup Unemployment Numbers
    • Current U-6 Unemployment Rate
    • What is the Labor Force Participation Rate?
    • What is the Real Unemployment Rate?
  • Employment
    • Current Employment Rate (Chart and Data)
    • Historical Employment Data
    • Contacting a Live Person at the State Employment Commission
      • How to Talk to a Live Person at the Virginia Unemployment Commission
      • Florida’s FLUID Unemployment Program
    • Benefits
      • Insurance
      • Retirement
    • Careers
    • Employment Costs
    • Experience
    • Government
    • Job Hunting
      • Interview
      • Resume
  • Find Articles
  • Education
    • Skills
  • General
    • Small Business
      • Outsourcing
    • Success
You are here: Home / Archives for unemployment rate

unemployment rate

Unemployment and Employment Charts

January 1, 2019 by Tim McMahon

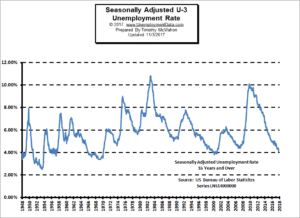
  • Unemployment Rate Chart – The seasonally adjusted unemployment rate from 1948 to the present is one of the most watched statistics. Where is it now and should you trust it?
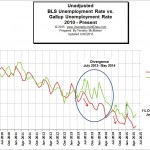
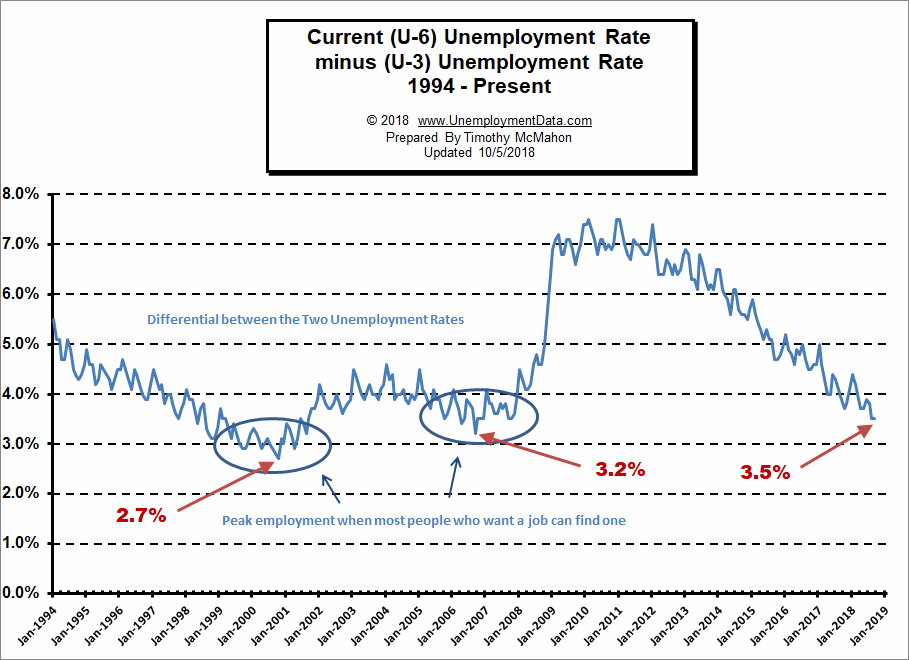
  • Current U-6 Unemployment Rate– Many people consider the U-6 the “real” unemployment rate. See where it is now.
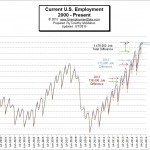
  • Current Employment Data – How many jobs are there actually? This chart shows Employment since Jan 2000 and what the current trend is.
  • Historical Employment Data Chart– How Many People Are Actually Employed? This chart shows the actual employment rate without all the mumbo-jumbo. It gives a clear picture of  the employment level in the United States from 1939 to the Present. When employment is rising the economy is growing. When the employment rate levels off or declines times are not so good. Take a look and see how employment rates correspond to recessions over time.
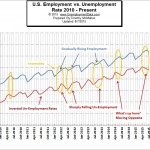
  • Current Employment vs Unemployment Chart When looking at employment vs. unemployment you would think that they are two sides of the same coin but the U.S. Bureau of Labor Statistics (BLS) actually uses two entirely different surveys to calculate them. Looking at both on the same chart we can see some strange anomalies.
  • Misery Index– Created by economist Arthur Okun to help gauge the level of misery the average person is suffering. It is a combination of the inflation rate and the unemployment rate.
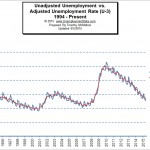
  • Unadjusted vs. Seasonally Adjusted Unemployment Rate– Often it appears that the Seasonally Adjusted numbers are going one way, while the unadjusted numbers are going in the opposite direction. Here is how it looks in chart form.
  • Seasonally Adjusted Unemployment Rate in Table form– If you want to see the actual numbers.
  • Is the Government Fudging Unemployment Numbers? Now there is an alternative measurement. We can also see a discrepancy in the Government’s own numbers by looking at the Employment vs. UnEmployment rate.
  • U-6 is the broadest measure of unemployment and includes all classes of Unemployed plus those ”marginally attached” and/or part-time for economic reasons. See What is the U-6 Unemployment Rate? for more details of all the “U” classifications.
  • What is the “Real” Unemployment Rate? Many economists believe that the popularly quoted Unemployment Rate understates the real unemployment rate because it fails to include workers who would like to work but have given up looking because they don’t think there are any jobs available for them.
  • What is the Labor Force Participation Rate? You might think that the Labor Force Participation Rate [LFPR] would mean the percentage of the population that is working but it doesn’t mean that at all. According to the Bureau of Labor Statistics the “Labor Force” is made up of both employed and unemployed people.  Unemployed people are defined as those who are actively looking for work. Once you stop looking (i.e discouraged workers) you are no longer in the official labor force.


Filed Under: Featured, Unemployment Tagged With: employment rate, employment rate chart, unemployment, unemployment rate, unemployment rate chart

Unemployment Reaches Lowest Point Since 1969

October 6, 2018 by Tim McMahon

Seasonally Adjusted U-3 Unemployment RateAccording to the the U.S. Bureau of Labor Statistics (BLS) monthly unemployment survey results for the month of September 2018 the current “Seasonally Adjusted” Unemployment Rate for September is 3.7% the lowest level since December 1969 when it was 3.5%. Unfortunately, by December 1970 unemployment was up to 6.1%.

The lowest level reached in the 1968-1969 timeframe was 3.4% where it hovered from September 1968 through May 1969. The only other time that unemployment was this low since they began tracking unemployment in 1948 was briefly in 1948 and again in 1951-53.


Jan Feb Mar Apr May Jun Jul Aug Sep Oct Nov Dec
1965 4.9% 5.1% 4.7% 4.8% 4.6% 4.6% 4.4% 4.4% 4.3% 4.2% 4.1% 4.0%
1966 4.0% 3.8% 3.8% 3.8% 3.9% 3.8% 3.8% 3.8% 3.7% 3.7% 3.6% 3.8%
1967 3.9% 3.8% 3.8% 3.8% 3.8% 3.9% 3.8% 3.8% 3.8% 4.0% 3.9% 3.8%
1968 3.7% 3.8% 3.7% 3.5% 3.5% 3.7% 3.7% 3.5% 3.4% 3.4% 3.4% 3.4%
1969 3.4% 3.4% 3.4% 3.4% 3.4% 3.5% 3.5% 3.5% 3.7% 3.7% 3.5% 3.5%
1970 3.9% 4.2% 4.4% 4.6% 4.8% 4.9% 5.0% 5.1% 5.4% 5.5% 5.9% 6.1%

Key September Employment and Unemployment Numbers

  • Adjusted U-3 Unemployment:  3.7% down from 3.9% in August, This is the lowest Seasonally Adjusted Unemployment rate since 1969.
  • Unadjusted U-3 Unemployment:  3.6% down from 3.9% in August and 4.1% in July and 4.2% in June.
  • Unadjusted U-6 Unemployment:   7.1% down from 7.4% in August and 7.9% in July, 8.1% in June, and below record lows of 7.3% in May, and 7.4% in April.
  • Employment: 149.741 million up from 149.226 million originally reported for August.
  • September Labor Force Participation Rate: 62.7% unchanged from August but down from July 62.9%.

See Current Unemployment Chart for more info.

Full Employment is Near – Differential between U3 and U6 nearing September 2006 Lows

Last month we incorrectly reported that the differential between the unadjusted U3 and U6 (reached by subtracting U3 from U6) was at 3.2% when in fact it was only at 3.5% so it still had a little way to go to reach the 3.2% low of September 2006. This month, although both U3 and U6 have fallen the differential remains at the 3.5% level.

U6 minus U3 Unemployment Rate

See Current U-6 Unemployment Rate for more info.

Employment by Sector

The employment “bubble chart” gives us a good representation of how each sector of the economy is doing (employment wise). As we can see from the chart below  [Read more…] about Unemployment Reaches Lowest Point Since 1969

Filed Under: BLS Tagged With: 1969, 2018, Differential, employment, Employment / Population Ratio, Employment by Sector, Labor Force Participation Rate, September, U3 and U6, unemployment rate

Unemployment By State

January 18, 2018 by Tim McMahon

According to the U.S. Bureau of Labor Statistics’ most recent data broken down by state (released in December for the month of November), Hawaii had the lowest unemployment at 2.0% followed by several Western States including North Dakota (2.6%), Nebraska (2.7%), Colorado, Idaho and Iowa all at 2.9%.  Somehow New Hampshire managed to also be among the lowest also at 2.7% with Vermont at 2.9%.

Although California has been touted as having the fastest growing labor force it ranked number 35 in unemployment rates with unemployment at 4.6% well below the national average of 4.1%.

Unemployment by State

The following table lists the  [Read more…] about Unemployment By State

Filed Under: Unemployment Tagged With: State, Unemployment by State, unemployment rate

October Unemployment Rate Down Again

November 4, 2017 by Tim McMahon

On Friday November 3rd the U.S. Bureau of Labor Statistics (BLS) released their monthly employment survey results for the month of October.

According to the BLS, the current “Seasonally Adjusted” Unemployment Rate for October is 4.1% DOWN from 4.2% in September and 4.4% in August. Seasonally Adjusted U-3 unemployment was 4.8% in January and 4.9% a year ago (October 2016).

The current “Unadjusted” rate is 3.9% down from 4.1% in September and 4.5% in August. Unadjusted U-3 was 5.1% in January and 4.7%  a year ago (October 2016).

See: Current Unemployment Rate Chart for more info.

Seasonally Adj U-3 Unemployment Rate

Seasonal adjustment provides something like a moving average leveling out the bumps due to normal seasonal variations. See: Unadjusted vs. Seasonally Adjusted Unemployment Rate for more information about Seasonal Adjustment.

According to the BLS Commissioner’s report for this month:

[Read more…] about October Unemployment Rate Down Again

Filed Under: BLS Tagged With: 2017, BLS, Bureau of Labor Statistics, Current Employment Data, Employment Data, Labor Force Participation Rate, LFPR, October Unemployment, unemployment rate

BLS Releases October Employment Figures

November 6, 2015 by Tim McMahon

Current Unemployment Rate Chart

Unemployment Rate October 2015

According to the latest U.S. Bureau of Labor Statistics (BLS) data release on November 6th the current “Seasonally Adjusted” Unemployment Rate for October is 5.0% down from September’s 5.1% which was down significantly from last October’s 5.8%. The “Unadjusted” rate is 4.8% down from 5.6% in July and much lower than January’s 6.1%. See: Current Chart

According to the BLS, the U-6 Unemployment Rate for October was 9.5%. U-6 unemployment includes short-term discouraged workers who have given up looking for work because they feel there is no work available for them.

However, since 2010, Gallup (the survey/Pollsters) have been  doing their own employment survey using basically the same parameters as the BLS and they conclude that the current U-6 (which they call the “UnderEmployment Rate) is actually 13.8% down from 14.1% in September.

According to John William’s Shadowstats the government began underestimating unemployment back in 1994 when they changed the way unemployment was calculated since “long-term discouraged workers were defined out of official existence”. The new U-6 numbers only include short-term discouraged workers. The following chart shows their calculations for Unemployment based on their estimates of what it would be if unemployment was calculated the pre-1994 way.

Current Employment Data

Employment Levels 2000-2015
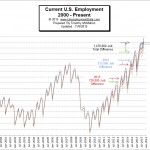
According to the current Bureau of Labor Statistics data, the employment situation for the month of October 2015 was as follows: The number of Unadjusted jobs reported for October 2015 was 143.739 million. That was up from June’s previous peak of 142.836 million.

For more information see: Current Employment Data


Current Employment vs Unemployment Chart

Employment compared to Unemployment
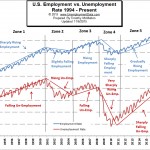
When looking at employment vs. unemployment  you would think that they would simply be the inverse of each other. Flip one over and you have the other. But the U.S. Bureau of Labor Statistics (BLS) actually uses two entirely different surveys to calculate them. So by comparing them we can spot irregularities. See Employment vs. Unemployment for more information.

Historical Employment Data

Employment-1939-2015

In this chart we can see the historical employment figures from 1939 through the present. But in addition to the number of jobs we can also see the recessions shaded blue.

See: Historical Employment Levels for more information.


Misery Index
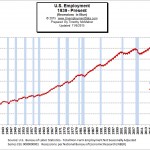
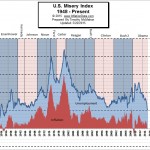
The misery index combines two factors that can make life difficult for people i.e.  unemployment and inflation.  High levels of price inflation (rapidly rising prices) will cause households to have difficulty affording the basic necessities while high unemployment will leave a high percentage of households without any income at all.

See: InflationData’s Misery Index.

Seasonally Adjusted Unemployment Rate

The U-3 Seasonally Adjusted Unemployment Rate is the standard unemployment rate that the government prefers to use since it presents a much rosier picture than the U-6.  Go here if you would like to see the “Unemployment Rate” in table form.

Unadjusted vs. Seasonally Adjusted Unemployment Rate

Adjusted vs unadjusted unemployment rate May 2015

Although the Seasonally Adjusted Unemployment Rate is often quoted by the main stream media (MSM) people often wonder how much fudging goes on in the adjustment process. In this chart you can see how the Seasonally Adjusted Unemployment Rate compares with the Unadjusted rate.

BLS vs Gallup Unemployment Rates

Although it doesn’t appear that there is much “fudging” going on with the Seasonal adjustments that doesn’t mean the numbers are without problems. See Is the Government Fudging the Unemployment numbers for some alternative ways to get a better picture of the employment situation.

See Also:

  • What is U-6 Unemployment for more information about the different definitions of unemployment.
  • Current U-6 Unemployment Rate
  • What is the Real Unemployment Rate?

Filed Under: BLS Tagged With: BLS, employment, unemployment, unemployment rate

July Unemployment Data Released

August 7, 2015 by Tim McMahon

Employment July 2015The BLS issued their “preliminary estimates” for the employment situation for the month of July 2015. Their abbreviated report using seasonally adjusted numbers says, “Total nonfarm payroll employment increased by 215,000 in July, and the unemployment rate was unchanged at 5.3 percent, the U.S. Bureau of Labor Statistics reported today. Job gains occurred in retail trade, health care, professional and technical services, and financial activities.”

The full report of unadjusted numbers states that there were 141.794 million jobs in July down from 142.817 million jobs initially reported in June.  At the same time they revised the numbers for June up to 142.839 million making the real loss of jobs -1,045,000. See Current Employment Commentary for more information.

Unemployment rate July 2015The U.S. Bureau of Labor Statistics (BLS) also released the newest unemployment data for July 2015 today. According to the BLS, the current “Seasonally Adjusted” Unemployment Rate for July is 5.3% the same as June but down from May’s 5.5%. The BLS reported the “Unadjusted” Unemployment Rate is 5.6% which is lower than January’s 6.1% but up from June’s unadjusted 5.5%. See Current Unemployment Chart for more information.

Employment vs. Unemployment ComparisonNormally, you would expect that employment and unemployment should simply be the inverse of each other. Flip one over and you have the other. However, in the chart of employment vs. unemployment we see several anomalies in the data.   Since the U.S. Bureau of Labor Statistics (BLS) actually uses two entirely different surveys to calculate them it helps us see [Read more…] about July Unemployment Data Released

Filed Under: Unemployment Tagged With: July, unemployment, unemployment rate

What is Full Employment?

September 2, 2012 by Chris Keenan

In the world of employment data, unemployment statistics get a lot of attention. They have a huge impact on the economy as a whole and they also affect several other areas. Although a certain percentage of unemployment is the norm in every economy in the world, economic theory has a concept known as full employment. What exactly is full employment and why is it significant to economists?

Full Employment= Job Eutopia

Full employment is a theoretical scenario that occurs when the entire labor force is being used in the most efficient way possible. All of the skilled labor has a job in the field that they want to be in and all of the unskilled labor has a satisfactory job as well. It is possible for an economy to have full employment, although it’s not very easy to pull off.

See Labor Immobility and the Labor Participation Rate for some limiting factors in the pursuit of full employment.

Frictional Unemployment

Although the term “full employment” sounds like everyone is working, that isn’t necessarily the case. Even during times of full employment, there are still some workers who are not working. Most of these people are considered to be in frictional unemployment. What exactly is frictional unemployment? Frictional unemployment is a term that is used to describe those who are in between jobs, but are still in the workplace. For example, if you are working in a job, and you determine that you don’t like your employer, you might decide to quit and look for a new job. During the time period where you are looking for new employment, you are considered to be in [Read more…] about What is Full Employment?

Filed Under: Employment Tagged With: employment, frictional unemployment, full employment, unemployment, unemployment rate, usa, work

Employment vs. Unemployment

May 5, 2012 by Tim McMahon

Employment – Unemployment

Employment vs. unemployment… You would think that they are two sides of the same coin. But when it comes to government stats they may not be.

The government uses two entirely different surveys to calculate Employment and Unemployment and as we will see since 2010 they have started to paint entirely different pictures. A few days ago we looked at how an independent organization (Gallup poles) is now tracking unemployment rates and how the government numbers appear to be understating the level of unemployment. Today we will look at the government’s own numbers and how they don’t even agree with each other… giving more evidence that the government is slanting the data. [Read more…] about Employment vs. Unemployment

Filed Under: General Tagged With: employment, jobs, population, unemployment, unemployment rate

The Difference a Degree Makes in Unemployment Levels

November 18, 2011 by Tim McMahon

The Difference a College Degree Makes

We’re always told by our parents that we need a good education in order to get a good job. And that we will make more money if we have a good education. But these days we hear of unemployed college graduates camping out in New York city and protesting Wall Street because they can’t find jobs. So let’s take a look at the numbers and compare the unemployment rate based on eduation level.  In the following chart we will look at four educational levels. The first level are those people with less than a High School education. The second level are those with a High School diploma. The third level are those with some college education or an associates degree. And finally those with a Four Year College Degree.

College Degree

As we can see from the chart above, obviously the unemployment rate is the highest for those with the least education… as we would expect. Logically if you were an employer you would lay off the least educated employees first because they are more readily replaceable. We can even tell by the numbers the actual difference a high school education makes. The average unemployment rate for the period from 1992 through October 2011 for High School graduates was 5.5% while the average for those who didn’t graduate from High School was 9.2%. So simply by getting a High School education, you decreased your odds of being unemployed drastically with the actual difference being 3.7%.  But if you look at the chart you will see that a High School education was even more valuable than that. The real benefit of being able to get a job is when jobs are scarce, so even though the average difference was 3.7% during bad times, i.e. when the overall unemployment rate is higher the difference climbs even more.

First, let’s look at the difference just a high school education makes. [Read more…] about The Difference a Degree Makes in Unemployment Levels

Filed Under: Education, Unemployment Tagged With: competitive, difference, education, unemployment, unemployment rate

Teen Employment Rate Plunges

July 9, 2011 by Tim McMahon

Only 1 in 4 Teens is Employed

Teenage employment rates have averaged around 45% since the 1950’s but since 2000 the teenage employment rate has plummeted. Currently less than 25% of teenagers can find a job. But don’t worry the government has a plan to create 50,000 new jobs…

So what is this magic plan you might ask?

Teen Employment Rate Plummets

Simple [Read more…] about Teen Employment Rate Plunges

Filed Under: Unemployment Tagged With: employment, minimum wage, teen employment, teen unemployment, unemployment, unemployment rate

  • Page 1
  • Page 2
  • Go to Next Page »

Primary Sidebar

Search Site

Sponsored:

URGENT: These Stocks Stand Poised to Benefit from President Trump's Trade Wars!

As the Trump administration moves ahead with aggressive tariff policies on key imports, the mainstream media is scrambling.

This Free Report - which you can download now - reveals the names and ticker symbols of 5 Stock Poised to Benefit Most from President Trump's Tariff Wars.

Click Here to Download Your FREE Stock Report Now.

Recent Posts

  • April 2025 Employment / Unemployment Report
  • Would More Jobs Help Social Security?
  • March 2025- Employment / Unemployment Report
  • February 2025 Jobs Report
  • January 2025 BLS Employment Report

Resources

  • Bureau of Labor Statistics Current Population Survey Monthly survey of households conducted by the Bureau of Census for BLS. It provides data on the labor force, employment, unemployment, etc.
  • Capital Professional Services Providing web design and development and Internet marketing services
  • Elliott Wave University Using the Elliott Wave Principle to improve investment performance
  • Financial Trend Forecaster Featuring Moore Inflation Predictor, NYSE Rate of Change and NASDAQ Rate of change
  • InflationData.com Inflation calculators, databases, etc.
  • Intergalactic Web Designers Web design and development services
  • Your Family Finances

Articles by Category

Articles by Date

Disclaimer

At UnemploymentData.com we are not registered investment advisors and do not provide any individualized advice. Past performance is not necessarily indicative of future performance and future accuracy and profitable results cannot be guaranteed.

Privacy & Terms of Use

Privacy Statement & Terms of Use

Do Not Sell My Information

Copyright © 2025 · News Pro on Capital Professional Services, LLC. All rights reserved · Log in