The U.S. Bureau of Labor Statistics (BLS) released its employment / unemployment report for July on August 1st, 2025.
Employment / Unemployment
![]()
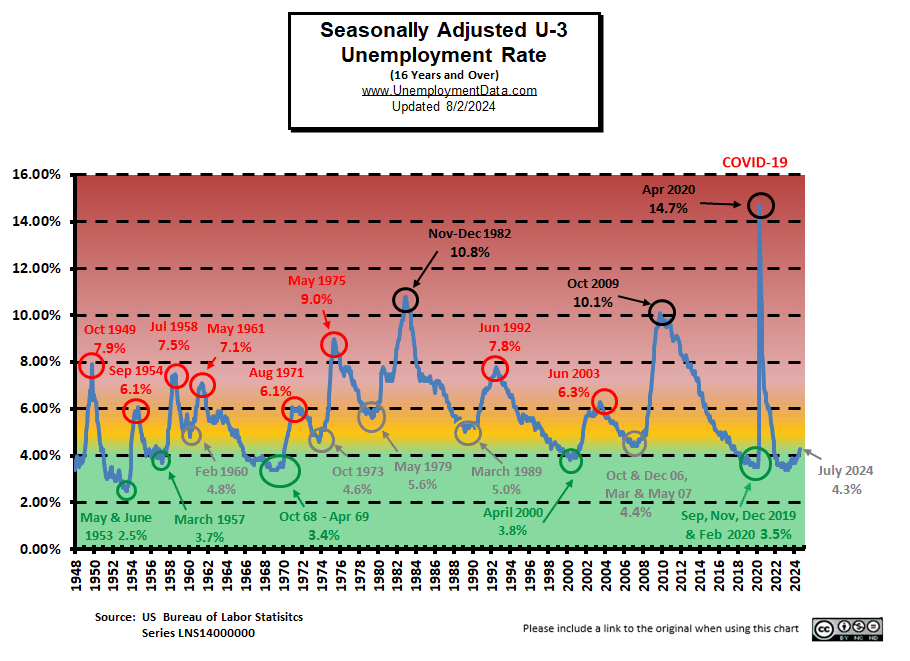
- Seasonally Adjusted U3- 4.2% Up from 4.1%
- Unadjusted U3- 4.6% Up from 4.4% in June
- Unadjusted U6- 8.3% Up from 8.1% in June
- Labor Force Participation Rate- 62.2% Down from 62.3%
- Employment- 159.227 million Down from 160.293 million
- Next data release September 5, 2025
Summary:
Total Employed decreased in July, Unadjusted Unemployment was up, as was Seasonally Adjusted Unemployment. There are a few early warning signs of a slowing Labor Market.
According to the Commissioner of the U.S. Bureau of Labor Statistics:
“Total nonfarm payroll employment changed little in July (+73,000) and has shown little change since April, the U.S. Bureau of Labor Statistics (BLS) reported today. The unemployment rate, at 4.2 percent, also changed little in July. Employment continued to trend up in health care and in social assistance. Federal government continued to lose jobs…
Federal government employment continued to decline in July (-12,000) and is down by 84,000 since reaching a peak in January. (Employees on paid leave or receiving ongoing severance pay are counted as employed in the establishment survey.)”
As usual, they are talking about “Seasonally Adjusted Jobs”.
Looking at the Unadjusted Establishment Survey report, we see…
Originally, the BLS reported employment of 160.475 million for June,
which they adjusted down to 160.293 million as of this month.
They are currently reporting 159.227 million jobs for July, which is actually a monthly decrease of 1,248,000 jobs based on their original numbers or 1,066,000 based on their new numbers.
Early Warning Signs of a Weakening Economy
Although the U3 Seasonally Adjusted Unemployment rate is only up 1/10th of a percent, and the BLS Commissioner tried to put an optimistic spin on it, the number of job openings in the U.S. fell by 275,000 to around 7.4 million last month. So, hiring is slacking off.
Unadjusted Establishment Survey jobs are down by 1,248,000 jobs based on their original June numbers.
The LFPR is down from 62.3% to 62.2%, back to November 2022 levels.
Also, the “Starbucks Indicator” created by Stansberry’s Credit Opportunities editor Mike DiBiase, which says that when Starbucks sales decline for several quarters in a row, the economy is weakening. And that’s exactly what we’re seeing today. Earlier this week, Starbucks reported same-store sales fell 2%. That marked the sixth straight quarter of falling same-store sales.
And, as the Commissioner said, since Government employees scheduled for downsizing are still being paid, they aren’t being counted as unemployed yet, but when their severance pay runs out, that will spike the unemployment rate.
We may be seeing the beginning of an upturn in unemployment in the longer durations, i.e., it is starting to take longer to find a job, 24.9% of those unemployed have been unemployed for 27 weeks or longer.
And finally, looking at the Employment / Population by Race, we see a declining trend in the Employment of Blacks (i.e., the most vulnerable segment of the population). In the chart below, we can see that it has steadily declined for almost two years now. But it sharply declined this month. On the plus side,
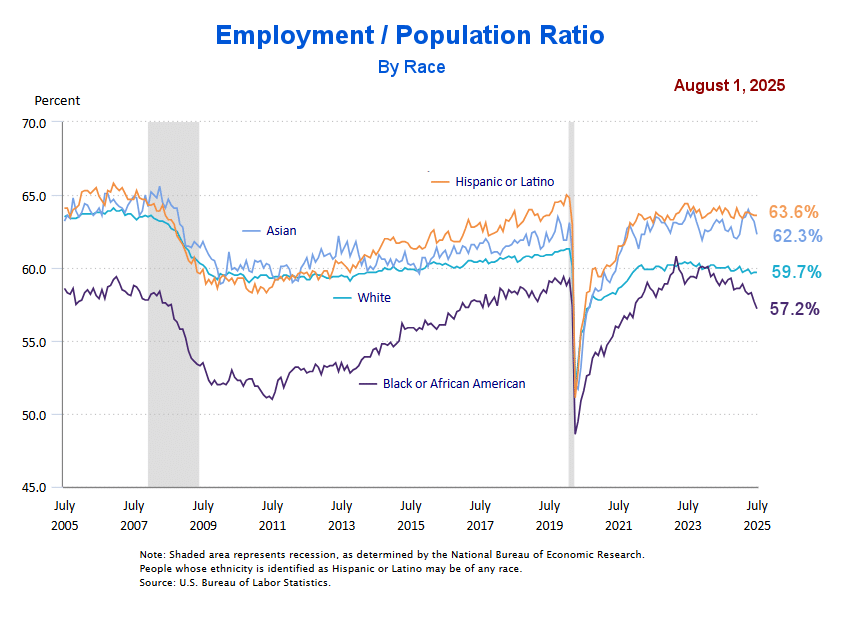
ADP’s Chief Economist says, “Employers have grown more optimistic”.
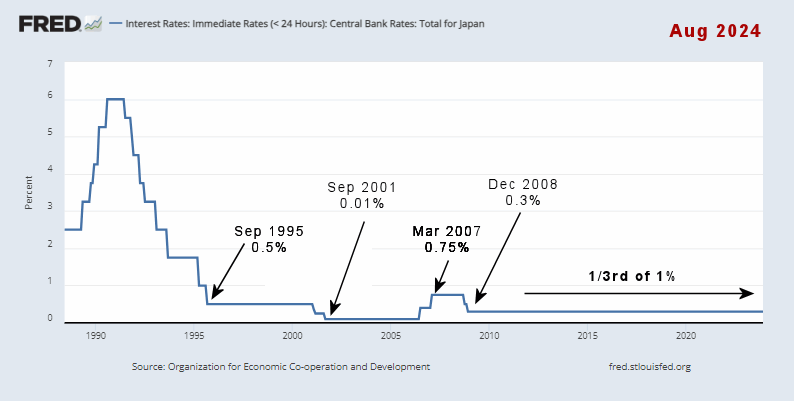
Weakening jobs numbers could force Powell to lower interest rates.
The exodus of illegals should open up more jobs for Americans. According to the WSJ, since mid‑2024, over 1.6 million foreign-born workers have left the U.S. labor force. During the same period, U.S.-born workers added roughly 2.5 million jobs, suggesting a shift toward domestic labor filling openings formerly held by immigrants. One Example:
Also, Trump is negotiating Billions in increased manufacturing investment in the U.S., so in the longer run, jobs should increase, but in the meantime, we may be in for a bit of a rough patch.
Despite these early signs of weakening, FED Chairman Powell didn’t reduce rates at Wednesday’s meeting, citing concerns of rising inflation. But, the market has noted the signs of weakness, and the Futures market has increased the odds of a rate cut in September, from 38% on Wednesday to 85% after Friday’s jobs report.
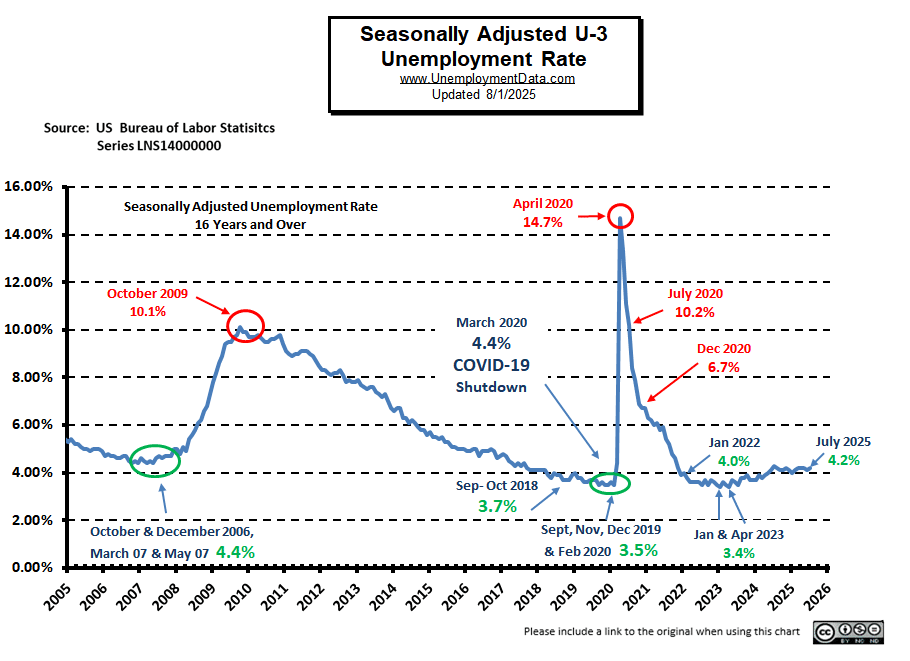
Current Unemployment Rate Chart
Seasonally Adjusted Unemployment is up from 4.1% to 4.2%. As we can see, unemployment is 0.8% above the January and April lows of 2023 but relatively unchanged over the last year.
 [Read more…] about Early Warning Signs of a Weakening Economy in July 2025