![]()
Employment Up – Unemployment Down
- Unadjusted Employment rose from 152.642 million to 153.073
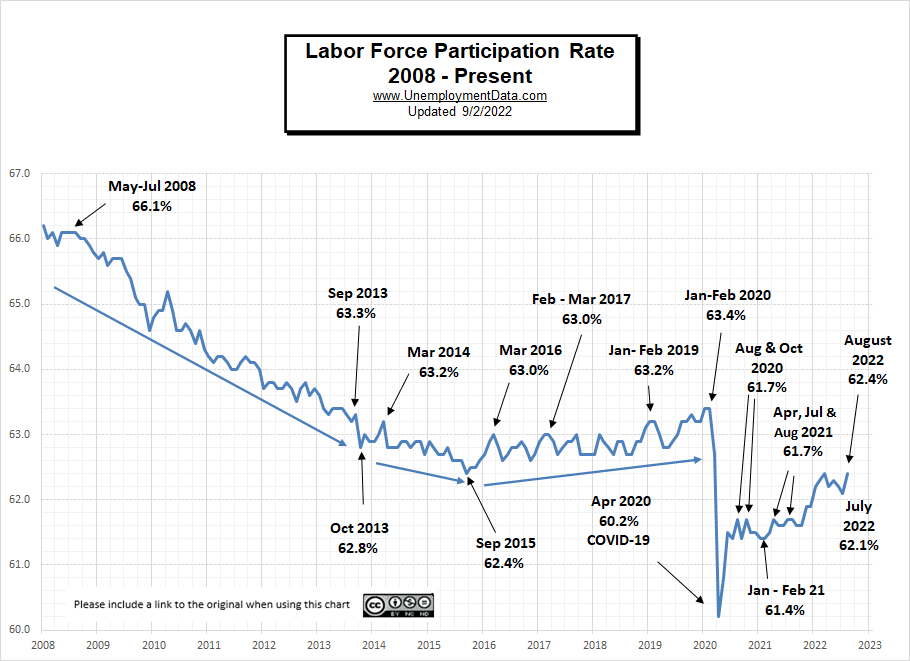
- Labor Force Participation is Down from 62.4% to 62.3%
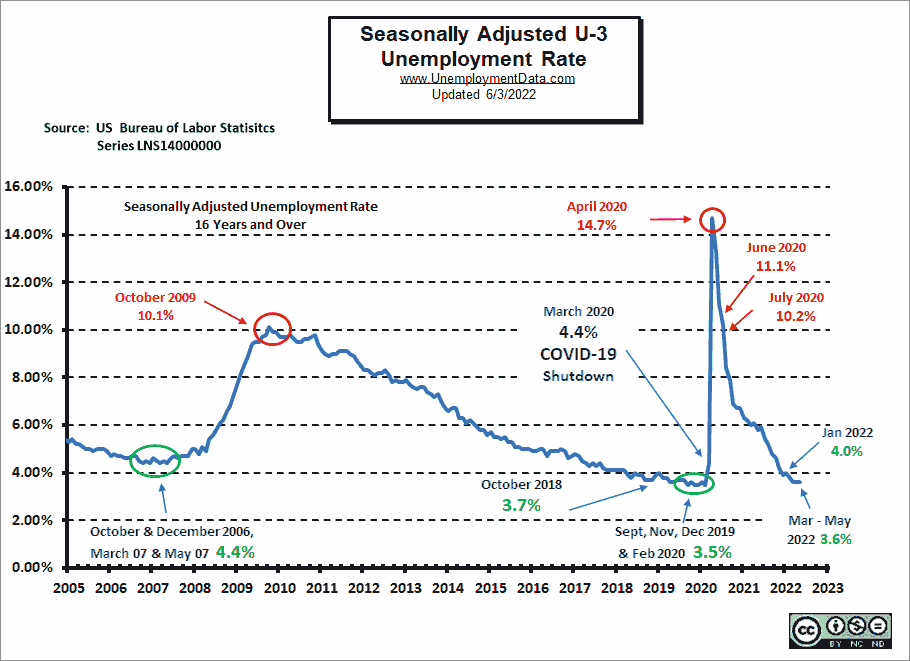
- Adjusted U-3 was Down from 3.7% to 3.5%
- Unadjusted U-3 was Down from 3.8% to 3.3%
- Unadjusted U-6 was Down from 7.0% to 6.4%
The U.S. Bureau of Labor Statistics (BLS) released its employment / unemployment report for September on October 7th.
According to the Commissioner of the U.S. Bureau of Labor Statistics:
“Total nonfarm payroll employment increased by 263,000 in September, and the unemployment rate edged down to 3.5 percent, the U.S. Bureau of Labor Statistics reported today. Notable job gains occurred in leisure and hospitality and in health care.”
You can read the full BLS report here.
As usual, they are talking about “Seasonally Adjusted Jobs” from the “Household Survey” rather than looking at the results reported by actual companies in the BLS “Establishment Survey”.
Looking at the Establishment Survey report, we see…
Originally the BLS reported employment of 152.572 million for August, which they adjusted up to 152.642 million. So, 70,000 additional jobs appeared for August.
September gained an additional 431,000 jobs bringing the total up to 153.073 million.
Normally this would be good news, but perversely the market was hoping for a bad report which would indicate that the FED could cut back on its tightening.
A good September 2022 Unemployment report means inflation is not yet under control, so the FED will continue aggressively tightening.
According to Bloomberg:
“The US labor market stayed strong in September as the unemployment rate unexpectedly returned to an historic low, leaving the inflation-phobic Federal Reserve on course to deliver yet another aggressive interest-rate hike.”
In response, the NYSE lost just over 2% of its value on Friday after the release of the report.
However, just 4 days earlier, on Monday, the BLS had released its “Job Openings and Labor Turnover Survey” for August, which in the minds of schizophrenic market analysts, appeared to indicate that the Labor market might possibly be softening just a little, and the market used that as an excuse to rally. So the NYSE opened the week at 13,472… rallied to 14,340… then fell back to 13,798 for the week. (Actually, a 2.4% net gain for the week).
NOTE: The reason we look at the NYSE rather than the more commonly quoted DOW is breadth. The NYSE covers the vast majority of U.S. stocks rather than just a few major ones covered by the DOW.
ADP® National Employment Report
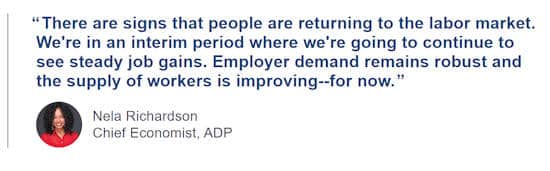
According to ADP In collaboration with Stanford Digital Economy Lab
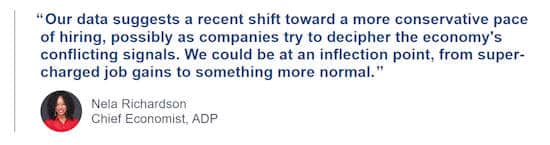
- Businesses created 208,000 jobs in September, up from a revised 185,000 in August, as schools reopened and pandemic concerns receded. But while job growth is stable, it remains below the recent three-month average.
In other words, jobs are still growing but not as fast as they have been. Despite this slowing of job growth and the FED tightening, ADP’s Chief Economist Nela Richardson believes jobs will continue to grow.
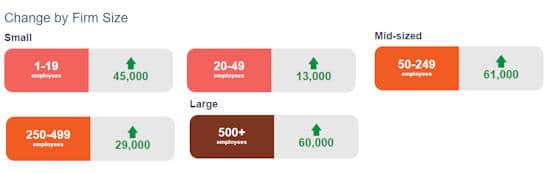
ADP also lists increases by “firm size”.
At some point, it may look like small-size firms (i.e. 1-19 employees) are increasing, while everything else is decreasing, but that could simply be the result of people starting companies because they can’t find any other jobs (although this isn’t currently the case). Currently, there are increases across the board.
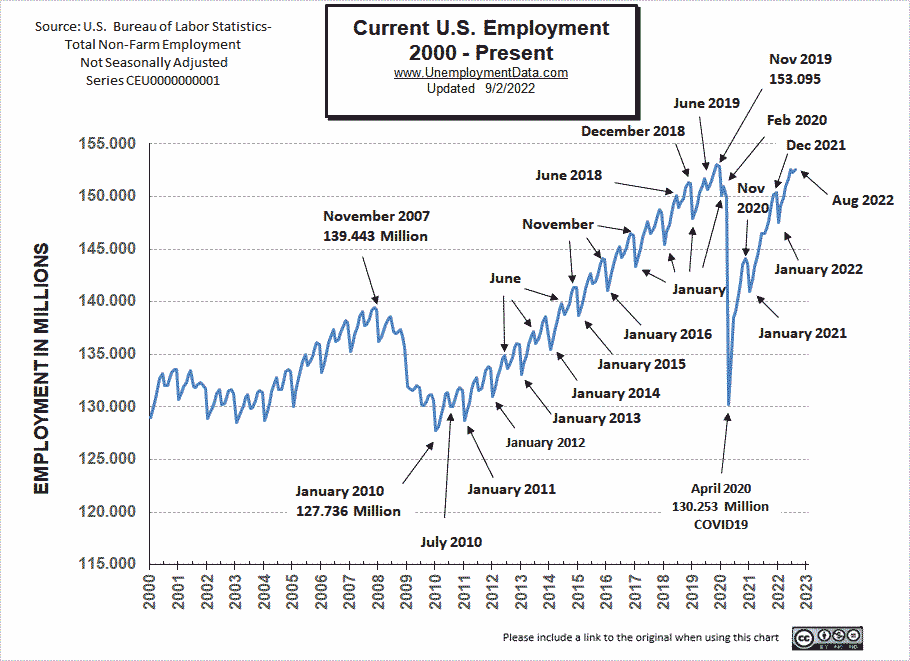
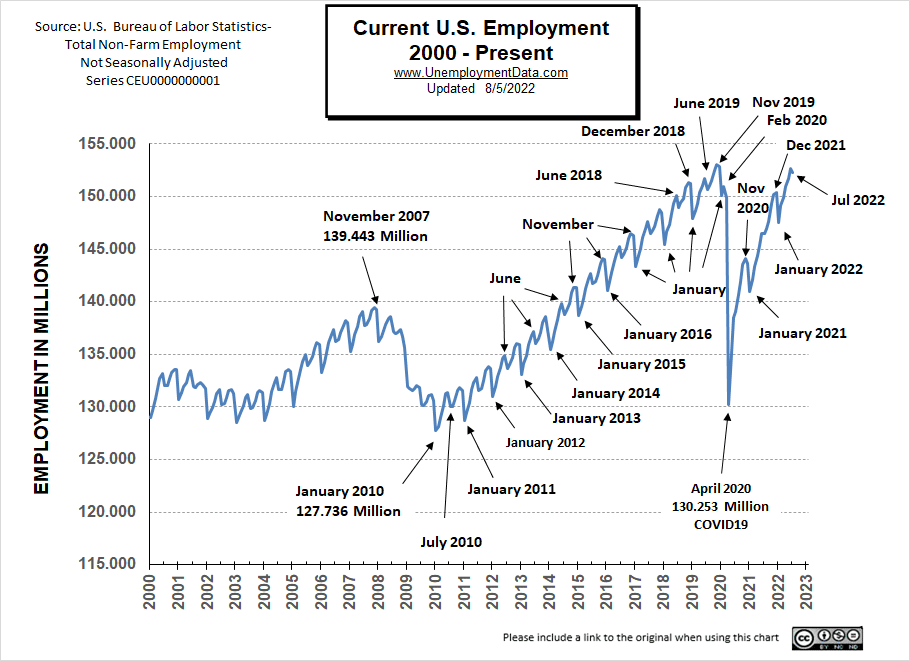
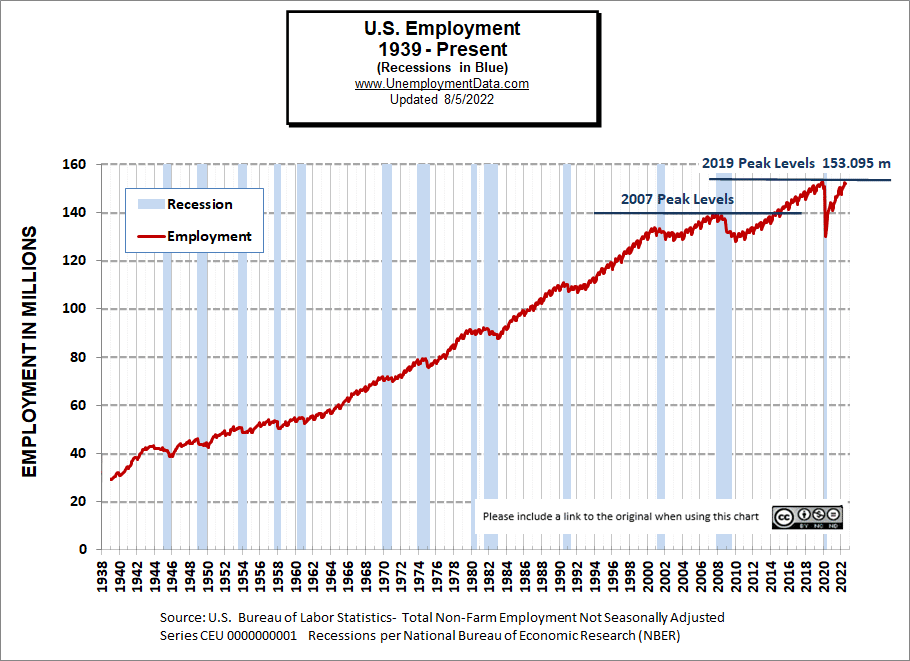
Establishment Survey Employment
Looking at the chart for employment, we see that current employment (153.073 million) is just a hair under the 2019 peak (153.095 million) although the civilian population is almost 5 million higher now. So despite all the talk of the strong employment situation, there is a slight disconnect.
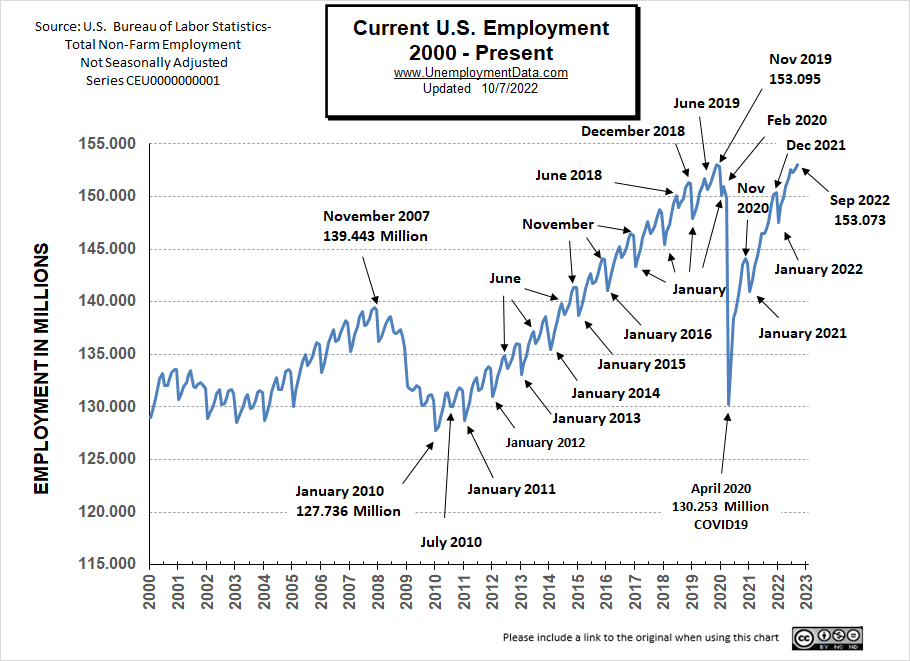
See Current Employment for more info.
[Read more…] about September Unemployment Falls… Dragging Market Down