• About WordPress
    • WordPress.org
    • Documentation
    • Learn WordPress
    • Support
    • Feedback
  • Log In
  • Skip to primary navigation
  • Skip to main content
  • Skip to primary sidebar
  • Home
  • Contact us
  • Related Sites
    • InflationData.com
    • Financial Trend Forecaster
    • Your Family Finances
    • Elliott Wave University
    • Optio Money
  • About
    • Terms of Use
    • Disclaimer & Disclosure
    • Privacy Statement
  • Sitemap
    • 2009-2010 Posts
    • 2011 Posts

UnemploymentData.com

Your Source for Employment and Unemployment Data

Unemployment
  • Charts
    • Current Unemployment Rate Chart
    • Current Employment Rate (Chart and Data)
    • Current Employment vs Unemployment Chart
    • Historical Employment Data
    • Employment Population Ratio
    • Misery Index
  • Unemployment
    • Historical Unemployment Rate Tables
    • What Is U-6 Unemployment?
    • Unadjusted vs. Seasonally Adjusted U-3 Unemployment Rate
    • BLS vs. Gallup Unemployment Numbers
    • Current U-6 Unemployment Rate
    • What is the Labor Force Participation Rate?
    • What is the Real Unemployment Rate?
  • Employment
    • Current Employment Rate (Chart and Data)
    • Historical Employment Data
    • Contacting a Live Person at the State Employment Commission
      • How to Talk to a Live Person at the Virginia Unemployment Commission
      • Florida’s FLUID Unemployment Program
    • Benefits
      • Insurance
      • Retirement
    • Careers
    • Employment Costs
    • Experience
    • Government
    • Job Hunting
      • Interview
      • Resume
  • Find Articles
  • Education
    • Skills
  • General
    • Small Business
      • Outsourcing
    • Success
You are here: Home / Archives for Employment / Government

Government

Why Consumer Sentiment Fell To A Seven-Month Low

June 25, 2024 by Daniel Lacalle

Consumer SentimentThe University of Michigan Consumer Sentiment Survey plummeted to its lowest level in seven months. The index reading for June came in at 65.6, down from 69.1 in May and under the consensus expectation of 72. In the current conditions and expectations categories, the survey fell below economists’ expectations.

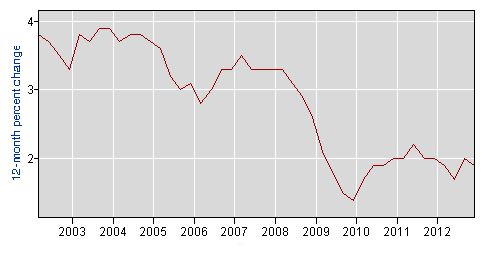
Year-ahead inflation expectations were unchanged this month at 3.3%, but above the 2.3–3.0% range seen in the two years prior to the pandemic, according to the press release. Long-run inflation expectations rose from 3.0% last month to 3.1% in June, significantly above the 2.2-2.6% range seen in the two years pre-pandemic. This survey indicates how weak the U.S. economy is and how consumers are feeling the persistent inflation.

Joe Biden posted on X “Zero. That was monthly inflation in May. There is more to do still, but this is welcome progress.” Inflation was 3.3% in May, and services, shelter, and electricity increased by 5.3%, 5.4%, and 5.9%, respectively. A zero increase in June in the CPI reading is not zero inflation in the month. Consumers in America may find these optimistic messages exaggerated and almost propagandistic. Furthermore, CPI inflation should have been significantly lower, close to 2%, months ago. Is it welcome progress, as the president says? Not really. However, the underlying message of the X post is probably closer to “it could have been worse.”. [Read more…] about Why Consumer Sentiment Fell To A Seven-Month Low

Filed Under: Government Tagged With: Consumer Debt, Consumer Sentiment

4 Reasons to Consider a Career as a Civil Servant

November 29, 2017 by Tim McMahon

“Civil servants” are employees that work under the local and national government to render services to the public. The state offers numerous services that the public continually requires, therefore considering taking up a career in civil service can be a wise move. People working in civil service, more often than not, have financial stability and are less likely to be laid off during an economic downturn. Here are some four reasons why you should start up a career as a civil servant.

Good Salary

Depending on the position you are holding of course, but most civil servant positions enjoy better than average salaries and benefits. This hasn’t always been the case. Years ago civil servants could expect lower than average salaries in exchange for more stability and less likelihood of being laid off. In recent years however, civil servant salaries have risen to be more comparable to industry averages. The U.S. Bureau of Labor Statistics has published a guide called, “How to get a job in the Federal Government“. That states “With more than 1.7 million jobs and over 400 occupational specialties (excluding postal service and military workers), the Federal Government offers more choices than any other single employer in the United States. Whatever your interest and background, you can probably find a Government career to match.”

The Availability of Jobs Is Consistent

Getting a job in the civil service sector can be a good option if [Read more…] about 4 Reasons to Consider a Career as a Civil Servant

Filed Under: Government Tagged With: Civil Servant, Government Jobs

Don’t Let Your Social Security Claim Be Denied

April 30, 2017 by Tim McMahon

Social Security Claim DeniedDo you need to apply for social security disability or retirement benefits? In some cases, these claims are denied. To avoid a social security claim denial, be sure to follow the application instructions exactly. For Disability claims go to https://www.ssa.gov/disabilityssi/

You can log in or create a “my Social Security” account to check the Status of Your Application online.

Your application status shows:

  • Your Re-entry number for pending online benefit application or online appeal that has not been submitted;
  • The date they received your application or appeal;
  • Scheduled Hearing date and time;
  • Current claim or appeal location including the address of the office processing your application; and
  • If a decision has been made.

You cannot check the status of your application online if you do not have a my Social Security account. 

According to Motley Fool, “one-third of disability applications are denied” and they provide 8 Reasons Your Application Might be Denied. The top 2 reasons are:

1. You don’t have enough “working credits” to qualify.

2. You make too much money.

To properly file a claim or appeal a decision, you may need to:
[Read more…] about Don’t Let Your Social Security Claim Be Denied

Filed Under: Government Tagged With: Claim, Denied, Social Security

BLS Recovering From Shutdown

October 19, 2013 by Tim McMahon

The government shutdown is over and the U.S. Bureau of Labor Statistics is recovering from their unscheduled vacation. The United States federal government shutdown of 2013, lasted from October 1 to 17, 2013. Unemployment data for the month of September was due to be released on October 4th i.e. four working days into the shutdown.

Capitol-SenateSo the employment data is now scheduled for release on October 22nd. And the Consumer Price Index which is used to calculate the inflation rate, which was scheduled for release on October 16th is now scheduled for release on October 30th.

Although the shutdown inconvenienced vacationers wanting to see National Monuments and the National Zoo, did it really save any money? If past shutdowns are any indicator… probably not. Government employees will probably [Read more…] about BLS Recovering From Shutdown

Filed Under: Government Tagged With: BLS, government, Shut-down

Overtime and the Law

September 14, 2013 by Guest Contributor

Knowing Your Rights as an Employee

Employment law is an area that every employee needs to have at least a basic understanding of to ensure they are being treated fairly, that their employer is adhering to the law and that they also receiving all of the right entitlements.

Know overtime pay lawsAlthough it is the employers responsibility to pay you what you are owed, you need to take responsibility to make sure that you are aware of all of the laws which may affect you. In many cases, the employer may try to hide certain areas of the law in an attempt to save money. There have been hundreds of reported cases of employers mistreating members of staff and breaking the law at the same time. [Read more…] about Overtime and the Law

Filed Under: Government Tagged With: employment laws, overtime

The Claptrap Behind the Minimum Wage Debate

August 10, 2013 by Guest Contributor

By Bill Bonner

Can Money Buy You Happiness?

Not that we care especially about money. We are more interested in what it represents… and how it helps us understand the world we live in.

Money establishes a relationship between people. One owes. One is owed. One can buy. One must sell. One employs. Another is employed. [Editor’s Note: Money also makes people more efficient. Imagine how wasteful and polluted the world would be if everyone had unlimited amounts of money.]

Sirius

You don’t really need much to live. Food, clothing, shelter, a WiFi connection. After you have the basics everything else is no longer about survival. It’s about status: the relationship between you and your fellow men.

It takes more than money to live well. You could live much better than most people live… on little money. Just get a quaint cottage in West Virginia. Plant a nice garden. And learn to cook!

But most people figure they need more money. They want large suburban houses, sleek automobiles, mobile phones and big-screen TVs… not to mention health insurance.

Poverty-Level Pay

You can buy that sort of stuff by getting a job that pays well. But why do so many jobs pay so poorly? [Read more…] about The Claptrap Behind the Minimum Wage Debate

Filed Under: Employment Costs, Government Tagged With: minimum wage

BLS Changes Employment Numbers

April 5, 2013 by Tim McMahon

For a few months now I’ve been ranting about how there is no way that the Unemployment numbers are right because they don’t match up with the employment numbers. A while back, I got an angry email from a subscriber saying that he “worked for the Treasury Department for 35  years and there was no way the BLS fudged any numbers.”  So I responded and said I’d be happy to post his rebuttal if he could explain how those numbers could possibly match up… I’m still waiting for his response.

Fudging NumbersIn February, I got an answer, not directly mind you, but when I looked at the January Employment numbers they have magically changed all the way back to July of 1991. Yes, “unadjusted” employment numbers have been adjusted, changed, fudged, manipulated whatever you want to call it.

In July 1991 and preceding, the numbers are the same. In August 1991, the difference is minuscule only 1000 mysterious jobs have been added. But the difference continues to grow. And by December of 2012 the old number was 134.822 million and the new number is 135.545 million so somehow magically the BLS has created 723,000 jobs out of thin air.

Who do they think they are to create  Jobs out of thin air, the FED?

We know the FED can create money out of thin air, so maybe the BLS can do the same with jobs?

By the way the BLS does say that the numbers are “Preliminary” for 2 months so theoretically they could legitimately adjust the November and December numbers… but going all the way back to 1991 is a bit much! But, if I were to fudge numbers that is exactly what I would do …gradually adjust them from way back so there isn’t a sharp disconnect between the old series and the new.

Here is a chart of the old employment vs. new fudged numbers since 2000.

Note where the 738,000 jobs difference occurs.

Fudged Employment Numbers

 Click for larger image

I contacted the Bureau of Labor Statistics and asked why the numbers were changed. I received a curt reply pointing me to the “answer” on their website. It starts out with all this mumbo-jumbo about this minor change from April 2010 – March 2011 and goes on for a couple of paragraphs about it and then they slide in one key sentence with no fanfare “oh by the way we changed all the employment numbers back to 1991 too.”

Here is the BLS Response:

Reconstructed data

In order to provide a continuous and comparable employment time series, CES decided to reconstruct the history for one CES series, 55-524126 Direct property and casualty insurers, impacted by the changes to noncovered employment incorporated with the 2011 benchmark (see www.bls.gov/ces/cesbmart11.pdf). CES determined that the history of this series did not capture a significant amount of noncovered employment and instead showed a level shift in the series from April 2010 to March 2011, where the noncovered employment, calculated from County Business Patterns (CBP) data, was first included. CES uses CBP data to calculate the majority of noncovered employment. The CBP — which draws from Social Security filings and other records which do include those employees not covered by UI tax laws — is lagged in its publication by approximately two years (e.g. in 2012 the 2010 CBP data was published). For more information about calculating noncovered employment, see bls.gov/web/empsit/cestn.htm#NCE

CBP data was used to reconstruct AE data for CES series 55-524126 back to 1991 in order to incorporate the noncovered employment in the history. From the reconstructed AE data, the remaining published data types were produced using the previously published sample ratios.

This reconstruction also resulted in revisions back to 1991 for the associated aggregate series, including but not limited to Total nonfarm, in the associated data types.

So even though according to the BLS they survey employers to find out how many people are employed they somehow figure they aren’t counting everyone, so they need to fudge the numbers except they call it “reconstructing” because they somehow aren’t counting all the “Property and Casualty insurers”. So back in 1991 this was 1000 and now they are missing 3/4 of a million of them.  Sounds like the Property and Casualty business must be booming to go from 1,000 to 738,000 since 1991. (Emphasis mine- the BLS did not bold the statement.)

 The following table includes all the original numbers and the new changed employment numbers from July 1991 through the current data. Note that in July 1991 and prior the numbers are identical. This data series is called “Not Seasonally Adjusted Numbers” Series CEU0000000001 but it seems a bit hypocritical to call them unadjusted at this point.

Date New Data In Millions Original Data In Millions Difference
Jul-1991 107.982 107.982 0
Aug-1991 108.074 108.073            1,000
Sep-1991 108.791 108.785            6,000
Oct-1991 109.160 109.153            7,000
Nov-1991 109.175 109.166            9,000
Dec-1991 109.058 109.047          11,000
Jan-1992 106.671 106.659          12,000
Feb-1992 106.921 106.906          15,000
Mar-1992 107.440 107.424          16,000
Apr-1992 108.276 108.259          17,000
May-1992 109.083 109.065          18,000
Jun-1992 109.571 109.554          17,000
Jul-1992 108.554 108.537          17,000
Aug-1992 108.610 108.591          19,000
Sep-1992 109.394 109.372          22,000
Oct-1992 109.981 109.959          22,000
Nov-1992 110.223 110.200          23,000
Dec-1992 110.212 110.188          24,000
Jan-1993 108.047 108.021          26,000
Feb-1993 108.650 108.625          25,000
Mar-1993 109.083 109.057          26,000
Apr-1993 110.087 110.060          27,000
May-1993 111.050 111.021          29,000
Jun-1993 111.640 111.611          29,000
Jul-1993 110.771 110.742          29,000
Aug-1993 110.880 110.847          33,000
Sep-1993 111.868 111.831          37,000
Oct-1993 112.530 112.493          37,000
Nov-1993 112.878 112.837          41,000
Dec-1993 113.025 112.980          45,000
Jan-1994 110.777 110.730          47,000
Feb-1994 111.357 111.308          49,000
Mar-1994 112.332 112.283          49,000
Apr-1994 113.412 113.363          49,000
May-1994 114.423 114.376          47,000
Jun-1994 115.211 115.170          41,000
Jul-1994 114.265 114.226          39,000
Aug-1994 114.573 114.535          38,000
Sep-1994 115.631 115.591          40,000
Oct-1994 116.256 116.217          39,000
Nov-1994 116.863 116.826          37,000
Dec-1994 116.900 116.861          39,000
Jan-1995 114.591 114.552          39,000
Feb-1995 115.249 115.212          37,000
Mar-1995 116.005 115.971          34,000
Apr-1995 116.838 116.802          36,000
May-1995 117.562 117.524          38,000
Jun-1995 118.277 118.242          35,000
Jul-1995 117.044 117.008          36,000
Aug-1995 117.307 117.269          38,000
Sep-1995 118.221 118.180          41,000
Oct-1995 118.822 118.780          42,000
Nov-1995 119.060 119.016          44,000
Dec-1995 119.058 119.015          43,000
Jan-1996 116.358 116.315          43,000
Feb-1996 117.296 117.252          44,000
Mar-1996 118.099 118.055          44,000
Apr-1996 118.936 118.890          46,000
May-1996 120.063 120.016          47,000
Jun-1996 120.726 120.681          45,000
Jul-1996 119.689 119.643          46,000
Aug-1996 119.981 119.932          49,000
Sep-1996 120.724 120.672          52,000
Oct-1996 121.441 121.384          57,000
Nov-1996 121.899 121.841          58,000
Dec-1996 121.875 121.815          60,000
Jan-1997 119.331 119.269          62,000
Feb-1997 120.191 120.126          65,000
Mar-1997 121.073 121.007          66,000
Apr-1997 122.047 121.979          68,000
May-1997 123.125 123.053          72,000
Jun-1997 123.772 123.700          72,000
Jul-1997 122.786 122.710          76,000
Aug-1997 122.853 122.772          81,000
Sep-1997 123.857 123.770          87,000
Oct-1997 124.760 124.673          87,000
Nov-1997 125.153 125.063          90,000
Dec-1997 125.289 125.195          94,000
Jan-1998 122.736 122.636        100,000
Feb-1998 123.508 123.405        103,000
Mar-1998 124.227 124.122        105,000
Apr-1998 125.265 125.160        105,000
May-1998 126.345 126.240        105,000
Jun-1998 127.005 126.902        103,000
Jul-1998 125.931 125.832          99,000
Aug-1998 126.170 126.069        101,000
Sep-1998 126.977 126.874        103,000
Oct-1998 127.754 127.650        104,000
Nov-1998 128.155 128.051        104,000
Dec-1998 128.322 128.215        107,000
Jan-1999 125.570 125.460        110,000
Feb-1999 126.557 126.445        112,000
Mar-1999 127.269 127.158        111,000
Apr-1999 128.415 128.305        110,000
May-1999 129.284 129.176        108,000
Jun-1999 130.010 129.906        104,000
Jul-1999 129.140 129.039        101,000
Aug-1999 129.194 129.093        101,000
Sep-1999 129.970 129.866        104,000
Oct-1999 130.904 130.803        101,000
Nov-1999 131.364 131.263        101,000
Dec-1999 131.501 131.402          99,000
Jan-2000 128.862 128.763          99,000
Feb-2000 129.525 129.427          98,000
Mar-2000 130.624 130.526          98,000
Apr-2000 131.622 131.526          96,000
May-2000 132.577 132.481          96,000
Jun-2000 133.089 132.998          91,000
Jul-2000 131.869 131.776          93,000
Aug-2000 131.880 131.786          94,000
Sep-2000 132.547 132.449          98,000
Oct-2000 133.104 133.007          97,000
Nov-2000 133.467 133.371          96,000
Dec-2000 133.405 133.308          97,000
Jan-2001 130.527 130.433          94,000
Feb-2001 131.190 131.097          93,000
Mar-2001 131.780 131.689          91,000
Apr-2001 132.185 132.094          91,000
May-2001 132.890 132.800          90,000
Jun-2001 133.267 133.179          88,000
Jul-2001 131.776 131.687          89,000
Aug-2001 131.704 131.614          90,000
Sep-2001 131.968 131.872          96,000
Oct-2001 132.168 132.072          96,000
Nov-2001 131.976 131.880          96,000
Dec-2001 131.591 131.491        100,000
Jan-2002 128.706 128.602        104,000
Feb-2002 129.174 129.069        105,000
Mar-2002 129.778 129.672        106,000
Apr-2002 130.364 130.257        107,000
May-2002 131.131 131.023        108,000
Jun-2002 131.511 131.404        107,000
Jul-2002 130.068 129.960        108,000
Aug-2002 130.153 130.044        109,000
Sep-2002 130.670 130.557        113,000
Oct-2002 131.339 131.227        112,000
Nov-2002 131.458 131.345        113,000
Dec-2002 131.045 130.932        113,000
Jan-2003 128.358 128.248        110,000
Feb-2003 128.769 128.660        109,000
Mar-2003 129.258 129.148        110,000
Apr-2003 129.908 129.801        107,000
May-2003 130.663 130.559        104,000
Jun-2003 130.989 130.890          99,000
Jul-2003 129.646 129.550          96,000
Aug-2003 129.697 129.601          96,000
Sep-2003 130.351 130.253          98,000
Oct-2003 131.142 131.045          97,000
Nov-2003 131.302 131.208          94,000
Dec-2003 131.120 131.026          94,000
Jan-2004 128.458 128.365          93,000
Feb-2004 129.067 128.976          91,000
Mar-2004 130.107 130.019          88,000
Apr-2004 131.224 131.139          85,000
May-2004 132.127 132.047          80,000
Jun-2004 132.569 132.495          74,000
Jul-2004 131.405 131.334          71,000
Aug-2004 131.421 131.351          70,000
Sep-2004 132.133 132.068          65,000
Oct-2004 133.111 133.050          61,000
Nov-2004 133.360 133.301          59,000
Dec-2004 133.129 133.074          55,000
Jan-2005 130.423 130.369          54,000
Feb-2005 131.245 131.195          50,000
Mar-2005 132.083 132.038          45,000
Apr-2005 133.294 133.247          47,000
May-2005 134.104 134.058          46,000
Jun-2005 134.769 134.728          41,000
Jul-2005 133.705 133.665          40,000
Aug-2005 133.951 133.910          41,000
Sep-2005 134.576 134.533          43,000
Oct-2005 135.302 135.260          42,000
Nov-2005 135.857 135.817          40,000
Dec-2005 135.655 135.614          41,000
Jan-2006 133.000 132.961          39,000
Feb-2006 133.924 133.887          37,000
Mar-2006 134.903 134.868          35,000
Apr-2006 135.816 135.780          36,000
May-2006 136.621 136.584          37,000
Jun-2006 137.121 137.083          38,000
Jul-2006 135.945 135.908          37,000
Aug-2006 136.149 136.110          39,000
Sep-2006 136.817 136.777          40,000
Oct-2006 137.516 137.475          41,000
Nov-2006 137.898 137.857          41,000
Dec-2006 137.786 137.747          39,000
Jan-2007 134.994 134.952          42,000
Feb-2007 135.683 135.641          42,000
Mar-2007 136.576 136.533          43,000
Apr-2007 137.381 137.335          46,000
May-2007 138.323 138.277          46,000
Jun-2007 138.825 138.779          46,000
Jul-2007 137.425 137.379          46,000
Aug-2007 137.534 137.488          46,000
Sep-2007 138.096 138.046          50,000
Oct-2007 138.835 138.786          49,000
Nov-2007 139.143 139.090          53,000
Dec-2007 138.929 138.875          54,000
Jan-2008 135.896 135.840          56,000
Feb-2008 136.414 136.356          58,000
Mar-2008 137.003 136.944          59,000
Apr-2008 137.535 137.475          60,000
May-2008 138.105 138.045          60,000
Jun-2008 138.296 138.237          59,000
Jul-2008 136.811 136.751          60,000
Aug-2008 136.697 136.635          62,000
Sep-2008 136.748 136.686          62,000
Oct-2008 137.038 136.973          65,000
Nov-2008 136.355 136.288          67,000
Dec-2008 135.321 135.254          67,000
Jan-2009 131.627 131.555          72,000
Feb-2009 131.387 131.314          73,000
Mar-2009 131.249 131.175          74,000
Apr-2009 131.429 131.357          72,000
May-2009 131.697 131.626          71,000
Jun-2009 131.510 131.442          68,000
Jul-2009 129.910 129.844          66,000
Aug-2009 129.786 129.719          67,000
Sep-2009 130.144 130.077          67,000
Oct-2009 130.741 130.673          68,000
Nov-2009 130.787 130.720          67,000
Dec-2009 130.242 130.178          64,000
Jan-2010 127.374 127.309          65,000
Feb-2010 127.811 127.746          65,000
Mar-2010 128.646 128.584          62,000
Apr-2010 129.770 129.698          72,000
May-2010 130.886 130.801          85,000
Jun-2010 131.004 130.908          96,000
Jul-2010 129.664 129.569          95,000
Aug-2010 129.728 129.624        104,000
Sep-2010 130.221 130.090        131,000
Oct-2010 131.195 131.071        124,000
Nov-2010 131.502 131.371        131,000
Dec-2010 131.199 131.050        149,000
Jan-2011 128.338 128.183        155,000
Feb-2011 129.154 128.994        160,000
Mar-2011 130.061 129.899        162,000
Apr-2011 131.279 131.072        207,000
May-2011 131.963 131.707        256,000
Jun-2011 132.453 132.144        309,000
Jul-2011 131.181 130.821        360,000
Aug-2011 131.457 131.058        399,000
Sep-2011 132.204 131.746        458,000
Oct-2011 133.125 132.870        255,000
Nov-2011 133.456 133.172        284,000
Dec-2011 133.292 132.965        327,000
Jan-2012 130.657 130.297        360,000
Feb-2012 131.604 131.210        394,000
Mar-2012 132.505 132.081        424,000
Apr-2012 133.400 132.945        455,000
May-2012 134.213 133.723        490,000
Jun-2012 134.556 134.072        484,000
Jul-2012 133.368 132.868        500,000
Aug-2012 133.753 133.092        661,000
Sep-2012 134.374 133.797        577,000
Oct-2012 135.241 134.792        449,000
Nov-2012 135.636 135.069        567,000
Dec-2012 135.560 134.822        738,000

So there you have it, the BLS decided to “reconstruct” the employment numbers.  Gives you lots of confidence in their reporting doesn’t it? Plus this new fudge factor is now “baked in the cake” so all new numbers after January will have it already fudged in so we will never know what the real numbers are.

Webmasters: Feel free to repost this article, all we ask is that you link back to this original article on UnemploymentData.com.

Image courtesy of Salvatore Vuono / FreeDigitalPhotos.net

Filed Under: Government, Unemployment Tagged With: BLS, BLS Fudging Numbers, Employment Numbers

Government Salaries 35% Higher than Private Industry in 2012

January 31, 2013 by Tim McMahon

EMPLOYMENT COST INDEX – DECEMBER 2012

The U.S. Bureau of Labor Statistics released their employment cost index for the 2012 year on January 31st, 2013.  It included both annual data and information on salary costs for the last quarter for Civilian workers which is composed of two major sectors i.e. Private Industry Workers and State and Local Government Workers. Seasonally adjusted compensation costs for civilian workers for the 3-month period ending December 2012,  increased 0.5%. Wages and salaries (which make up about 70% of compensation costs) increased 0.3%, and benefits (which make up the remaining 30% of compensation) increased 0.6%.

US compensation costs 2012

Annual Compensation Costs

For the period of January through December 2012, compensation costs for civilian workers [Read more…] about Government Salaries 35% Higher than Private Industry in 2012

Filed Under: Employment, Employment Costs, Government Tagged With: Employment Costs, salaries, Wages

Working for the Government in Public Administration

November 12, 2012 by Andrina Cagandahan

Many students and people looking for a career change have often wondered to themselves how to get started working for the government. These can be some of the highest-paying, most secure positions out there, and they touch many different fields and organizations – probably more than you imagine. Postal workers, municipal clerks, urban developers, and even workers that handle aircraft and artillery usually have one thing in common – a background in public administration. Public administration can lead you in many different directions, but some of the most common careers can also be the most lucrative.

Four Public Administration Careers to Consider

Policy Analysts

public administration government worker
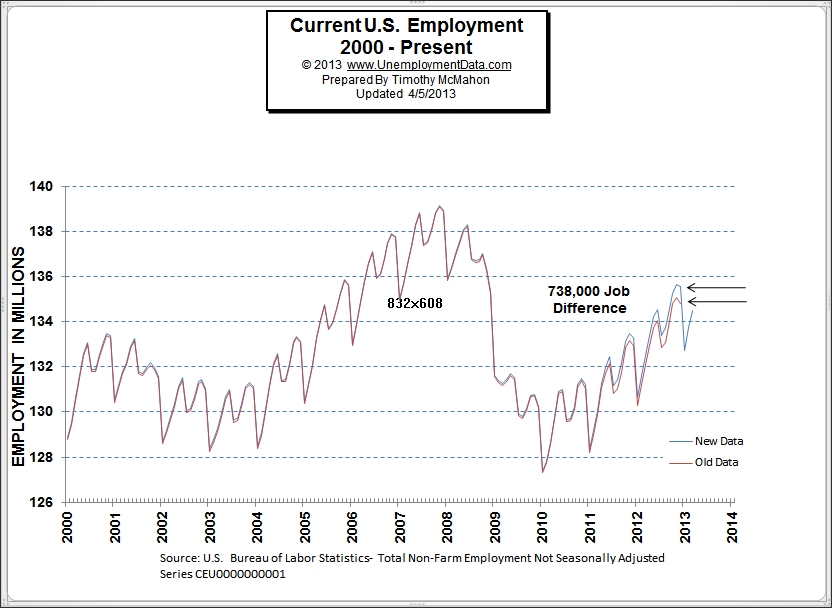
Many government agencies employ policy analysts, who evaluate their current policies and figure out ways to improve them or formulate new ones. They can be involved directly in finding the best ways to communicate with the public and also finding the best ways to address certain problems. This can mean conducting surveys or doing research on public perception – finding out which parts of an organization are working, and which need to be revised. Budget analysis is a similar job, but budget analysts focus on how much money is being spent and how a government organization can allocate its funds more wisely. [Read more…] about Working for the Government in Public Administration

Filed Under: Careers, Government Tagged With: career, government, job, public administration

State Employment and Unemployment Rates- September 2012

October 29, 2012 by Tim McMahon

Unemployment Rates by State-

The U.S. Bureau of Labor Statistics (BLS) has released the individual state unemployment rates and once again NORTH DAKOTA has the lowest unemployment rates… literally begging for employees.   They have “man camps” where men from all over the country are showing up and parking RV’s and cashing in on the high paying jobs available in the pipeline industry. And because the pay is so good it is driving up the wages everywhere else as Denny’s and McDonalds have to pay $15/hr in order to attract employees. Stories abound of labor being so scarce that Walmart quit stocking shelves and just places the pallets straight on the floor in the aisles and people grab the stock straight from the pallet.

On the other end of the spectrum we have Nevada where the gambling industry is hurting and they have 11.8% unemployment. This is followed by Rhode Island, California and New Jersey at 10.5%, 10.2% and 9.8% respectively.

State Unemployment Rate Sept 2012

Source:  BLS Data is based on Unemployment rates for selected states, seasonally adjusted, September 2012

The full Unemployment Data for all 50 States plus D.C. is:

[Read more…] about State Employment and Unemployment Rates- September 2012

Filed Under: General, Government, Unemployment Tagged With: state unemployment rates

  • Page 1
  • Page 2
  • Go to Next Page »

Primary Sidebar

Search Site

Sponsored:

URGENT: These Stocks Stand Poised to Benefit from President Trump's Trade Wars!

As the Trump administration moves ahead with aggressive tariff policies on key imports, the mainstream media is scrambling.

This Free Report - which you can download now - reveals the names and ticker symbols of 5 Stock Poised to Benefit Most from President Trump's Tariff Wars.

Click Here to Download Your FREE Stock Report Now.

Recent Posts

  • April 2025 Employment / Unemployment Report
  • Would More Jobs Help Social Security?
  • March 2025- Employment / Unemployment Report
  • February 2025 Jobs Report
  • January 2025 BLS Employment Report

Resources

  • Bureau of Labor Statistics Current Population Survey Monthly survey of households conducted by the Bureau of Census for BLS. It provides data on the labor force, employment, unemployment, etc.
  • Capital Professional Services Providing web design and development and Internet marketing services
  • Elliott Wave University Using the Elliott Wave Principle to improve investment performance
  • Financial Trend Forecaster Featuring Moore Inflation Predictor, NYSE Rate of Change and NASDAQ Rate of change
  • InflationData.com Inflation calculators, databases, etc.
  • Intergalactic Web Designers Web design and development services
  • Your Family Finances

Articles by Category

Articles by Date

Disclaimer

At UnemploymentData.com we are not registered investment advisors and do not provide any individualized advice. Past performance is not necessarily indicative of future performance and future accuracy and profitable results cannot be guaranteed.

Privacy & Terms of Use

Privacy Statement & Terms of Use

Do Not Sell My Information

Copyright © 2025 · News Pro on Capital Professional Services, LLC. All rights reserved · Log in