
![]() The U.S. Bureau of Labor Statistics (BLS) released their monthly unemployment survey results for December on January 4th and some are calling it a “monster” jobs report causing the DOW to gain almost 747 points (3.29%). The reason for this is that the “Seasonally Adjusted” jobs number was up 312,000 while the consensus was expecting an increase of only 176,000.
The U.S. Bureau of Labor Statistics (BLS) released their monthly unemployment survey results for December on January 4th and some are calling it a “monster” jobs report causing the DOW to gain almost 747 points (3.29%). The reason for this is that the “Seasonally Adjusted” jobs number was up 312,000 while the consensus was expecting an increase of only 176,000.
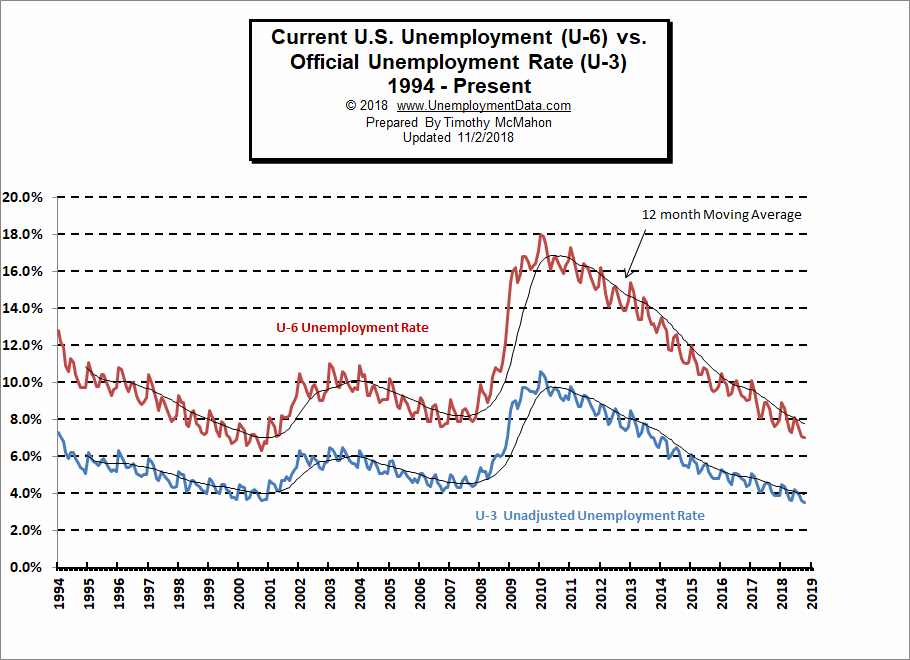
However all is not roses in employment land. There are a few thorns in the jobs report. Both Adjusted and Unadjusted Unemployment were actually up and Unadjusted Employment was down.
Adjusted U-3 was 3.9% up from 3.7% in November. Unadjusted U-3 was 3.7% up from 3.5% in November. Unadjusted U-6 was also up from 7.2% in November to 7.5% in December. Unadjusted Employment- 151.190 million down from 151.244 million in November. All of this sounds Bad! The major factor that the market has latched onto in this report is the Labor Force Participation Rate which has bounced above 63% for the first time since 2014. See Labor Force Participation below for more.
As I have been saying for a while typically unemployment doesn’t stay below 4% for very long. As we can see from the chart below the dip in 2006-7 didn’t even get below 4%. The 2000 dip only spent a couple of months below 4%. The 1960, 1973, ’79 and ’89 dips didn’t get below 4% at all.
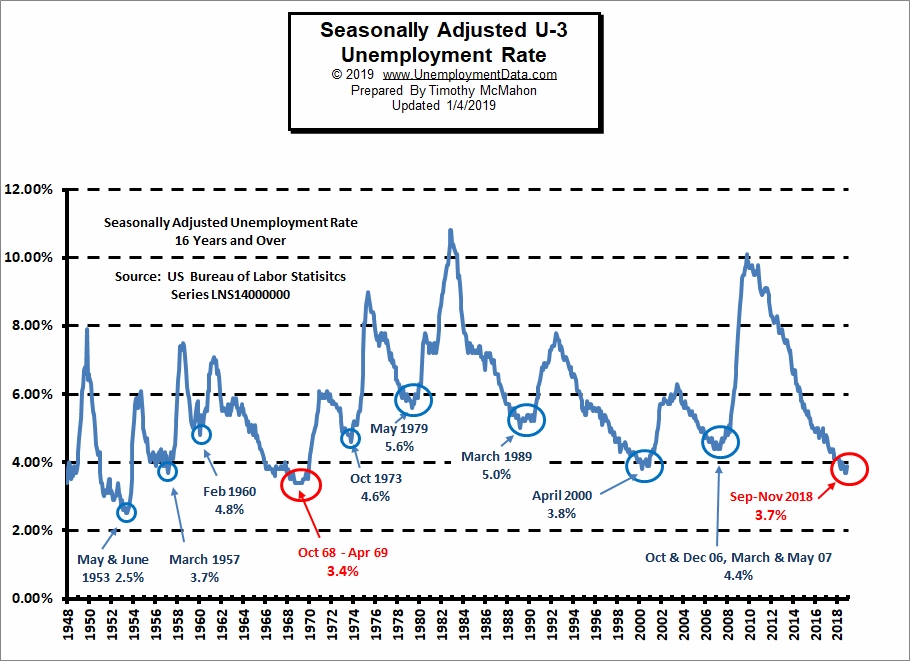
The three major exceptions are:
- 1966-1970 where unemployment bounced around 4% for a couple of years and then dipped briefly to 3.4%
- 1956-1957 where unemployment just bounced around 4% for a couple of years
- 1950-1954 where unemployment spent several post WWII years rebuilding with a massively reduced labor force due to the war.
So in that light, 3.9% isn’t really bad and the best we can hope for is that it continues to bounce around at this level for a couple more years.
Labor Force Participation Rate
As I said above, the major factor that the market has latched onto in this report is the Labor Force Participation Rate which has bounced above 63% for the first time since 2014. The reason this is encouraging is because it indicates that more people are reentering the Labor Force indicating optimism that they might finally find jobs. However, the higher unemployment rate just indicates that they haven’t found them yet.
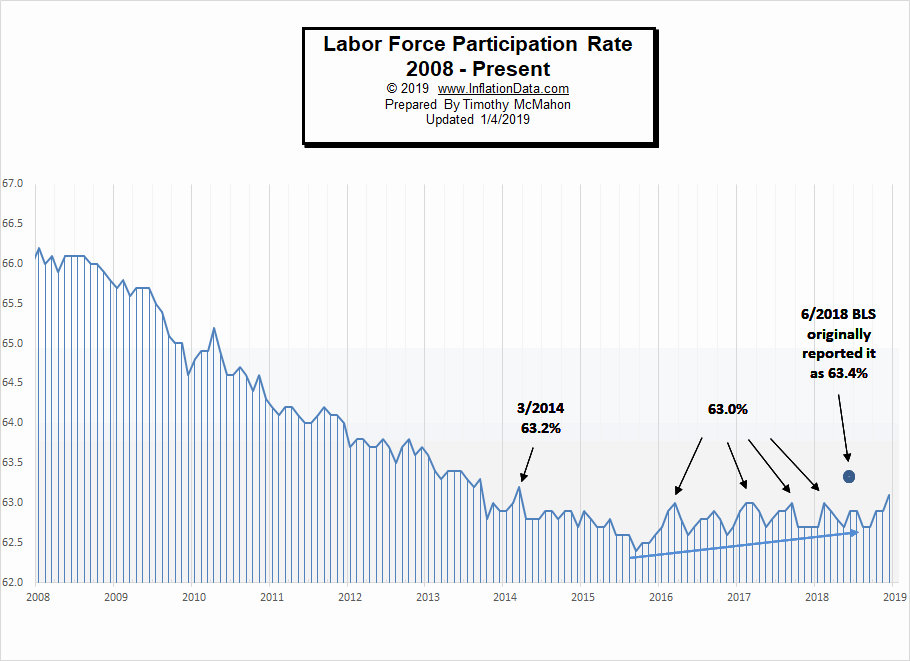
See Labor Force Participation Rate for more information.
Key December Employment and Unemployment Numbers
- Adjusted U-3 Unemployment- 3.9% up from 3.7% in November.
- Unadjusted U-3 Unemployment- 3.7% up from 3.5% in November.
- Unadjusted U-6 Unemployment- 7.5% up from 7.2% in November.
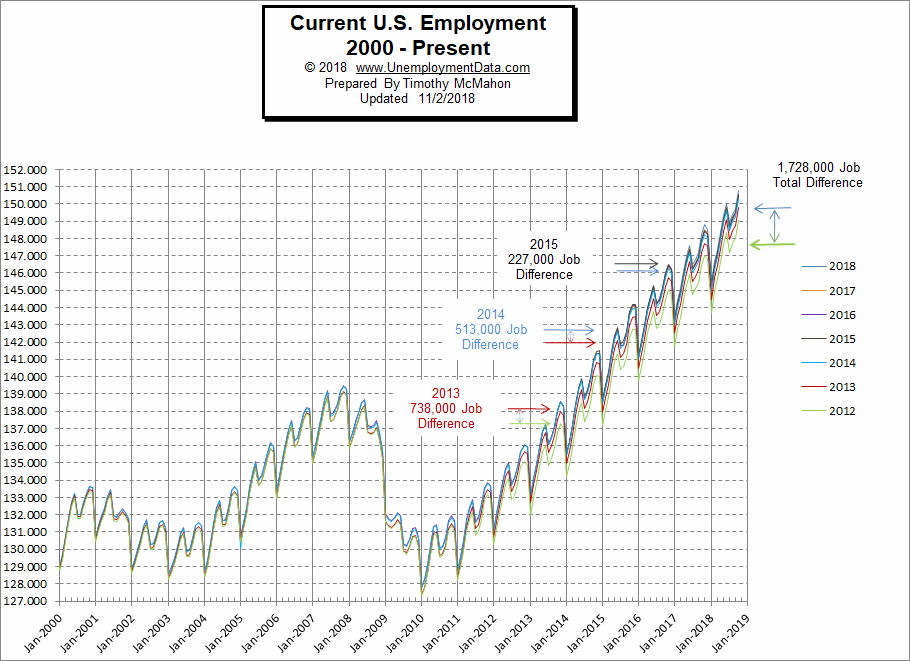
- Unadjusted Employment- 151.190 million down from 151.244 million in November.
- Seasonally Adjusted Employment- 156.945 Up from 156.803 million in November.
- December Labor Force Participation Rate- 63.1% up from November LFPR 62.9%.
See Current Unemployment Chart for more info.
Labor Force Participation Rate
| Year | Jan | Feb | Mar | Apr | May | Jun | Jul | Aug | Sep | Oct | Nov | Dec |
| 2018 | 62.7% | 63.0% | 62.9% | 62.8% | 62.8% | 62.9% | 62.9% | 62.7% | 62.7% | 62.9% | 62.9 | 63.1% |
Previous Record Low Unemployment (Seasonally Adjusted U-3)
(4% or below in Blue)
| Jan | Feb | Mar | Apr | May | Jun | Jul | Aug | Sep | Oct | Nov | Dec | |
| 1950 | 6.5% | 6.4% | 6.3% | 5.8% | 5.5% | 5.4% | 5.0% | 4.5% | 4.4% | 4.2% | 4.2% | 4.3% |
| 1951 | 3.7% | 3.4% | 3.4% | 3.1% | 3.0% | 3.2% | 3.1% | 3.1% | 3.3% | 3.5% | 3.5% | 3.1% |
| 1952 | 3.2% | 3.1% | 2.9% | 2.9% | 3.0% | 3.0% | 3.2% | 3.4% | 3.1% | 3.0% | 2.8% | 2.7% |
| 1953 | 2.9% | 2.6% | 2.6% | 2.7% | 2.5% | 2.5% | 2.6% | 2.7% | 2.9% | 3.1% | 3.5% | 4.5% |
| 1954 | 4.9% | 5.2% | 5.7% | 5.9% | 5.9% | 5.6% | 5.8% | 6.0% | 6.1% | 5.7% | 5.3% | 5.0% |
| 1955 | 4.9% | 4.7% | 4.6% | 4.7% | 4.3% | 4.2% | 4.0% | 4.2% | 4.1% | 4.3% | 4.2% | 4.2% |
| 1956 | 4.0% | 3.9% | 4.2% | 4.0% | 4.3% | 4.3% | 4.4% | 4.1% | 3.9% | 3.9% | 4.3% | 4.2% |
| 1957 | 4.2% | 3.9% | 3.7% | 3.9% | 4.1% | 4.3% | 4.2% | 4.1% | 4.4% | 4.5% | 5.1% | 5.2% |
| 1958 | 5.8% | 6.4% | 6.7% | 7.4% | 7.4% | 7.3% | 7.5% | 7.4% | 7.1% | 6.7% | 6.2% | 6.2% |
| … | … | … | … | … | … | … | … | … | … | … | … | … |
| 1965 | 4.9% | 5.1% | 4.7% | 4.8% | 4.6% | 4.6% | 4.4% | 4.4% | 4.3% | 4.2% | 4.1% | 4.0% |
| 1966 | 4.0% | 3.8% | 3.8% | 3.8% | 3.9% | 3.8% | 3.8% | 3.8% | 3.7% | 3.7% | 3.6% | 3.8% |
| 1967 | 3.9% | 3.8% | 3.8% | 3.8% | 3.8% | 3.9% | 3.8% | 3.8% | 3.8% | 4.0% | 3.9% | 3.8% |
| 1968 | 3.7% | 3.8% | 3.7% | 3.5% | 3.5% | 3.7% | 3.7% | 3.5% | 3.4% | 3.4% | 3.4% | 3.4% |
| 1969 | 3.4% | 3.4% | 3.4% | 3.4% | 3.4% | 3.5% | 3.5% | 3.5% | 3.7% | 3.7% | 3.5% | 3.5% |
| 1970 | 3.9% | 4.2% | 4.4% | 4.6% | 4.8% | 4.9% | 5.0% | 5.1% | 5.4% | 5.5% | 5.9% | 6.1% |
Employment
According to the Bureau of Labor Statistics Commissioner’s report:
“Total nonfarm payroll employment increased by 312,000 in December, and the unemployment rate rose to 3.9 percent. Job gains occurred in health care, food services and drinking places, construction, manufacturing, and retail trade. “
These are Seasonally adjusted numbers. Rather than increase actual employment decreased slightly for December by 54,000. Final employment numbers for November were 151.244 million. This month’s preliminary employment numbers are 151.190 million for an actual decrease of 54,000. But the Commissioner is saying that it rose 312,000 more than average for the month of December.
Employment by Sector
The employment “bubble chart” gives us a good representation of how each sector of the economy is doing (employment wise). As we can see from the chart below there is one single sector that is to the left of the zero line this month (i.e. Information) losing -1000 employees. Utilities were virtually unchanged. Every other sector gained employees. The further further to the right on the chart the more employees they gained.
The biggest gainer was Education and Health adding 82,000 jobs!!! Professional and Business Services (+43,000). Other big gainers were and Manufacturing (+32,000), and Retail (+23,800).
Average weekly wages rose from $940.84 in November to $948.06 in December.
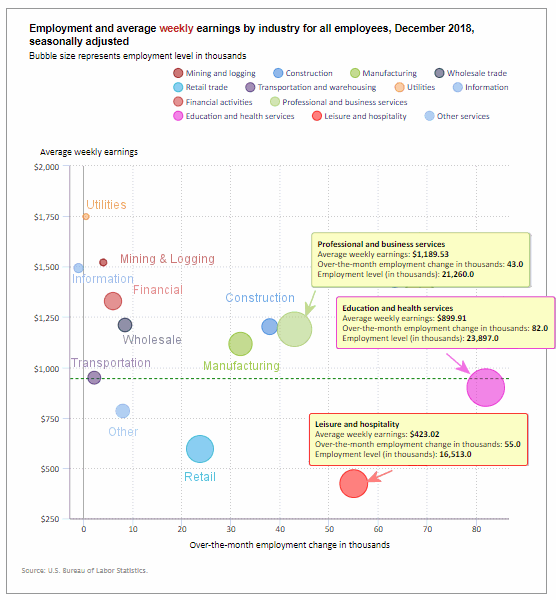
(See the table below for average weekly earnings and other details.)
How to read this chart:
Bubbles location on the chart tell us two things:
- Change in Employment Levels over the most recent month.
- Average Weekly earnings.
- The further to the right the bubble the larger the increase in the number of jobs.
- The higher up on the chart the larger the average salary.
Bubble Size tells us:
- Total Employment for the sector.
- Larger bubbles mean more people are employed in that sector.
Employment and Average Weekly Earnings by Industry
December 2018, Seasonally Adjusted
| Industry | Monthly Increase | Average Weekly Earnings | Employment Level |
| Total Private Employment | 301,000 | $948.06 | 127,858,000 |
| Mining and Logging | 4,000 | $1,521.22 | 758,000 |
| Construction | 38,000 | $1,202.38 | 7,352,000 |
| Manufacturing | 32,000 | $1,116.57 | 12,842,000 |
| Wholesale trade | 8,400 | $1,210.56 | 6,030,800 |
| Retail trade | 23,800 | $595.13 | 15,952,700 |
| Transportation and Warehousing | 2,200 | $949.16 | 5,426,000 |
| Utilities | 500 | $1,748.77 | 553,000 |
| Information | -1,000 | $1,493.13 | 2,760,000 |
| Financial Activities | 6,000 | $1,329.38 | 8,621,000 |
| Professional and Business Services | 43,000 | $1,189.53 | 21,260,000 |
| Education and Health Services | 82,000 | $899.91 | 23,897,000 |
| Leisure and Hospitality | 55,000 | $423.02 | 16,513,000 |
| Other Services | 8,000 | $783.87 | 5,892,000 |
The Differential between U3 and U6
For the last several months the differential between the unadjusted U3 and U6 (reached by subtracting U3 from U6) was at 3.5% but this month it jumped up a bit to 3.8% due to an increase in the U6 from 7.2% to 7.5%.
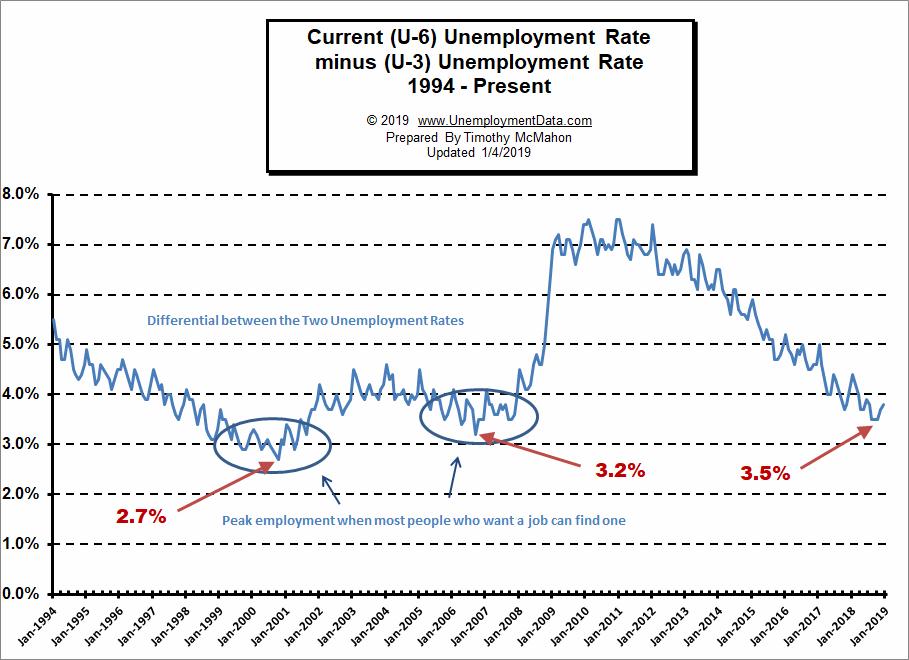
See Current U-6 Unemployment Rate for more info.
U-6 Unemployment
 Current U-6 Unadjusted Unemployment Rate for December 2018 is:
7.5% up from 7.2% in November
See Unadjusted U-6 unemployment for more info.
Employment
According to the BLS Commissioner’s report for this month:
“Total nonfarm payroll employment increased by 312,000 in December, and the unemployment rate rose to 3.9 percent. Job gains occurred in health care, food services and drinking places, construction, manufacturing, and retail trade. “
These are Seasonally adjusted numbers. Rather than increase actual employment decreased slightly for December by 54,000. Final employment numbers for November were 151.244 million. This month’s preliminary employment numbers are 151.190 million for an actual decrease of 54,000. But the Commissioner is saying that it rose 312,000 more than average for the month of December.
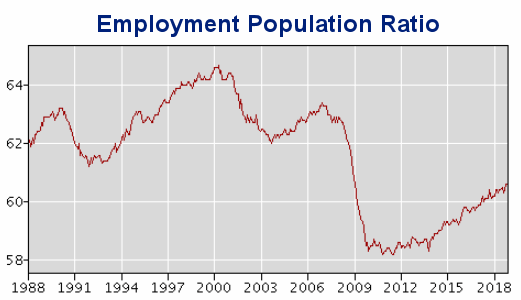
Employment Population Ratio
The index many people think of when they hear the term Labor Force Participation Rate might be better described by the Employment Population Ratio. This index shows the percentage of the entire population that is working. In many ways it is a better index than the LFPR or the Unemployment rate.
Here are some articles you might enjoy in case you missed them:
Read more on UnemploymentData.com.
- European Unemployment Rates Q3- 2018
- Lost Wages? How to Get the Compensation You Deserve
- November Employment Gains Less Than Projected But…
- Valuable Career Benefits of Studying Abroad
- Getting Your Dream Job: Nailing the Interview
From InflationData.com
- How Inflation and Interest Rates Relate
- Why Inflation Matters to Small Businesses
- November was Deflationary
- Cryptocurrencies and Inflation
- Can Crypto Solve Venezuela’s Hyperinflation Problem?
- Cost of Living: LA and New York vs. The World
- Debt and Inflationary Pressures: A Lesson in Economic Interactivity
- What Impact (if any) Does Disruption have on Inflation?
- Inflation Risk
From Financial Trend Forecaster
- Move Aside Lithium – Vanadium Is The New Super-Metal
- U.S. Shale Has A Glaring Problem
- How Free is Your State?
- Oil Price Rally Boosts Electric Car Sales
- $100 Oil Is A Distinct Possibility
- Do the FED’s Interest Rates Affect the Stock Market?
- Technological Solution to 100 Year Old Oil Problem
From Elliott Wave University
- Watch This Indicator for Approaching Volatility
- Have Smartphone Sales Peaked?
- Are Falling Oil Prices Really Good for the Stock Market?
- 1987 vs. 2018
- Bitcoin Breakdown May Push Prices Below $5000
- The Psychology of Volatility
From OptioMoney.com
- Money-Saving Upgrades: 3 Home Investments to Help Your Wallet
- Want to Boost Your FICO Score? 4 Easy Steps to Help Make That Happen
- Big Family Getting Expensive? 4 Ways to Stay in the Green
- Getting a Motorcycle? Things to Cover Before Hitting the Road
- Finding the Right Material for Your Roof
From Your Family Finances