
Current Unemployment Rate Chart
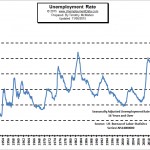
According to the latest U.S. Bureau of Labor Statistics (BLS) data release on November 6th the current “Seasonally Adjusted” Unemployment Rate for October is 5.0% down from September’s 5.1% which was down significantly from last October’s 5.8%. The “Unadjusted” rate is 4.8% down from 5.6% in July and much lower than January’s 6.1%. See: Current Chart
According to the BLS, the U-6 Unemployment Rate for October was 9.5%. U-6 unemployment includes short-term discouraged workers who have given up looking for work because they feel there is no work available for them.
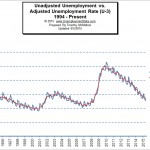
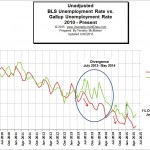
However, since 2010, Gallup (the survey/Pollsters) have been doing their own employment survey using basically the same parameters as the BLS and they conclude that the current U-6 (which they call the “UnderEmployment Rate) is actually 13.8% down from 14.1% in September.
According to John William’s Shadowstats the government began underestimating unemployment back in 1994 when they changed the way unemployment was calculated since “long-term discouraged workers were defined out of official existence”. The new U-6 numbers only include short-term discouraged workers. The following chart shows their calculations for Unemployment based on their estimates of what it would be if unemployment was calculated the pre-1994 way.

Current Employment Data
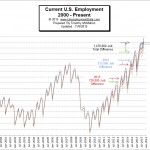 According to the current Bureau of Labor Statistics data, the employment situation for the month of October 2015 was as follows: The number of Unadjusted jobs reported for October 2015 was 143.739 million. That was up from June’s previous peak of 142.836 million.
For more information see: Current Employment Data
Current Employment vs Unemployment Chart
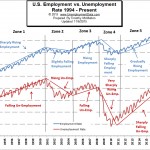 When looking at employment vs. unemployment you would think that they would simply be the inverse of each other. Flip one over and you have the other. But the U.S. Bureau of Labor Statistics (BLS) actually uses two entirely different surveys to calculate them. So by comparing them we can spot irregularities. See Employment vs. Unemployment for more information.
Historical Employment Data
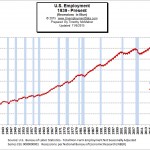
In this chart we can see the historical employment figures from 1939 through the present. But in addition to the number of jobs we can also see the recessions shaded blue.
See: Historical Employment Levels for more information.
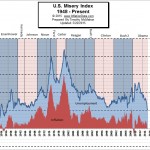 The misery index combines two factors that can make life difficult for people i.e. unemployment and inflation. High levels of price inflation (rapidly rising prices) will cause households to have difficulty affording the basic necessities while high unemployment will leave a high percentage of households without any income at all.
See: InflationData’s Misery Index.
Seasonally Adjusted Unemployment Rate
The U-3 Seasonally Adjusted Unemployment Rate is the standard unemployment rate that the government prefers to use since it presents a much rosier picture than the U-6. Go here if you would like to see the “Unemployment Rate” in table form.
Unadjusted vs. Seasonally Adjusted Unemployment Rate
Although the Seasonally Adjusted Unemployment Rate is often quoted by the main stream media (MSM) people often wonder how much fudging goes on in the adjustment process. In this chart you can see how the Seasonally Adjusted Unemployment Rate compares with the Unadjusted rate.
Although it doesn’t appear that there is much “fudging” going on with the Seasonal adjustments that doesn’t mean the numbers are without problems. See Is the Government Fudging the Unemployment numbers for some alternative ways to get a better picture of the employment situation.
See Also:
- What is U-6 Unemployment for more information about the different definitions of unemployment.
- Current U-6 Unemployment Rate