Recently McDonald’s decided to have a mass hiring of 50,000 new employees for it’s US based hamburger restaurants some of which will be full-time and some part-time. They actually ended up hiring 62,000 new employees as a result of all the applications they received. Because many of the restaurants are owned by franchisees the wages are not controlled by the company but many of the jobs were estimated to be for more than the nationwide minimum wage of $7.25 / hr. and managers can make up to $50,000 per year. [Read more…] about Almost 1 Million Unemployed Show up for 50K McDonald’s Jobs
OECD unemployment rate remains at 8.2% in March
The OECD area unemployment rate, at 8.2% in March 2011, was unchanged from February following three consecutive monthly decreases. The Euro area unemployment rate was also stable at 9.9%.
For the first time since the start of the financial crisis in 2007, unemployment rates are showing a steady or declining pattern in most OECD countries. Italy, Luxembourg, Spain and Sweden were the only countries whose unemployment rates rose in March. New data referring to April 2011 also show a rise (by 0.2 percentage point, to 9.0%) for the United States.
Countries experiencing continuously high unemployment rates include Hungary (11.9%), Ireland (14.7%), Portugal (11.1%), and the Slovak Republic (13.9%). Spain’s 20.7% unemployment rate means that, since May 2010, over one in every five people in the Spanish labour force has been unemployed and seeking work.
There were 44.4 million unemployed persons in OECD countries in March 2011, down 2.6 million from March 2010 but still 13.6 million higher than in March 2008.
Selected Unemployment Rates, s.a.
February 2011 – March 2011 (1)
Unemployment Rate in OECD Countries Falls in February
OECD unemployment rate records fourth consecutive fall at 8.2% in February
The OECD area unemployment rate fell again in February 2011 to 8.2%, down 0.1 percentage point from January. This was the fourth consecutive decrease, following a period of stability of around 8.5% throughout most of 2010. New March 2011 data show further declines of 0.1 percentage point in the unemployment rates of both the United States (to 8.8%) and Canada (7.7%).
The February data show, for the first time since the recent financial crisis, a pattern of declining or steady unemployment rates for the majority of OECD countries. The unemployment rate fell in the Euro area to 9.9%, the first time back into single digits since December 2009. Austria, Korea, Mexico and Spain were the only countries recording rises in their unemployment rates. Countries still experiencing very high unemployment rates include Hungary (12.0%), Ireland (14.9%), Portugal (11.1%), the Slovak Republic (14.0%) and Spain (20.5%).
There were 44.9 million unemployed persons in OECD countries in February 2011, down 2.1 million from February 2010 but 14.3 million higher than in February 2008.
Selected Unemployment Rates, s.a.
January 2011- February 2011
Workers Compensation Costs for December 2010
January 28,2011
The Bureau of Labor Statistics released the data on compensation costs today.
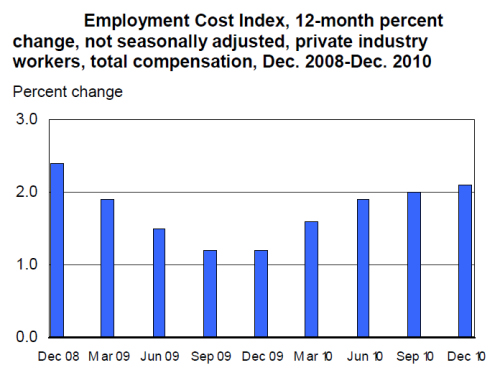
Compensation costs for civilian workers increased 2.0 percent for the 12-month period ending December 2010. The majority of the increase came from an increase in benefits costs, i.e. primarily retirement costs. Benefits costs were up 2.9% compared to a 1.6% increase in wages and salaries.
During the previous year (2009) the increase in compensation costs was 1.4 percent.
Unemployment Rate Down in December
January 7, 2011
According to the U.S. Bureau of Labor Statistics the unemployment rate fell by 0.4 percentage points to 9.4 percent in December which is not surprising because of the increase in seasonal workers for the holidays (retail trade employees were up 12,000 in December). But it was not just retail employees that increased. An overall good sign was that total nonfarm payroll employment increased by 103,000 in December. Employment rose in leisure and hospitality by 47,000 in December, indicating consumers are not feeling the pinch as much as in previous months and are spending more on discretionary expenditures. Other increases came in health care with 36,000 new jobs, mining added 5,000 jobs and manufacturing added 10,000 jobs but unfortunately construction employment lost 16,000 jobs. Employment changed little in other major industries.
Factories Expand 17 Consecutive Months, Jobs Don’t
Today I’d like to welcome Mike Shedlock aka. “Mish”. He is a registered investment advisor representative for SitkaPacific Capital Management. He has graciously allowed me to reprint his article that answers the question “Can we expect more factory jobs out of the current expansion?” He includes some compelling arguments on why unemployment isn’t falling. Tim McMahon~editor
The latest ISM reports show Factories grow for 17th straight month in December.
Manufacturers produced more goods and booked more orders last month, leading to the fastest growth in factory activity since May.
The Institute for Supply Management said Monday that its index of manufacturing activity rose to 57 in December from 56.6 in the previous month. Any reading over 50 indicates growth. The latest is well above the recession’s low of 32.5, hit in December 2008. But it’s below the reading of 60.4 in April, the highest level since June 2004.
The report shows that manufacturers carried considerable momentum into the new year. Automakers, computer and electronics companies, and industrial machinery firms showed particular strength, [Read more…] about Factories Expand 17 Consecutive Months, Jobs Don’t
New Jobless Benefits Claims Rise Despite Downward Trend
Washington — (Associated Press) More Americans signed up for unemployment benefits last week, but the broader trend in layoffs points to a slowly healing jobs market.
The Labor Department says new claims for unemployment aid rose last week by a seasonally adjusted 26,000 to 436,000. The previous week’s claims were revised up slightly to show applications had tumbled by 31,000 to 410,000. The figures are often volatile during the weeks around the Veteran’s Day and Thanksgiving holidays.
Even so, the longer-term trend has shown a downward drift.
The four-week moving average of claims, which smooths volatility, fell to 431,000 last week, a two-year low.
Read more: FoxNews
October 2010 Unemployment Rate Unchanged
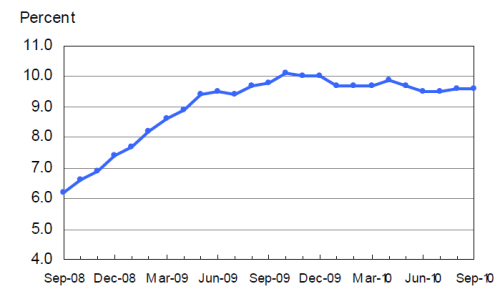
Nonfarm payroll employment increased by 151,000 in October, and the unemployment rate was unchanged at 9.6 percent, the U.S. Bureau of Labor Statistics reported today. Since December 2009, nonfarm payroll employment has risen by 874,000.
In October, 41.8 percent of unemployed persons had been jobless for 27 weeks or more.
The number of persons employed part time for economic reasons (some- times referred to as involuntary part-time workers) fell by 318,000 over the month to 9.2 million, partially offsetting large increases in the prior 2 months. These individuals were working part time because their hours had been cut back or because they were unable to find a full-time job.
September 2010 Unemployment Rate
October 8, 2010
The Bureau of Labor Statistics released their report for September today. The number of unemployed persons, at 14.8 million, was essentially unchanged in September, and the unemployment rate held at 9.6%.
Among the major worker groups, the unemployment rate for adult men was 9.8%, adult women was 8.0%, teenagers was 26.0%, whites was 8.7%, blacks was 16.1%, and Hispanics was 12.4% showing little or no change in September.
The number of long-term unemployed (those jobless for 27 weeks and over), at 6.1 million, was little changed over the month but was down by 640,000 since a series high of 6.8 million in May. In September, 41.7 % of unemployed persons had been jobless for 27 weeks or more.

One in Seven in Poverty
September 2010
The Census Bureau reported, in its annual report for 2009 that the overall poverty rate climbed to 14.3 percent or 43.6 million people. The poverty rate climbed from 13.2 percent, or 39.8 million, in 2008. Another way to look at this is one out of every seven working-age Americans (18 – 65) is now classified as being in poverty. This is the highest level for this rating since the 1960s.
What exactly is the poverty level for the US? According to an official government calculation that includes only cash income before tax deductions, the poverty level in 2009 stood at $21,954. This amount excludes capital gains or accumulated wealth such as home ownership. Although this figure takes into account the effects of some of the stimulus programs such as unemployment benefits or jobs created or saved by government spending, it does not factor in non-cash government aid such as tax credits and food stamps.
Beginning next year the US government plans to publish new supplemental poverty figures that are expected to show even higher numbers of people in poverty than previously known.
The new figures will include the rising costs of medical care, transportation and child care.
Another figure that has risen dramatically is the number of uninsured. Americans without health coverage rose from 15.4 percent to 16.7 percent, or 50.7 million people.


