• About WordPress
    • WordPress.org
    • Documentation
    • Learn WordPress
    • Support
    • Feedback
  • Log In
  • Skip to primary navigation
  • Skip to main content
  • Skip to primary sidebar
  • Home
  • Contact us
  • Related Sites
    • InflationData.com
    • Financial Trend Forecaster
    • Your Family Finances
    • Elliott Wave University
    • Optio Money
  • About
    • Terms of Use
    • Disclaimer & Disclosure
    • Privacy Statement
  • Sitemap
    • 2009-2010 Posts
    • 2011 Posts

UnemploymentData.com

Your Source for Employment and Unemployment Data

Unemployment
  • Charts
    • Current Unemployment Rate Chart
    • Current Employment Rate (Chart and Data)
    • Current Employment vs Unemployment Chart
    • Historical Employment Data
    • Employment Population Ratio
    • Misery Index
  • Unemployment
    • Historical Unemployment Rate Tables
    • What Is U-6 Unemployment?
    • Unadjusted vs. Seasonally Adjusted U-3 Unemployment Rate
    • BLS vs. Gallup Unemployment Numbers
    • Current U-6 Unemployment Rate
    • What is the Labor Force Participation Rate?
    • What is the Real Unemployment Rate?
  • Employment
    • Current Employment Rate (Chart and Data)
    • Historical Employment Data
    • Contacting a Live Person at the State Employment Commission
      • How to Talk to a Live Person at the Virginia Unemployment Commission
      • Florida’s FLUID Unemployment Program
    • Benefits
      • Insurance
      • Retirement
    • Careers
    • Employment Costs
    • Experience
    • Government
    • Job Hunting
      • Interview
      • Resume
  • Find Articles
  • Education
    • Skills
  • General
    • Small Business
      • Outsourcing
    • Success
You are here: Home / Archives for Tim McMahon

Tim McMahon, Editor of UnemploymentData.com

My grandfather lived through the Hyperinflation in Weimar, Germany--to say he was an original “gold bug” would be an understatement. I began reading his “hard money” newsletters at the age of 16 and the dividends from gold stocks helped put me through college. I began publishing the Financial Trend Forecaster paper newsletter in 1995 upon the death of James Moore editor of Your Window into the Future and the creator of the Moore Inflation Predictor©. FTF specializes in trends in the stock market, gold, inflation and bonds. In January of 2003, I began publishing InflationData.com to specialize in all forms of information about the nature of Inflation. In 2009, we added Elliott Wave University to help teach you the principles of Elliott Wave analysis. In January 2013, we began publishing OptioMoney. Connect with Tim on Google+.

Median Weekly Earnings $764

January 24, 2012 by Tim McMahon

The U.S. Bureau of Labor Statistics (BLS) released the results of their 4th quarter 2011 wage and salary survey today. Data on usual weekly earnings are collected as part of the Current Population Survey, a nationwide sample survey of households in which respondents are asked, among other things, how much each wage and salary worker usually earns. The BLS surveyed a representative sample of the 101.5 million full-time wage and salary workers and determined that the mean (not seasonally adjusted) earnings were $764 per week. Annualized that would be  $39,728.

Wages varied by race, gender, age group and profession. As would be expected, persons employed full time in management, professional, and related occupations had the highest median weekly earnings with men earning $1,274 and women earning $946. Men and women employed in service jobs earned the least, $578 and $440, respectively.

Education also played a part in the median wages. Full-time workers age 25 and over without a high school diploma had median weekly earnings of $444, compared with $641 for high school graduates (no college) and $1,158 for those holding at least a bachelor’s degree.

Wages also varied by age with the highest wages going to those in the oldest age group. Among men, those age 55 to 64 had the highest median weekly earnings at $1,029. While those slightly younger ,45 to 54 had the second highest at $993.

Earnings by race are also tracked, with Asians having the highest median wages at $880, Whites at $786, Blacks at $621, and Hispanics at $534. These numbers do not take into consideration education, language abilities or occupation.  Women had  median weekly earnings of $688, or 81.6 percent of the $843 median for men. White women earned 81.4 percent as much as their male counterparts,  black women earned 91.1 percent as much as their male counterparts, Asian women earned 80.3 percent as much as their male counterparts and Hispanic women women earned 90.4 percent as much as their male counterparts. Interestingly if you take 80.3% of the Asian male wage you get $706 for Asian women which is more than the $621 for Black men.

The BLS uses the “Mean” rather than the average. A “Mean” determines the amount the middle person in a group makes. So if you have five people earning $10,000, $20,000, $30,000, $40,000 and $50,000 the mean would be $30,000.  In this example the average would also be $30,000. But the reason the BLS uses the mean is because it eliminates the effects of high income wage earners. For instance if you have five different wage earners earning $10,000, $20,000, $30,000, $40,000 and then you have Mitt Romney earning $21 Million. The mean is still $30,000 but the average is $4,220,000.

Filed Under: General Tagged With: median wages, weekly earnings

World-Wide Hourly Compensation Comparison

December 21, 2011 by Tim McMahon

The 2010 worldwide hourly compensation cost comparison is finally in. So we can see how the wages stack up between 34 different countries. Not surprisingly many European Countries have higher employment costs than the U.S. because of their massive social programs. This of course makes them less competitive in the world market. Surprisingly, in 2010 the U.K. actually had lower total employment costs than the U.S.  Of course when it comes to standard of living, Wages and Social programs are only half of the equation. The other half of course is the cost of living. A low cost of living country doesn’t need the same wages in order to have the same standard of living.

Let’s look at the wage levels in various countries [Read more…] about World-Wide Hourly Compensation Comparison

Filed Under: Employment Costs Tagged With: Compensation, employment, factory jobs

The Difference a Degree Makes in Unemployment Levels

November 18, 2011 by Tim McMahon

The Difference a College Degree Makes

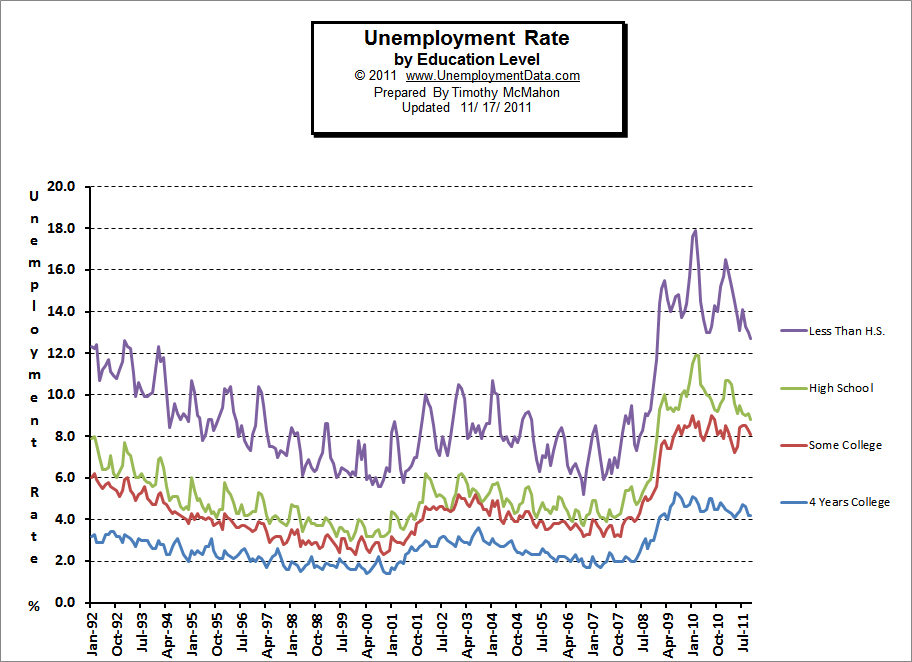
We’re always told by our parents that we need a good education in order to get a good job. And that we will make more money if we have a good education. But these days we hear of unemployed college graduates camping out in New York city and protesting Wall Street because they can’t find jobs. So let’s take a look at the numbers and compare the unemployment rate based on eduation level.  In the following chart we will look at four educational levels. The first level are those people with less than a High School education. The second level are those with a High School diploma. The third level are those with some college education or an associates degree. And finally those with a Four Year College Degree.

College Degree

As we can see from the chart above, obviously the unemployment rate is the highest for those with the least education… as we would expect. Logically if you were an employer you would lay off the least educated employees first because they are more readily replaceable. We can even tell by the numbers the actual difference a high school education makes. The average unemployment rate for the period from 1992 through October 2011 for High School graduates was 5.5% while the average for those who didn’t graduate from High School was 9.2%. So simply by getting a High School education, you decreased your odds of being unemployed drastically with the actual difference being 3.7%.  But if you look at the chart you will see that a High School education was even more valuable than that. The real benefit of being able to get a job is when jobs are scarce, so even though the average difference was 3.7% during bad times, i.e. when the overall unemployment rate is higher the difference climbs even more.

First, let’s look at the difference just a high school education makes. [Read more…] about The Difference a Degree Makes in Unemployment Levels

Filed Under: Education, Unemployment Tagged With: competitive, difference, education, unemployment, unemployment rate

North Dakota Jobs Booming

November 17, 2011 by Tim McMahon

While the unemployment rate in most of the United States hovers around 9% an unlikely sounding state is booming. The current unemployment rate in North Dakota of all places is just 3.5% according the September report of the U.S. Bureau of Labor Statistics. (Nationwide, the rate is 9.1%). An oil boom has sprung up and immunized residents from the most severe recession in decades. Wages are up, and work is plentiful. It’s almost like being on a totally different planet. People are sending resumes and getting multiple job offers within a week. Why? [Read more…] about North Dakota Jobs Booming

Filed Under: Employment Tagged With: Bakken, jobs, McDonalds, minimum wage, North Dakota, Oil

World’s Most Weird and Wonderful Jobs

November 11, 2011 by Tim McMahon

By Isabella Woods


As many of us are only too aware, we spend a lot of time at work. According to the Paris-based Organization for Economic Cooperation & Development, the average Brit spends 1,530 hours a year working, while the average American spends even longer – a back-breaking, finger-hurting 1,896 hours every year.

Things are not going to get better either, according to Paul Macro of the actuaries Watson Wyatt. ‘For a long time, it was a common belief that rising prosperity would allow each generation to retire earlier than their parents,’ he says. But reality has now bitten. It means saving more or working longer.

With these sobering thoughts in mind, perhaps it’s time that we started considering how we make all those years of slog a little more interesting. Do a little digging, and it’s easy to discover some unusual, if not downright bizarre, employment opportunities.

Banana gasser

Not quite as Nazi as it appears, banana gassing is a process to help ripen the fruit ready for sale. After being picked, bananas are shipped while they are still green to help reduce the potential for bruising. On arrival, they are taken to hermetically sealed chambers where they are surrounded with an ethylene gas to encourage their ripening. The process can take three to eight days, with the gasser using a computer program to determine the volume and amount of exposure needed. [Read more…] about World’s Most Weird and Wonderful Jobs

Filed Under: Employment Tagged With: employment, interesting, jobs, positions

Compensation Costs Up in September 0.3 Percent

October 29, 2011 by Tim McMahon

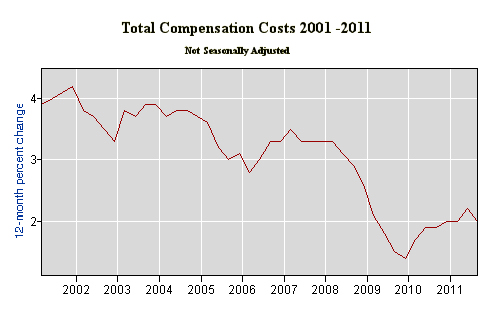
The U.S. Bureau of Labor Statistics released the compensation costs for U. S. civilian workers on Friday October 28th. Wages and salaries are up 0.3% or roughly 1/3rd of 1% for the month.  This represents 70% of the total of the cost of maintaining employees. The remaining 30% of the cost comes from benefits and they rose 0.1% over the month.

On an annual basis, employment costs have risen 2.0% for the 12 months ending September 2011. This is compared to an annual inflation rate of 3.87% based on the Bureau of Labor Statistics CPI-U. This is the most widely used measure of inflation. So even though costs rose almost 3.9% wages only rose 2% leaving the average wage earner 1.87% worse off than last year. This of course is not as bad as the nearly 10 of the working population that is currently unemployed.


Compensation Costs 9-11

Filed Under: Employment Costs Tagged With: compensation costs

OECD Unemployment Rate Hovering at 8.2% in July

September 13, 2011 by Tim McMahon

The Organisation for Economic Co-operation and Development (OECD) released its report on unemployment in OECD countries today.

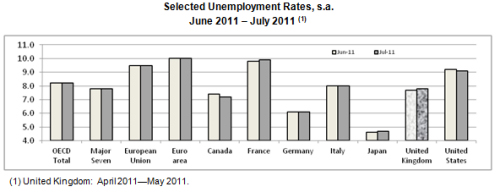
The unemployment rate for the entire OECD area was  unchanged for the fifth consecutive month at 8.2% in July 2011. The Euro area unemployment rate was unchanged at 10.0% for the second consecutive month and has hovered around this level since December 2010.

Between June and July unemployment rates for OECD countries displayed very little movement. The single highest rise was for Luxembourg (up 0.3 percentage points to 4.6%) while the greatest fall was in Mexico (down 0.5 percentage points at 5.3%). New August 2011 data for the United States (unchanged at 9.1%) and Canada (up by 0.1 percentage point to 7.3%) confirm this current picture of broad stability in unemployment rates.

Countries where high unemployment rates continue to persist include Ireland (14.5%), Portugal (12.3%), the Slovak Republic (13.4%) and Spain (21.2%).

Around 44.5 million people were unemployed across the OECD area in July 2011, down 2.0 million from July 2010 but still 11.4 million higher than in July 2008.

OECD Unemployment July


OECD Unemployment Rates, s.a.

Percentage of labour force

2008 2009 2010 2010 2011 2011
Q3 Q4 Q1 Q2 Feb Mar Apr May Jun Jul
OECD – Total 6.1 8.4 8.6 8.6 8.5 8.2 8.2 8.2 8.2 8.2 8.2 8.2 8.2
Major Seven 5.9 8.1 8.2 8.1 8.1 7.7 7.7 7.7 7.7 7.7 7.7 7.8 7.8
European Union 7.1 9 9.7 9.6 9.6 9.5 9.5 9.5 9.4 9.4 9.5 9.5 9.5
Euro area 7.7 9.6 10.1 10.1 10.1 10 10 10 10 9.9 10 10 10
Australia 4.2 5.6 5.2 5.2 5.2 5 4.9 5 4.9 4.9 4.9 4.9 5.1
Austria 3.8 4.8 4.4 4.4 4.2 4.4 4.1 4.5 4.3 4.1 4.2 3.9 3.7
Belgium 7 7.9 8.3 8.3 7.9 7.2 7.3 7.1 7.1 7.2 7.4 7.4 7.5
Canada(1) 6.1 8.3 8 8 7.7 7.7 7.5 7.8 7.7 7.6 7.4 7.4 7.2
Chile 7.8 10.8 8.2 8 7.1 7.3 7.2 7.3 7 7.2 7.2 7.5
Czech Republic 4.4 6.7 7.3 7.1 7.1 6.9 6.5 6.9 6.7 6.6 6.5 6.5 6.4
Denmark 3.4 6.1 7.4 7.4 7.7 7.6 7.3 7.6 7.6 7.3 7.4 7.3 7.1
Estonia 5.6 13.8 16.8 16.1 14.5 13.6 12.8 13.6 13.6 12.8 12.8 12.8
Finland 6.4 8.2 8.4 8.3 8.1 8 7.9 8 8 7.9 7.9 7.9 7.9
France 7.8 9.5 9.8 9.8 9.7 9.7 9.7 9.7 9.7 9.7 9.7 9.8 9.9
Germany 7.6 7.7 7.1 6.9 6.6 6.4 6.2 6.4 6.3 6.2 6.2 6.1 6.1
Greece 7.7 9.5 12.6 13 14.1 15 15 15
Hungary 7.8 10 11.2 11.1 11 11 10.1 10.9 10.6 10.3 10 9.9 9.7
Iceland 3 7.2 7.5 7.8 8.5 7.4 6.7
Ireland 6.4 11.8 13.7 13.8 14.3 14.2 14.2 14.2 14.1 14.1 14.1 14.3 14.5
Israel(3) 6.1 7.5 6.7 6.6 6.5 6 5.5
Italy 6.8 7.8 8.4 8.3 8.3 8.1 8 8.1 8.1 8 8.1 8 8
Japan 4 5.1 5.1 5 5 4.7 4.6 4.6 4.6 4.7 4.5 4.6 4.7
Korea 3.2 3.6 3.7 3.6 3.4 3.9 3.4 4 4 3.6 3.3 3.3 3.3
Luxembourg 4.9 5.1 4.5 4.4 4.5 4.3 4.3 4.2 4.3 4.3 4.3 4.3 4.6
Mexico 4 5.5 5.4 5.2 5.4 5.1 5.5 5.2 5 5.2 5.5 5.8 5.3
Netherlands 3.1 3.7 4.5 4.5 4.4 4.3 4.2 4.3 4.2 4.2 4.2 4.1 4.3
New Zealand 4.2 6.1 6.5 6.4 6.7 6.5 6.5
Norway 2.5 3.1 3.5 3.5 3.5 3.2 3.3 3.2 3.2 3.4 3.3 3.3
Poland 7.2 8.2 9.6 9.5 9.6 9.4 9.5 9.3 9.4 9.5 9.5 9.5 9.4
Portugal 8.5 10.6 12 12.2 12.3 12.4 12.6 12.4 12.5 12.6 12.6 12.5 12.3
Slovak Republic 9.5 12 14.4 14.3 14 13.5 13.4 13.5 13.4 13.4 13.4 13.4 13.4
Slovenia 4.4 5.9 7.3 7.3 7.8 8.1 8.3 8.1 8.2 8.3 8.3 8.4 8.4
Spain 11.4 18 20.1 20.5 20.5 20.6 20.8 20.6 20.7 20.7 20.8 21 21.2
Sweden 6.2 8.3 8.4 8.3 7.9 7.7 7.5 7.6 7.7 7.4 7.7 7.4 7.4
Switzerland 3.2 4.1 4.2 4.5 3.9 3.9
Turkey 9.7 12.5 10.6 10.5 9.9 9.3 9.2 9.1 9.1 9.3
United Kingdom 5.6 7.6 7.8 7.7 7.8 7.7 7.7 7.6 7.7 7.8
United States (2) 5.8 9.3 9.6 9.6 9.6 8.9 9.1 8.9 8.8 9 9.1 9.2 9.1

Filed Under: Unemployment Tagged With: OECD, unemployment

Work Ethic Initiatives

July 28, 2011 by Tim McMahon

The Importance of a Good Work Ethic

Employees with a good strong work ethic are critical to the success of a business. One of the key factors employers look for when hiring new employees is a good work ethic… it can be as important if not more important than experience or education.

What is a Good Work Ethic?

There’s a variety of factors that make up a good work ethic including:

Initiative:

Does the employee do things just because they need to be done rather than waiting to be told to do it?

Dependability:

Does he do what he says he is going to?

Honesty:

Can you trust him?

Responsibility:

Does he blame others or take responsibility for his actions?

Quality:

Does he take pride in her work or just do enough to get by?

Respect:

Does he respect others and can others respect him?

Teamwork:

Can he work with others and get the job done.

And finally…

Leadership:

Does he possess leadership qualities and are others willing to follow his lead?


An exceptionally good work ethic can even take an entry-level employee making less than $30,000 per year to full partner in less than three years as we will see…


[Read more…] about Work Ethic Initiatives

Filed Under: General Tagged With: dependability, honesty, initiative, integrity, leadership, quality, respect, responsibility, teamwork, Work Ethics

OECD unemployment rate stable at 8.1% in May

July 15, 2011 by Tim McMahon

The OECD area unemployment rate was steady at 8.1% in May, unchanged for the third consecutive month. The Euro area unemployment rate was also stable at 9.9% for the third consecutive month.

Most OECD countries confirm the general pattern of steady or falling unemployment rates although Austria, Belgium, Denmark, Italy, Luxembourg, Spain, Sweden and the United States recorded small increases in their May unemployment rates. New June 2011 data for the United States show a further rise of 0.1 percentage point to 9.2%.

Countries experiencing continuously high unemployment rates include Ireland (14.0%), Portugal (12.4%), the Slovak Republic (13.3%) and Spain (20.9%).

There were 44.0 million unemployed persons in OECD countries in May 2011, down 2.8 million from May 2010 but still 12.0 million higher than in May 2008.

Selected Unemployment Rates, s.a.
April 2011 – May 2011 (1)

OECD for April - May 2011

 (1) United Kingdom:  February 2011—March 2011.

Methodological Notes:

For methodological reasons, harmonised unemployment rates may differ from those published by national statistical institutes. All rates and levels quoted are seasonally adjusted (s.a.).

More methodological notes are available at http://www.oecd.org/dataoecd/21/0/44743407.pdf.

Access data:

The latest unemployment rates for all OECD countries and geographic groupings, as well as historical data, can be downloaded from the OECD online data dissemination facility OECD.Stat Extracts at: http://stats.oecd.org/wbos/Default.aspx?QueryName=251&QueryType=View&Lang=en.

Contacts:

For further information readers are invited to contact the OECD’s Media Relations Division on

(33) 1 45 24 97 00 or e-mail news.contact@oecd.org

For technical questions contact stat.contact@oecd.org

Next release: Tuesday, 13 September 2011

Filed Under: Unemployment Tagged With: OECD

Teen Employment Rate Plunges

July 9, 2011 by Tim McMahon

Only 1 in 4 Teens is Employed

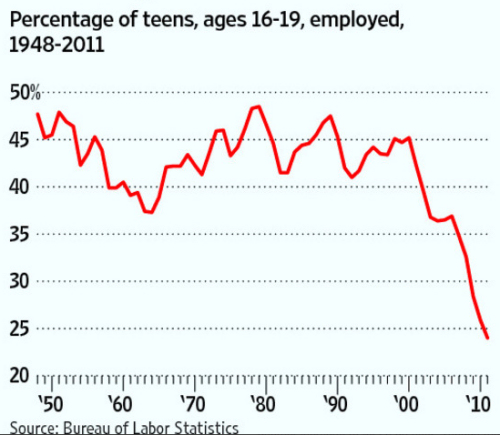
Teenage employment rates have averaged around 45% since the 1950’s but since 2000 the teenage employment rate has plummeted. Currently less than 25% of teenagers can find a job. But don’t worry the government has a plan to create 50,000 new jobs…

So what is this magic plan you might ask?

Teen Employment Rate Plummets

Simple [Read more…] about Teen Employment Rate Plunges

Filed Under: Unemployment Tagged With: employment, minimum wage, teen employment, teen unemployment, unemployment, unemployment rate

  • « Go to Previous Page
  • Page 1
  • Interim pages omitted …
  • Page 40
  • Page 41
  • Page 42
  • Page 43
  • Page 44
  • Go to Next Page »

Primary Sidebar

Search Site

Sponsored:

URGENT: These Stocks Stand Poised to Benefit from President Trump's Trade Wars!

As the Trump administration moves ahead with aggressive tariff policies on key imports, the mainstream media is scrambling.

This Free Report - which you can download now - reveals the names and ticker symbols of 5 Stock Poised to Benefit Most from President Trump's Tariff Wars.

Click Here to Download Your FREE Stock Report Now.

Recent Posts

  • April 2025 Employment / Unemployment Report
  • Would More Jobs Help Social Security?
  • March 2025- Employment / Unemployment Report
  • February 2025 Jobs Report
  • January 2025 BLS Employment Report

Resources

  • Bureau of Labor Statistics Current Population Survey Monthly survey of households conducted by the Bureau of Census for BLS. It provides data on the labor force, employment, unemployment, etc.
  • Capital Professional Services Providing web design and development and Internet marketing services
  • Elliott Wave University Using the Elliott Wave Principle to improve investment performance
  • Financial Trend Forecaster Featuring Moore Inflation Predictor, NYSE Rate of Change and NASDAQ Rate of change
  • InflationData.com Inflation calculators, databases, etc.
  • Intergalactic Web Designers Web design and development services
  • Your Family Finances

Articles by Category

Articles by Date

Disclaimer

At UnemploymentData.com we are not registered investment advisors and do not provide any individualized advice. Past performance is not necessarily indicative of future performance and future accuracy and profitable results cannot be guaranteed.

Privacy & Terms of Use

Privacy Statement & Terms of Use

Do Not Sell My Information

Copyright © 2025 · News Pro on Capital Professional Services, LLC. All rights reserved · Log in