
The U.S. Bureau of Labor Statistics (BLS) released its employment / unemployment report for June on July 5th, 2024.
Employment / Unemployment
![]()
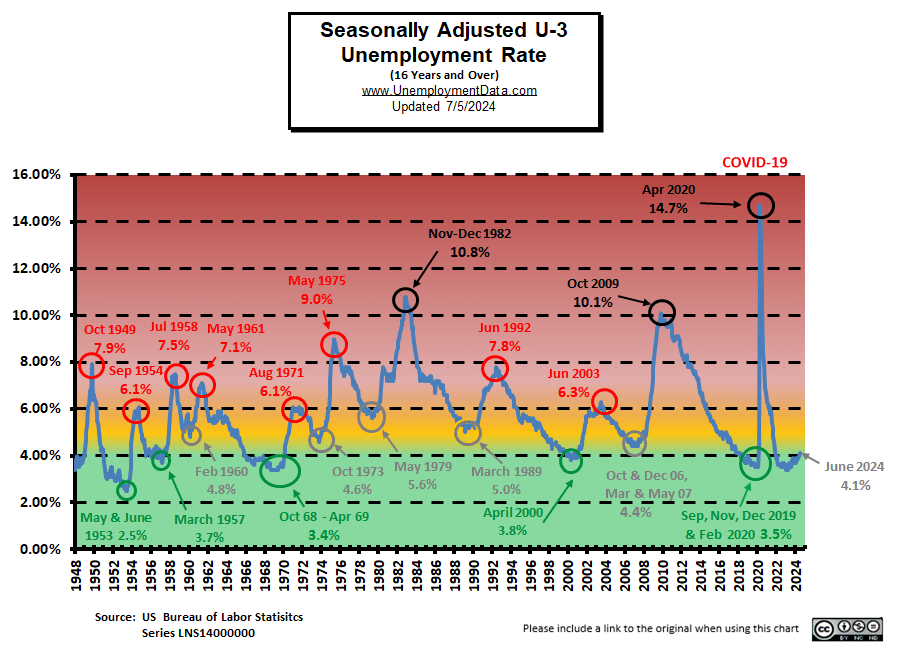
- Seasonally Adjusted U3- 4.1% up from 4.0% in May
- Unadjusted U3- 4.3% up from 3.7% in May
- Unadjusted U6- 7.7% up from 7.1% in May
- Labor Force Participation Rate 62.6% up from 62.5%
- Employment 159.392 million up from 158.845 million
- Next data release August 2nd, 2024
Summary:
Total Employed increased in June, Unadjusted Unemployment was up sharply, but Seasonally adjusted Unemployment increased only slightly.
According to the Commissioner of the U.S. Bureau of Labor Statistics:
“Total nonfarm payroll employment increased by 206,000 in June, and the unemployment rate changed little at 4.1 percent, the U.S. Bureau of Labor Statistics reported today. Job gains occurred in government, health care, social assistance, and construction…
Both the unemployment rate, at 4.1 percent, and the number of unemployed people, at 6.8 million, changed little in June. These measures are higher than a year earlier, when the jobless rate was 3.6 percent and the number of unemployed people was 6.0 million.”
You can read the full BLS report here.
As usual, they are talking about “Seasonally Adjusted Jobs”.
Looking at the Unadjusted Establishment Survey report we see…
Originally the BLS reported employment of 158.918 million for May
which they now adjusted to 158.845 million.
They are currently reporting 159.392 million jobs for June which is actually an increase of 474,000 jobs compare to what they first reported or 547,000 compared to their new numbers.
The LFPR was up from 62.5% to 62.6%.
Good News for the Market?
In the perverse stock market of these post-pandemic days, the market is looking for an excuse for the FED to cut interest rates so “Bad News is Good News” for the market.
The news wasn’t bad enough to spark a major rally but after falling initially, at around 10:30 AM the market turned around and rallied for the rest of the day taking it to slightly above the previous day’s close. So basically a giant “nothing burger”.
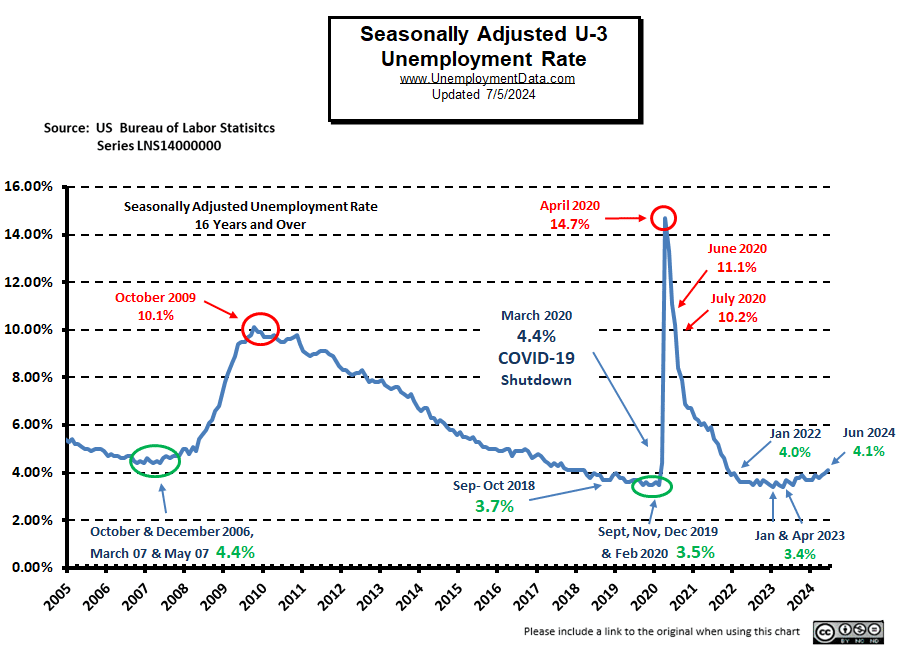
Current Unemployment Rate Chart
Seasonally Adjusted U3 Unemployment remains above the pre-COVID 2019 cyclical lows of 3.5%, but is approaching the yellow zone.
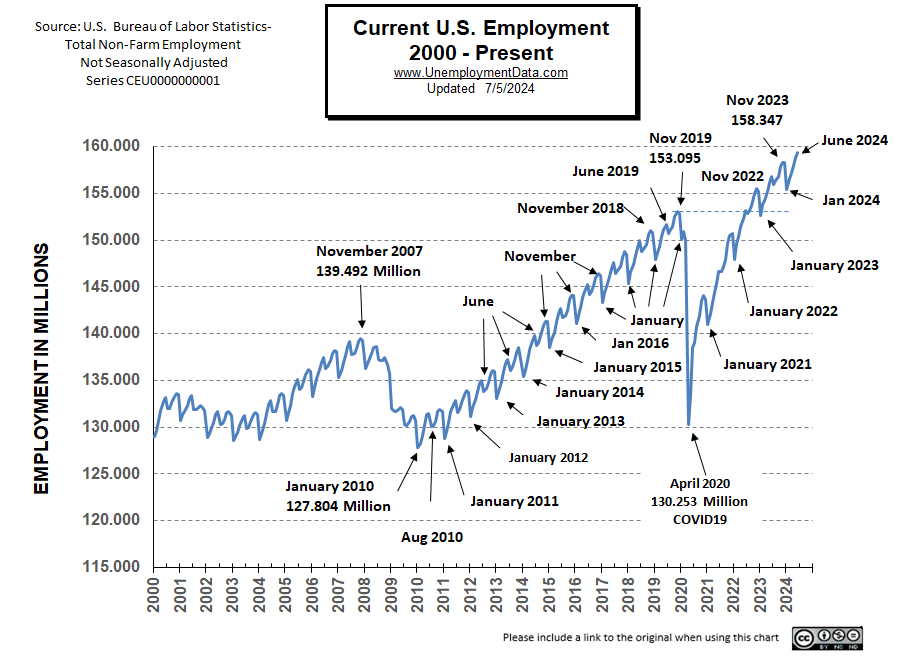
Current Employment Rate
Employment is Up from the originally reported 158.918 million in May to 159.392 million. Typically, the low point for each year occurs in January and then employment moves almost straight up to a small peak around June. So, we could see lower employment next month.
Employment is 2,550,000 Above Year-Ago Levels and 8.424 million above February 2020 (prior to the Covid Crash)
However, the Civilian Population has also increased by about 8.81 million since February 2020 (probably not counting the millions of illegal aliens that have come since then).
See Current Employment for more information.
BLS: June 2024 Employment by Sector
The BLS employment “bubble chart” based on the Establishment Survey Data gives us a good picture of the Seasonally adjusted employment numbers.
The Bubble’s Size tells us the total Employment for that industry (i.e., larger bubbles mean more people are employed in that sector).
The bubble’s location on the chart tells us that there has been a change in Employment Levels over the most recent month… A bubble further to the right indicates larger job growth. A bubble’s vertical location on the chart shows the average industry salary.
Remember, these are Seasonally Adjusted Numbers, so they aren’t cumulative!
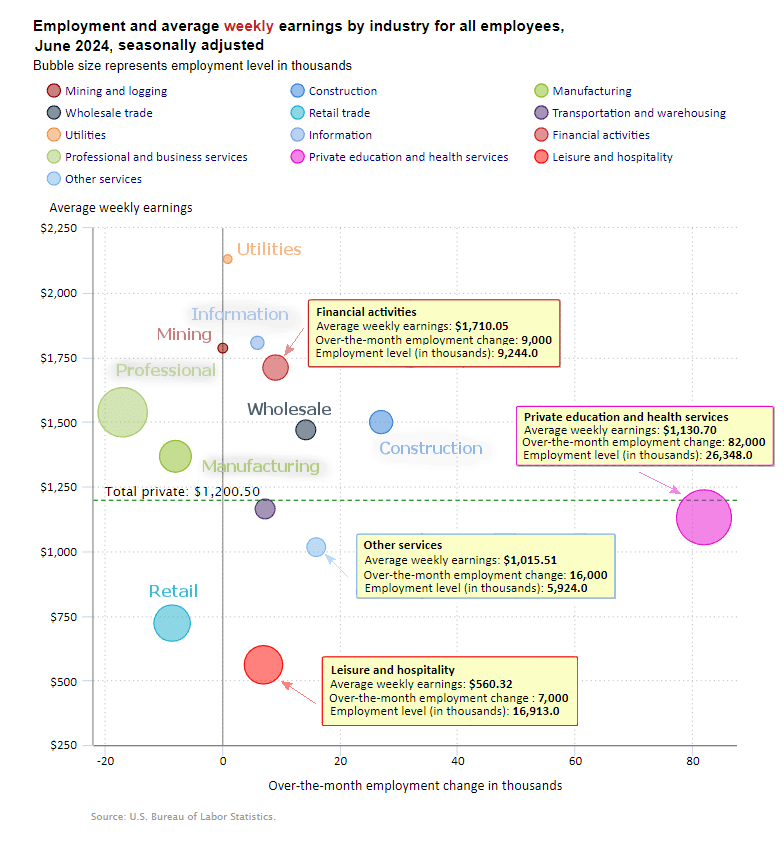
According to the BLS, Retail, Manufacturing, and Professional all lost jobs in June.
Education and Health added 82,000 jobs in June. Construction added 27,000 jobs and Leisure and Hospitality Services added 7,000 jobs.
BLS Average Weekly Wages
| Date | Average Weekly Wage |
| June 2024 | $1,200.50 |
| May 2024 | $1,197.41 |
| April 2024 | $1,191.93 |
| March 2024 | $1,193.34 |
| February 2024 | $1,185.75 |
| January 2024 | $1,178.16 |
| December 2023 | $1,175.46 |
| November 2023 | $1,173.04 |
| October 2023 | $1,166.20 |
| September 2023 | $1,165.47 |
| August 2023 | $1,163.41 |
| July 2023 | $1,157.28 |
| June 2023 | $1,155.15 |
| May 2023 | $1,146.99 |
| April 2023 | $1,147.58 |
| March 2023 | $1,141.34 |
| February 2023 | $1,141.61 |
| January 2023 | $1,146.14 |
| December 2022 | $1,125.73 |
| November 2022 | $1,129.01 |
| October 2022 | $1,124.01 |
| September 2022 | $1,119.87 |
| August 2022 | $1,116.42 |
| July 2022 | $1,116.54 |
| June 2022 | $1,106.76 |
| May 2022 | $1,105.47 |
| April 2022 | $1,102.01 |
| December 2021 | $1,086.46 |
BLS Employment and Average Weekly Earnings by Industry
June 2024, Seasonally Adjusted Employment
Note that due to “seasonal adjusting,” although they may claim that there was a “monthly increase” (or decrease), there isn’t always an actual increase; you can’t just subtract last month’s “employment level” from this month’s level. For instance, Mining employment was supposed to have been unchanged in June. But May had 633,000 and June had 634,000 which looks like a 1,000 job increase. And Manufacturing went from 12,965,000 to 12,950,000 which looks like a -15,000 job decrease but due to adjusting it is only a -8,000 decrease.
| Industry | Monthly Increase | June Ave. Weekly Earnings | June Employment Level | May Employment Level |
| Total Private Employment | 136,000 | $1,200.50 | 135,274,000 | 135,224,000 |
| Mining and Logging | 0 | $1,785.28 | 634,000 | 633,000 |
| Construction | 27,000 | $1,499.30 | 8,245,000 | 8,228,000 |
| Manufacturing | -8,000 | $1,366.80 | 12,950,000 | 12,965,000 |
| Wholesale trade | 14,200 | $1,469.13 | 6,181,100 | 6,163,400 |
| Retail trade | -8,500 | $721.57 | 15,674,800 | 15,697,200 |
| Transportation and Warehousing | 7,300 | $1,163.15 | 6,593,700 | 6,583,500 |
| Utilities | 900 | $2,129.78 | 589,600 | 588,200 |
| Information | 6,000 | $1,805.84 | 3,027,000 | 3,014,000 |
| Financial Activities | 9,000 | $1,710.05 | 9,244,000 | 9,234,000 |
| Professional and Business Services | -17,000 | $1,537.17 | 22,950,000 | 22,985,000 |
| Private Education and Health Services | 82,000 | $1,130.70 | 26,348,000 | 26,279,000 |
| Leisure and Hospitality | 7,000 | $560.32 | 16,913,000 | 16,947,000 |
| Other Services | 16,000 | $1,015.51 | 5,924,000 | 5,907,000 |
Source: BLS
ADP® National Employment Report
ADP provides an independent (non-government) estimate of private-sector employment and pay, based on data derived from ADP client payrolls. According to ADP®, In collaboration with Stanford Digital Economy Lab.
ADP: Private employers added 150,000 jobs in June
(This was slower growth than May’s 152,000)
- Job creation among private employers slowed for the third straight month.
- Job gains had already slowed in May due to a steep decline in manufacturing. Leisure and hospitality also showed weaker hiring.

Source: ADP®
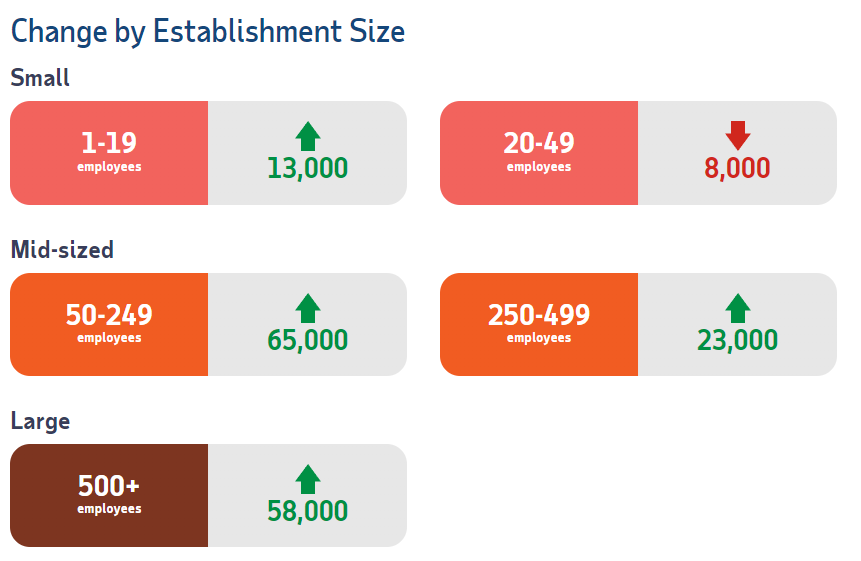
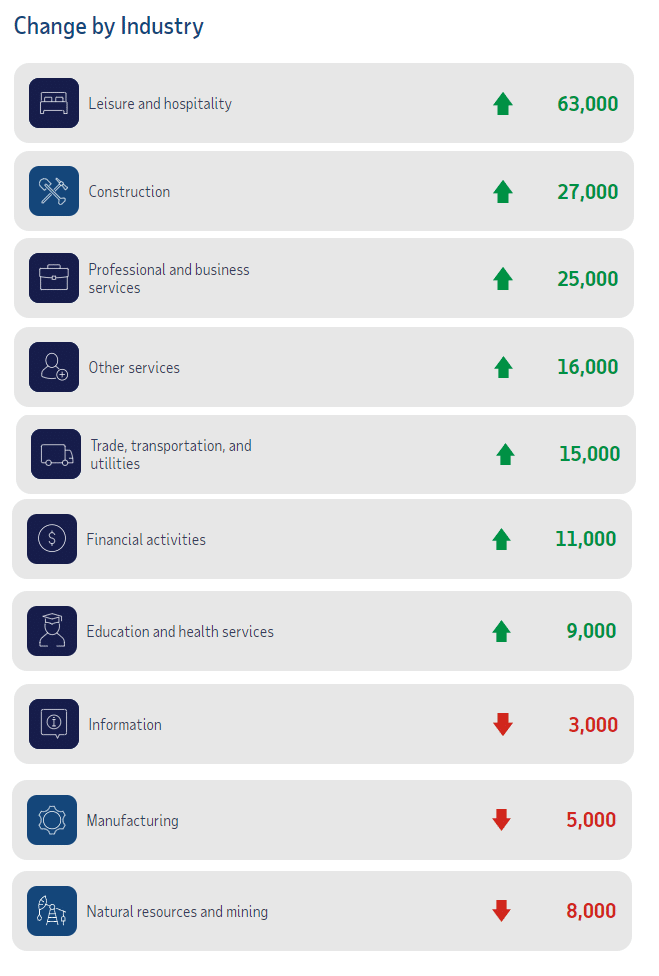
ADP Private Employment by Establishment Size
As we can see from the graphic below most establishment sizes had positive gains. The only sector that declined slightly were those establishments with 20-49 employees.
June ADP Changes:
ADP Job Gainers / Losers
ADP provides an entirely different picture of the job situation compared to the BLS perspective. For instance while the ADP says Leisure and Hospitality gained 63,000 jobs, BLS says they gained 7,000 jobs.
Unemployment
June’s Seasonally Adjusted Unemployment is up from 4.0% to 4.1%.
Labor Force Participation Rate
The LFPR is up slightly from 62.5% to 62.6%.
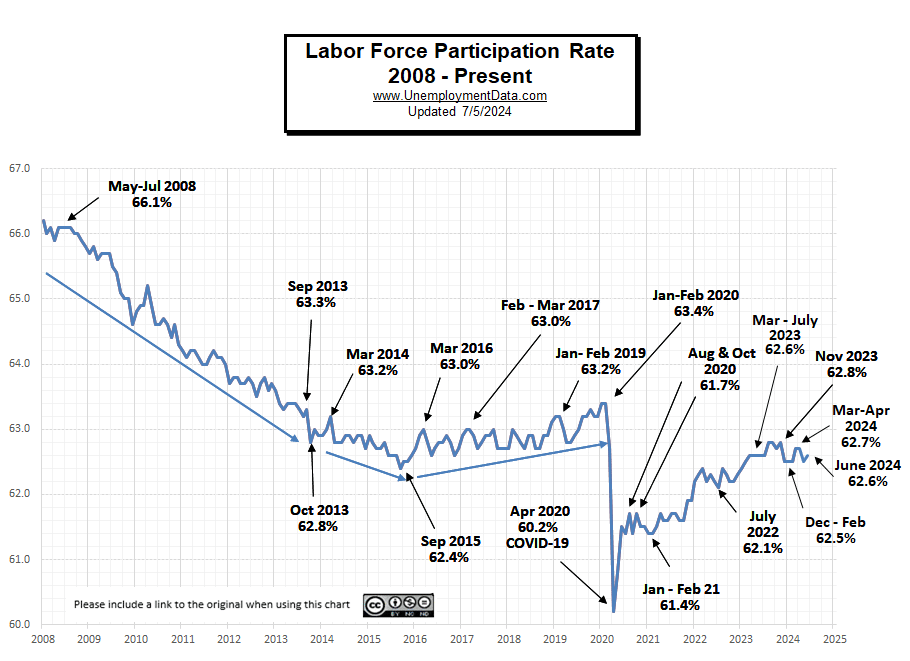 See Labor Force Participation Rate for more information.
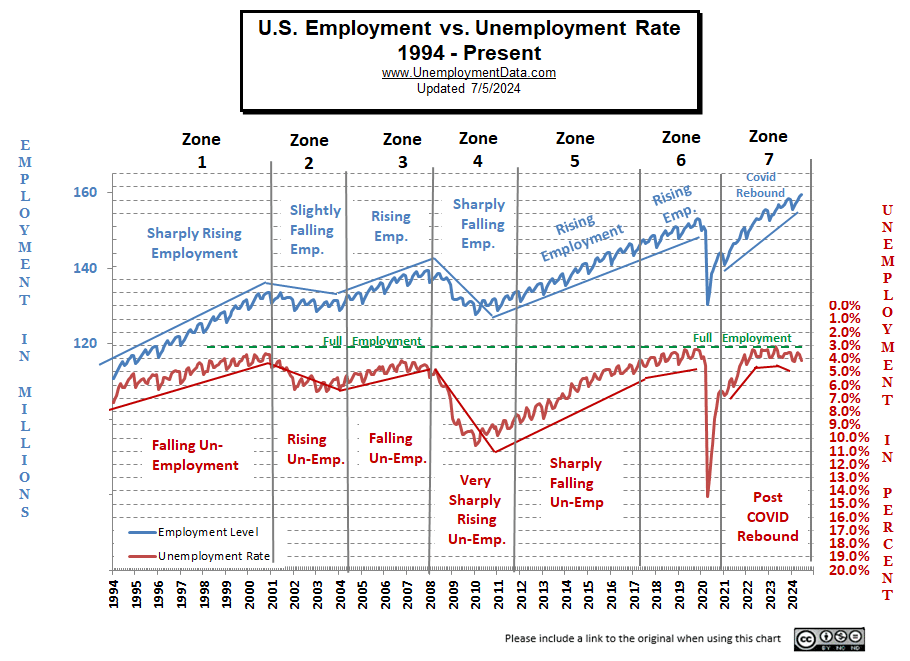
Less Than Full Employment
This chart compares employment levels with the (inverted) unemployment rate.
Full Employment is when everyone who wants a job has one. It is generally considered to be around 3%. After the unemployment rate almost touched the magic full employment line in April 2023, it began moving away (i.e., higher unemployment).
Note: The Unemployment rate is inverted to track the employment rate. Neither is Seasonally Adjusted. For more information see Employment vs. Unemployment.
Note: Full employment is not considered to be at zero percent because even when employers are having difficulty finding employees, some people are still unemployed due to either:
- structural unemployment (mismatch between worker skills and job requirements, i.e., not enough training) or
- frictional unemployment There will always be people who have quit or have lost a seasonal job and are in the process of getting a new job. Or
- Simply because they quit their job knowing it would be easy to find another (hopefully better) job.
Seasonally Adjusted U1 through U6 Unemployment Rates
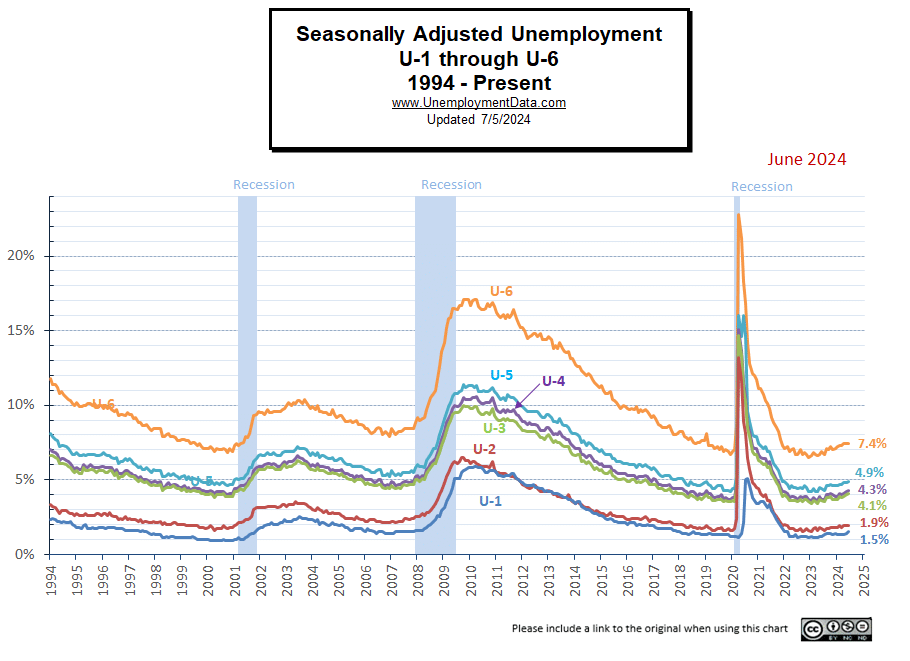 For more information about the various measurements of unemployment, see What Is U-6 Unemployment?
Seasonally Adjusted Unemployment by Education
This chart does refute the idea that getting a college education doesn’t help you find a job. Those with a 4 year degree have half the unemployment level than someone with only a High School diploma. But it doesn’t show whether they are “underemployed” i.e. working as a Barista at Starbucks or flipping burgers at McDonalds. And these numbers only apply to people over the age of 25 (so they have had some time to settle in).
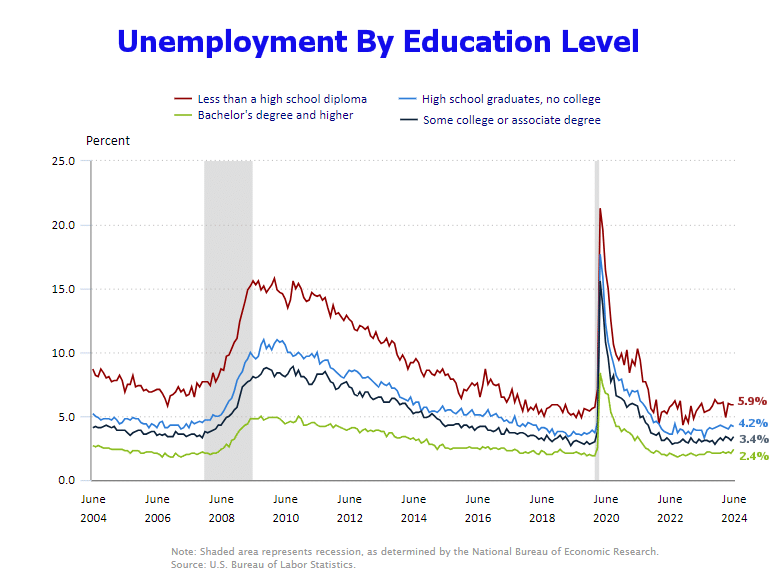
Source: BLS
Employment-Population Ratio
This month we broke out the Employment-Population Ratio by gender. Showing that Men make up a much larger portion of the workforce, i.e., 67.8% of men are employed (compared to 67.3% last month) and only 56.5% of women are employed. But…
As you can see 20 years ago, back in 2004, almost 72% of men were working and 57% of women were working. In 2008 the Great Recession caused a massive decline in employment for both men and women. By December of 2009, only 66.4% of men were working and 55.4% of women. Over the next decade, women workers rebounded to 57.5% but men only rebounded to 69.3%.
Now less than 68% of men are working and 56.5% of women are working, so it isn’t women who have left the workforce but men. Perhaps there are more stay-at-home Dads because their wives could earn more? Or more men decided to retire in 2009 and 2020, rather than bother returning to the workforce.
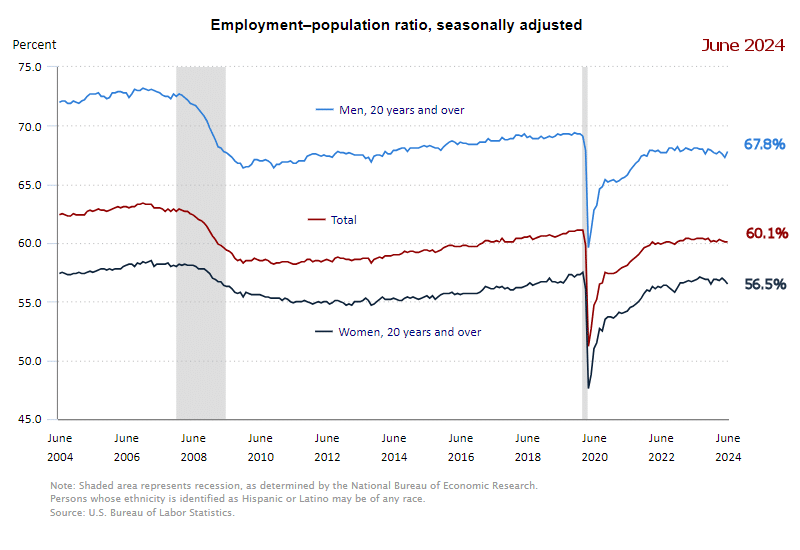 See Employment Population Ratio for more information.
Read more on UnemploymentData.com.
- Why Consumer Sentiment Fell To A Seven-Month Low
- From Layoff to Lift-Off: Starting Your Own Construction Business
- How To Excel As An Electric Vehicle Technician
- The American Labor Market: Fact vs. Fiction
From InflationData.com
- Inflation’s Hidden Impact on Healthcare: What’s Driving Costs Up?
- The Death of the PetroDollar
- May Inflation Surprisingly Mild
- If Trump Won the 2020 Election Would Inflation Be Lower?
From Financial Trend Forecaster
- Moore Inflation Predictor
- NYSE ROC
- NASDAQ ROC
- Bureaucracy: The Red Tape that Prevents Economic Growth
- How Washington and the Fed Caused the Commercial Real Estate Crisis
- The Results Are In: Free Market Capitalism Improves Lives
- The Tectonic Shift in Crypto
- Crypto Goes Mainstream
- Applying the ROC to Crypto
- Economic Education Has Become Economic Disinformation
- Is a China-Taiwan Conflict Likely? Watch the Region’s Stock Market Indexes
- What New York City’s Art Auctions Tell You About the Stock Market — and Social Mood
- Why You Should Pay Attention to This Time-Tested Indicator Now
- Gold: Setting Near-Term Price Targets
- Bob Prechter on the Rich Dad Radio Show
From OptioMoney
- The Importance of Financial Wellness Programs in the Workplace
- How Moving to a New Place Impacts Your Spending Patterns
- The “Ins and Outs” of Energy Efficient Windows
- How to Effectively Manage Credit Cards as a Homeowner
From Your Family Finances