
 The U.S. Bureau of Labor Statistics (BLS) released the newest unemployment data for January 2017 on Friday, February 3rd. According to the BLS, the current “Seasonally Adjusted” Unemployment Rate is 4.8% up from 4.7% in December and 4.6% in November but still below the 4.9% in October.
The current “Unadjusted” rate is 5.1% up from 4.5% in December and 4.4% in November. Typically unadjusted unemployment rates jump in January for “Seasonal” reasons which is why we see a large jump in the unadjusted rates but a much smaller jump in the seasonally adjusted unemployment rate. See Current Unemployment Rate for more info.
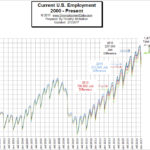 The number of Unadjusted jobs reported for January was 143.220 million down from November’s previous peak of 146.418 million. Although the Commissioner’s statement says, “Nonfarm payroll employment rose by 227,000 in January” what he is actually talking about is seasonally adjusted jobs. He also went on to say, “Following our usual practice, there were routine annual adjustments to the data from our two surveys. The establishment survey data released today reflect the incorporation of annual benchmark revisions. Each year, we re-anchor our sample-based survey estimates to full universe counts of employment, primarily derived from the Quarterly Census of Employment and Wages, which enumerates jobs covered by the unemployment insurance tax system. The effect of these revisions on the underlying trend in nonfarm payroll employment was minor.” For More information see: Current Employment Situation.
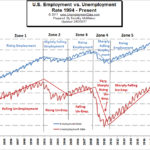
Employment vs. Unemployment- you would think that they would simply be the inverse of each other and that is exactly what we did in this chart. The BLS uses two entirely different surveys to obtain employment numbers and unemployment numbers so by comparing them you can see how they compare and where they don’t track exactly right. See: Current employment vs. unemployment chart.
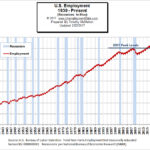
Historically employment is closely tied to recessions and that is no accident. One of the primary factors in calculating whether the economy is officially in a recession is an increase in the unemployment rate. The chart below provides the Historical Employment Data overlaid on blue bars showing periods of official recessions.
See the historical employment chart
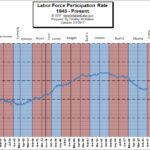 According to the Bureau of Labor Statistics the “Labor Force” is made up of both employed and unemployed people. Unemployed people are defined as those who are actively looking for work. Once you stop looking (i.e discouraged workers) you are no longer in the official labor force. Since U-3 only measures those who are actively looking for a job, if the entire labor force declines (i.e. lots of people stop looking) the U-3 rate will appear better than it actually is. So, in order to compare two time periods you have to adjust for the the LFPR. See Labor Force Participation Rate.
You might also like:
- Managing Your Money and Your Expectations For Retirement
- Social Security Benefits: Planning for Your Future
- 5 Careers to Consider for 2017
- Building Your Credit While Avoiding the 5 Top Financial Mistakes
- Retirement Tips You May Not Have Considered
- 4 Insightful Ways to Start the Home-Buying Process
- The Oil War Just Getting Started
- Oil Prices Running Out Of Reasons To Rally?
- December Inflation Rate Finally Tops 2%
- 4 Tips For Building Financially Stability
- Getting the most from Your Retirement Plan
- Top Things to Consider When Saving for Retirement
- Learning to Recognize Trade Setups with “MACD”