U-3 Unemployment
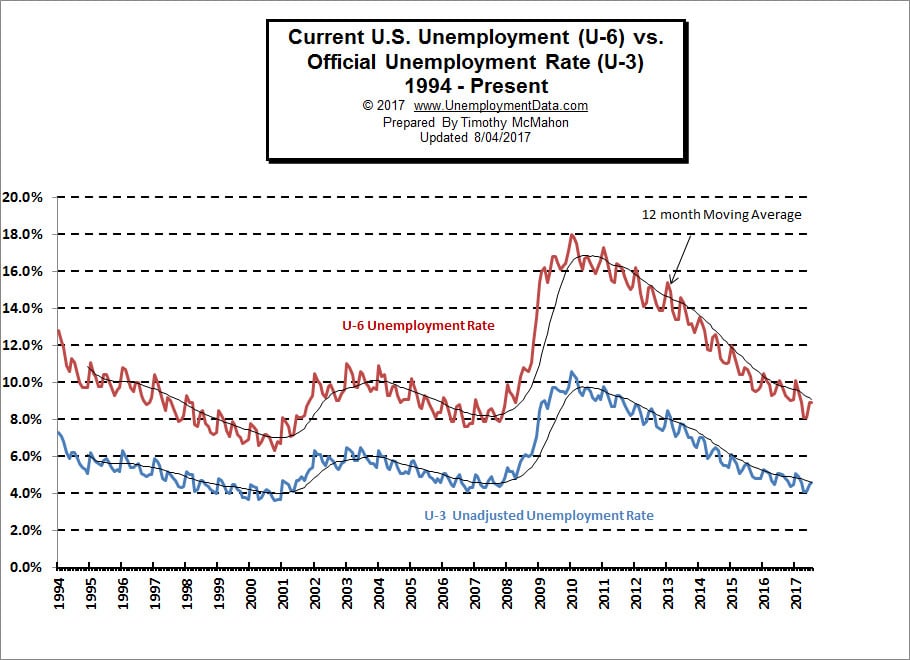
The U.S. Bureau of Labor Statistics (BLS) released their employment and unemployment numbers for July on Friday August 4th. The Seasonally adjusted U-3 unemployment rate was down from 4.4% in June to 4.3% in July. Unadjusted U-3 however was up from 4.5% to 4.6%. U3 is the Official unemployment rate per the International Labor Organization definition. It occurs when people are without jobs and they have actively looked for work within the past four weeks.
 U-6 Unemployment
U-6 unemployment is the broadest category of unemployment and includes U3 plus “discouraged workers”, plus other “marginally attached workers”, plus part-time workers who want to work full-time, but cannot due to economic reasons. U-6 was unchanged from June at 8.9%.
Employment

The Commissioner of the BLS released this statement, “Nonfarm payroll employment rose by 209,000 in July, and the unemployment rate, at 4.3 percent, was little changed. Job gains occurred in food services and drinking places, professional and business services, and health care. Employment growth has averaged 184,000 per month thus far this year, in line with the average monthly gain in 2016 (+187,000). “
However if we look at the actual employment data we get a different picture. Typically employment decreases in July. So what he is saying is that 209,000 fewer jobs than average were lost. But losing fewer that average is not a gain. Looking at the BLS’ own employment numbers we see, in unadjusted terms employment was 146,784,000 in May and 147,407,000 in June and 146,368,000 in July for a net loss of -1,039,000 jobs in July. Thus bringing employment levels roughly 416,000 below May levels. For more info see: Current Employment Data and Historical Employment Data.
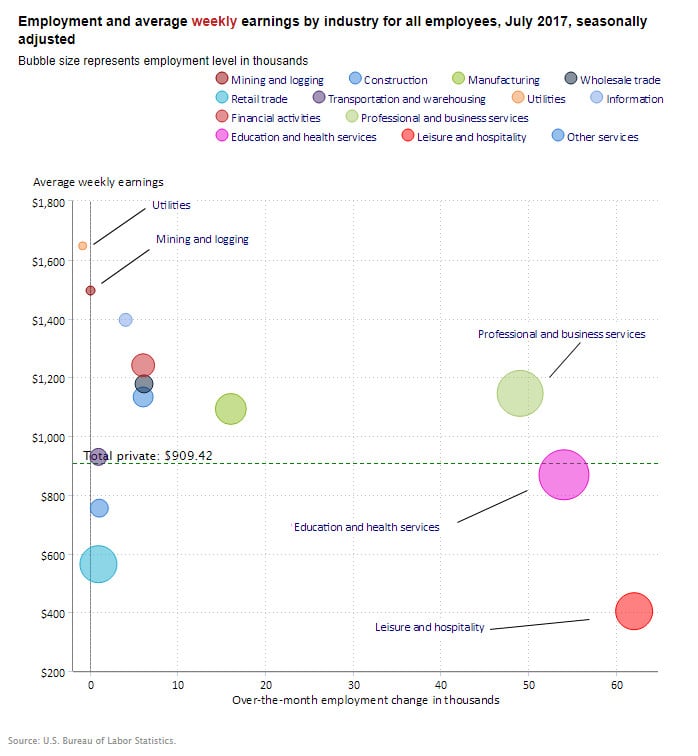
Looking at the individual sectors we can see that the average private salary was $909.42 per week and that two sectors lost minimally i.e. “Utilities” and “Mining and Logging” are each slightly to the left of the zero line and the losses were small, while the big gainers were “Leisure and Hospitality”, “Education and Health Services” and “Professional and Business Services”. Unfortunately, two of the big gainers were below the average salary so even though more people are employed in these industries they aren’t paid very well.
Also remember the caveat from above these are “seasonally adjusted” numbers so the actual losses are bigger.
In Other News:
Gallup Stops Publishing Employment and Unemployment data
Since 2010 the Gallup Polling organization has been using their polling capabilities to determine the current unemployment levels of both U-3 and U-6. As well as publishing a metric they originally called the Payroll to Population rate (P2P) which is simply the percentage of the overall population over 18 that has a job. Later for some strange reason they renamed it the “Good Jobs Metric” which was actually less descriptive than the original name. This metric has hovered below 50% indicating that less than half of the population is working. Compared to the BLS’ Labor Force Participation Rate (LFPR) which has fallen from a peak of about 67% in 1998 to below 63% recently. See: Labor Force Participation Rate for more info. But the LFPR and the P2P do not measure the same thing, although they sound similar. The LFPR includes people who are looking for work thus increasing the percentage and also excludes large segments of the population (i.e. non-civilians) thus also increasing the percentage.
So the fact that Gallup will no longer publish U3, U6 and P2P leaves us without comparisons to the BLS numbers. The P2P especially will be missed. Before we jump to conspiracy theories about why they stopped publishing it could simply be because it is expensive to survey 30,000 people every month and with unemployment rates dropping people may be less interested in the results. To read more about how BLS numbers compared to Gallup numbers go here.
You might also like:
- Unemployment Rates by State
- Employers Compensation Costs Increase
- Employment vs. Unemployment
- Unemployment and Employment Charts
- Bitcoin: The New Safe Haven?
- Investing: The Incredible Power Of Staying In The Now
- The Technical Failure That Could Clear The Oil Glut In A Matter Of Weeks
- Is A Big Move In Oil Prices Due?
- Are Regulations Strangling Free Enterprise?
- Will Solar Energy Finally Catch On?
- eCommerce Trends: What’s in Your eWallet?
- 5 Financial Tips to Keep Your Children Fed While You’re Out of Work
- Saving on Home Renovations
- Teaching Children While Saving for College
- Frugal Finances: 5 Ways to Save Money on Home Bills
- 10 Great Educational Family Vacations
- Taking the Long View of the Market
- When Prices Are Falling, TWO Numbers Matter Most
- SPX CYCLES, FED FUNDS AND GOLD
- Crude Oil Sinks 20% Despite OPEC Production Cuts
- 4 Ways to Protect Your Credit Score
- What to Do if Served Foreclosure Papers
- A Series of Unfortunate Events: How Social Security Disability Can Help
- Why 80 Percent of Americans Shop Online
- 5 Tips to Consider When Purchasing Your First Home

