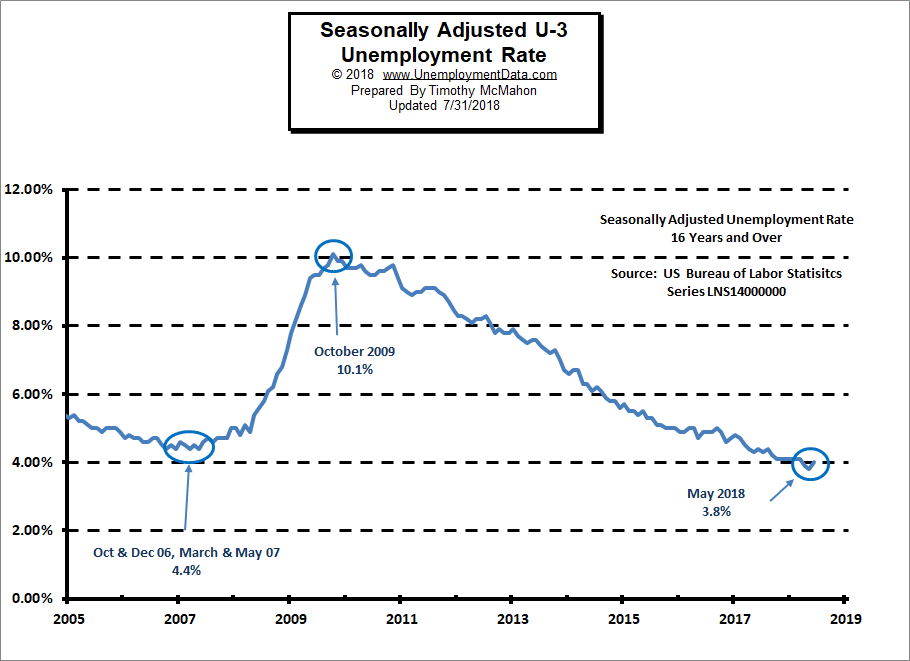
![]() The U.S. Bureau of Labor Statistics (BLS) released their monthly unemployment survey results for October on November 2nd. Unadjusted U-3 and U-6 Unemployment is down again and “Seasonally Adjusted” Unemployment U-3 was 3.7% for the second month in a row. This is the lowest level since December 1969 when it was 3.5%. The lowest level reached in the 1968-1969 timeframe was 3.4% where it hovered from September 1968 through May 1969. The only other time that unemployment was this low since they began tracking unemployment in 1948 was briefly in 1948 and again in 1951-53.
The U.S. Bureau of Labor Statistics (BLS) released their monthly unemployment survey results for October on November 2nd. Unadjusted U-3 and U-6 Unemployment is down again and “Seasonally Adjusted” Unemployment U-3 was 3.7% for the second month in a row. This is the lowest level since December 1969 when it was 3.5%. The lowest level reached in the 1968-1969 timeframe was 3.4% where it hovered from September 1968 through May 1969. The only other time that unemployment was this low since they began tracking unemployment in 1948 was briefly in 1948 and again in 1951-53.
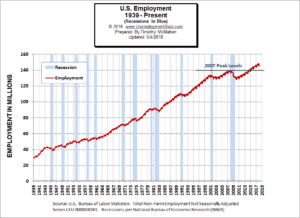
Employment is at an all time record 150.753 million the previous high was set in June 2018. Last month employment was 149.738 million so the actual increase in jobs was over 1 million, although the “Seasonally Adjusted” jobs increase was “only” 250,000. Even that was significantly higher than the projected 208,000.
Previous Record Low Unemployment
| Jan | Feb | Mar | Apr | May | Jun | Jul | Aug | Sep | Oct | Nov | Dec | |
| 1965 | 4.9% | 5.1% | 4.7% | 4.8% | 4.6% | 4.6% | 4.4% | 4.4% | 4.3% | 4.2% | 4.1% | 4.0% |
| 1966 | 4.0% | 3.8% | 3.8% | 3.8% | 3.9% | 3.8% | 3.8% | 3.8% | 3.7% | 3.7% | 3.6% | 3.8% |
| 1967 | 3.9% | 3.8% | 3.8% | 3.8% | 3.8% | 3.9% | 3.8% | 3.8% | 3.8% | 4.0% | 3.9% | 3.8% |
| 1968 | 3.7% | 3.8% | 3.7% | 3.5% | 3.5% | 3.7% | 3.7% | 3.5% | 3.4% | 3.4% | 3.4% | 3.4% |
| 1969 | 3.4% | 3.4% | 3.4% | 3.4% | 3.4% | 3.5% | 3.5% | 3.5% | 3.7% | 3.7% | 3.5% | 3.5% |
| 1970 | 3.9% | 4.2% | 4.4% | 4.6% | 4.8% | 4.9% | 5.0% | 5.1% | 5.4% | 5.5% | 5.9% | 6.1% |
Key October Employment and Unemployment Numbers
- Adjusted U-3 Unemployment- 3.7% unchanged from September down from 3.9% in August.
- Unadjusted U-3 Unemployment- 3.5% down from 3.6% in September and 3.9% in August and 4.1% in July and 4.2% in June.
- Unadjusted U-6 Unemployment- 7.0% down from 7.1% in September and 7.4% in August and 7.9% in July, 8.1% in June.
- Employment 150.753 million up from 149.741 million in September. (Yes over a Million more jobs!)
- October Labor Force Participation Rate 62.9% up from 62.7% in September. (Higher is Better)
See Current Unemployment Chart for more info.
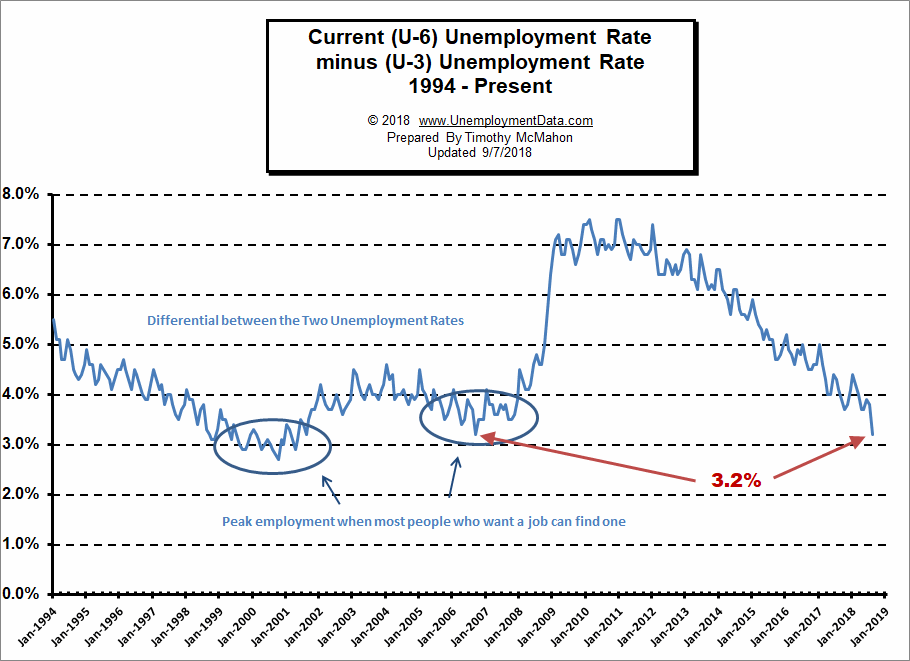
The Differential between U3 and U6 Remains Near September 2006 Lows
Last month the differential between the unadjusted U3 and U6 (reached by subtracting U3 from U6) was at 3.5% and remains there for the 3rd month in a row.
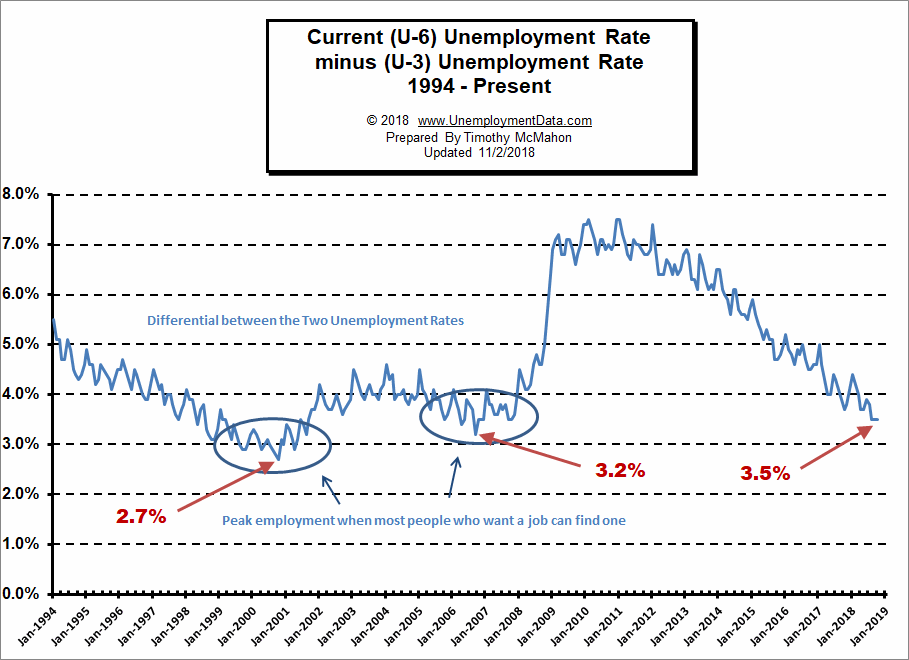
See Current U-6 Unemployment Rate for more info.
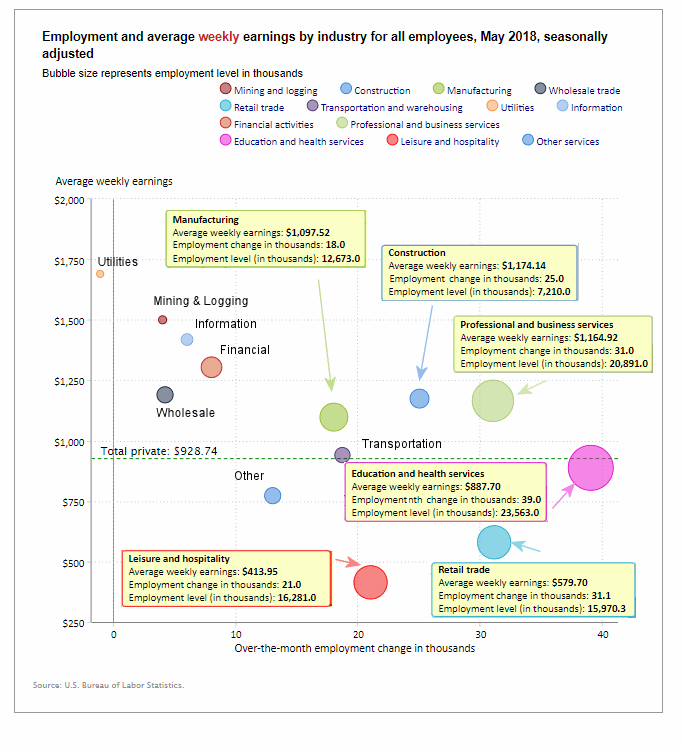
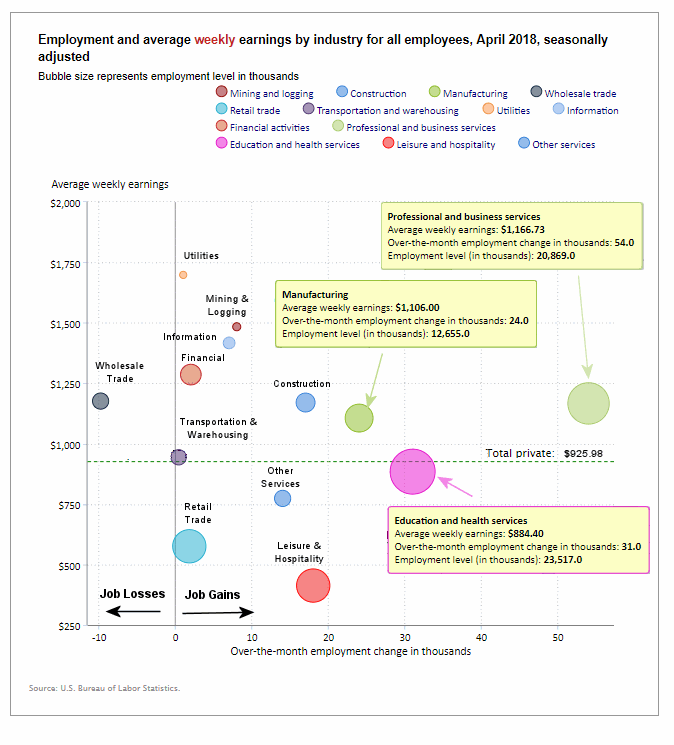
Employment by Sector
The employment “bubble chart” gives us a good representation of how each sector of the economy is doing (employment wise). As we can see from the chart below [Read more…] about October Employment Hits New Record High
 Looking at the broader measure of