![]()
Employment Increased by 1.6 Million in October
The U.S. Bureau of Labor Statistics (BLS) released its employment / unemployment report for October on November 6th.
- Unadjusted U-3 was Down from 7.7% to 6.6%.
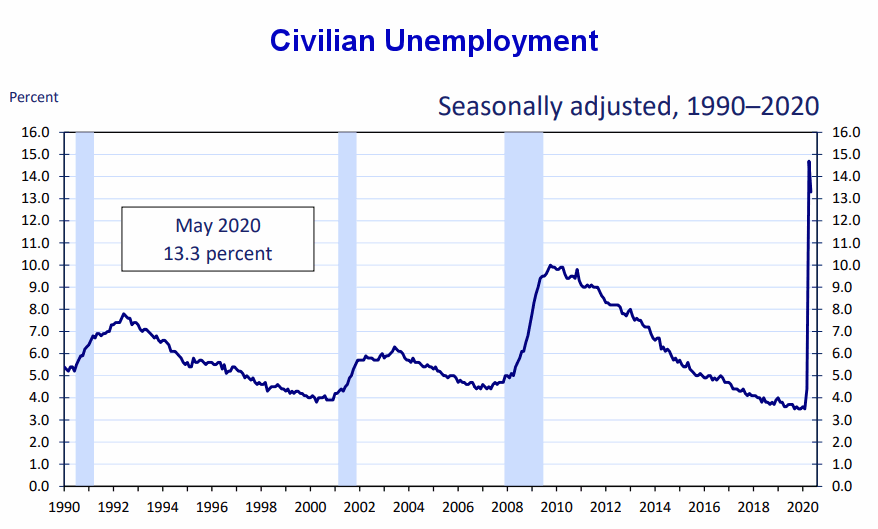
- Adjusted U-3 was Down from 7.9% to 6.9%.
- Unadjusted U-6 was Down from 12.4% to 11.6%.
- Labor Force Participation rose from 61.4% to 61.7%.
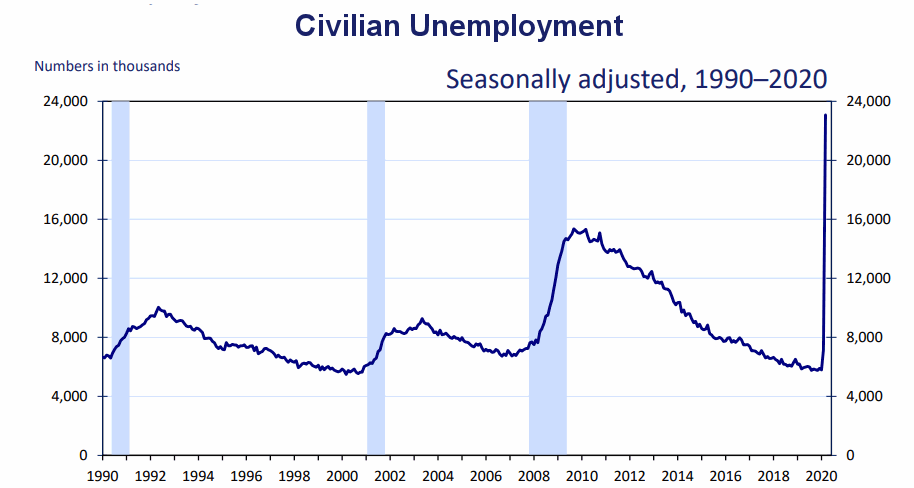
- Unadjusted Employment up from 141.854 million to 143.459 million.
According to the Commissioner of the U.S. Bureau of Labor Statistics:
“Total nonfarm payroll employment rose by 638,000 in October, and the unemployment rate declined to 6.9 percent, the U.S. Bureau of Labor Statistics reported today. These improvements in the labor market reflect the continued resumption of economic activity that had been curtailed due to the coronavirus (COVID-19) pandemic and efforts to contain it. In October, notable job gains occurred in leisure and hospitality, professional and business services, retail trade, and construction. Employment in government declined.”
Of course, they are talking about “Seasonally Adjusted Jobs” from the “Current Population Survey (CPS)” rather than looking at the results reported by actual companies in their “Current Employment Statistics survey (CES)”
But looking at the CES report we see…
Originally the BLS reported 141.855 million jobs for September, this month they only adjusted that slightly.
So currently they are saying 141.854 million jobs for September and 143.459 million for October.
which is actually an increase of 1,604,000 jobs based on their original estimates.