May 2022 Employment — Bureau of Labor Statistics (BLS) Jobs Report
![]()
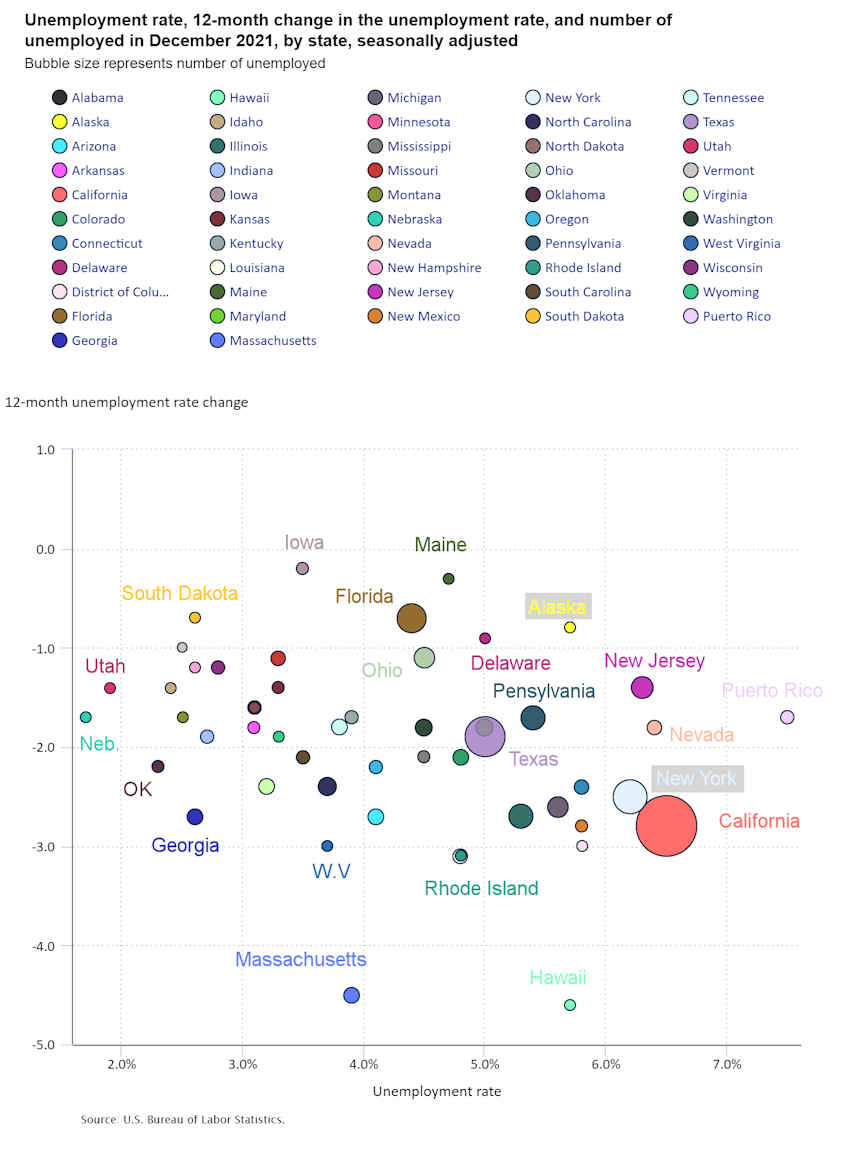
- Adjusted U-3 was Unchanged at 3.6%
- Unadjusted U-3 was Up from 3.3% to 3.4%
- Unadjusted U-6 was Up from 6.6% to 6.7%
- Labor Force Participation Up from 62.2% to 62.3%
- Unadjusted Employment rose from 150.964 to 151.773 million
According to the Commissioner of the U.S. Bureau of Labor Statistics:
“Nonfarm payroll employment increased by 390,000 in May, and the unemployment rate remained at 3.6 percent. Notable job gains occurred in leisure and hospitality, in professional and business services, and in transportation and warehousing. Employment in retail trade declined. Nonfarm employment is down by 822,000, or 0.5 percent, from its February 2020 level before the onset of the coronavirus (COVID-19) pandemic.
In May, employment growth continued in leisure and hospitality (+84,000)… Employment in professional and business services increased by 75,000 in May… Transportation and warehousing added 47,000 jobs…”
You can read the full BLS report here.
As usual, they are talking about “Seasonally Adjusted Jobs” from the “Household Survey” rather than looking at the results reported by actual companies in the BLS “Establishment Survey”
But looking at the Establishment Survey report we see…
Originally the BLS reported employment of 150.938 million for April which they adjusted to 150.964 million. So they added 26,000 jobs disappeared for April. They are reporting 151.773 million jobs for May which is actually an increase of 835,000 jobs based on their original estimates or an increase of 809,000 based on their updated numbers.
Surprisingly, Retail LOST -60,700 jobs.
According to Trading Economics:
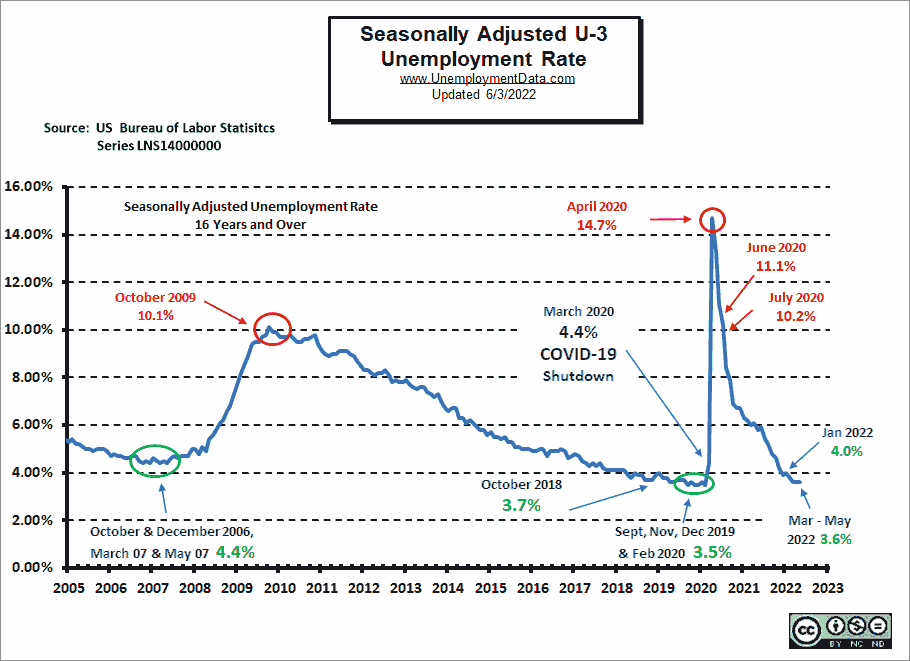
The US unemployment rate was unchanged at 3.6 percent in May of 2022, the same as in the previous two months, remaining the lowest since February 2020 and compared with market expectations of 3.5 percent. The number of unemployed people increased by 9 thousand to 5.950 million, while employment levels rose by 321 thousand to 158.426 million. Meanwhile, the labor force participation rate edged up to 62.3 percent in May from a 3-month low of 62.2 percent in April.
Stroudsburg PA News headline says “Lowest Unemployment Rate since 1969” … Umm No! Not really… the article text backtracks a little adding the word “about” saying… “about the lowest it has been since 1969.” I suppose that is “almost true” if you disregard the 4 months in 2019 and 2020 when it was lower (i.e. 3.5%) and 3.6% is almost 3.4%. I guess that is what passes for journalism these days.
[Read more…] about May Employment Up – Unemployment Unchanged