• About WordPress
    • WordPress.org
    • Documentation
    • Learn WordPress
    • Support
    • Feedback
  • Log In
  • Skip to primary navigation
  • Skip to main content
  • Skip to primary sidebar
  • Home
  • Contact us
  • Related Sites
    • InflationData.com
    • Financial Trend Forecaster
    • Your Family Finances
    • Elliott Wave University
    • Optio Money
  • About
    • Terms of Use
    • Disclaimer & Disclosure
    • Privacy Statement
  • Sitemap
    • 2009-2010 Posts
    • 2011 Posts

UnemploymentData.com

Your Source for Employment and Unemployment Data

Unemployment
  • Charts
    • Current Unemployment Rate Chart
    • Current Employment (Chart and Data)
    • Current Employment vs Unemployment Chart
    • Historical Employment Data
    • Employment Population Ratio
    • Misery Index
  • Unemployment
    • Historical Unemployment Rate Tables
    • What Is U-6 Unemployment?
    • Unadjusted vs. Seasonally Adjusted U-3 Unemployment Rate
    • BLS vs. Gallup Unemployment Numbers
    • Current U-6 Unemployment Rate
    • What is the Labor Force Participation Rate?
    • What is the Real Unemployment Rate?
  • Employment
    • Current Employment (Chart and Data)
    • Historical Employment Data
    • Contacting a Live Person at the State Employment Commission
      • How to Talk to a Live Person at the Virginia Unemployment Commission
      • Florida’s FLUID Unemployment Program
    • Benefits
      • Insurance
      • Retirement
    • Careers
    • Employment Costs
    • Experience
    • Government
    • Job Hunting
      • Interview
      • Resume
  • Find Articles
  • Education
    • Skills
  • General
    • Small Business
      • Outsourcing
    • Success
You are here: Home / Archives for unemployment

unemployment

February 2023 Unemployment Report

March 11, 2023 by Tim McMahon

The U.S. Bureau of Labor Statistics (BLS) released its employment / unemployment report for February on March 10th 2023.

Employment Up and Unemployment Up? 

Adj U3 Icon 3-6 up


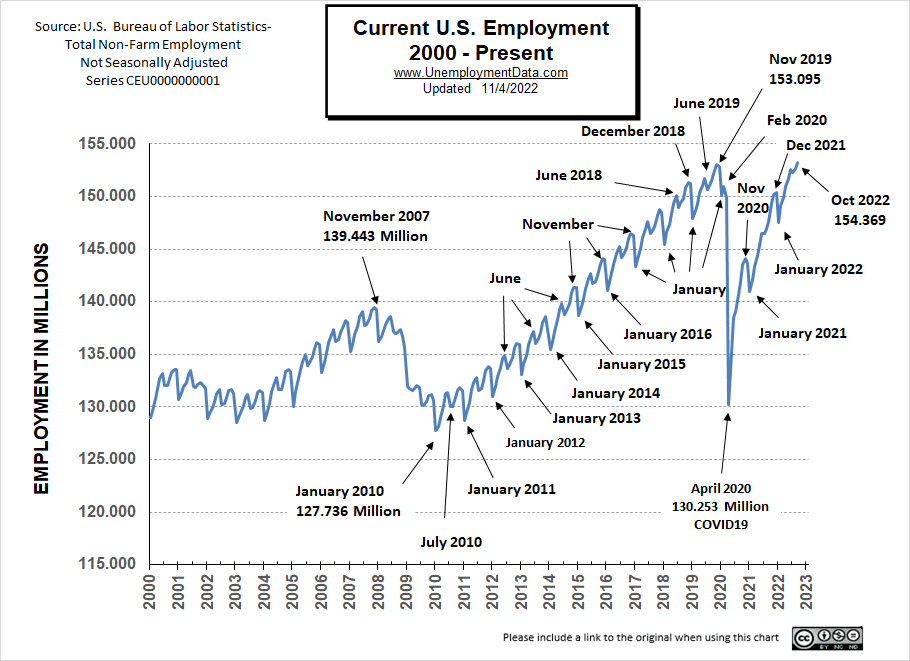
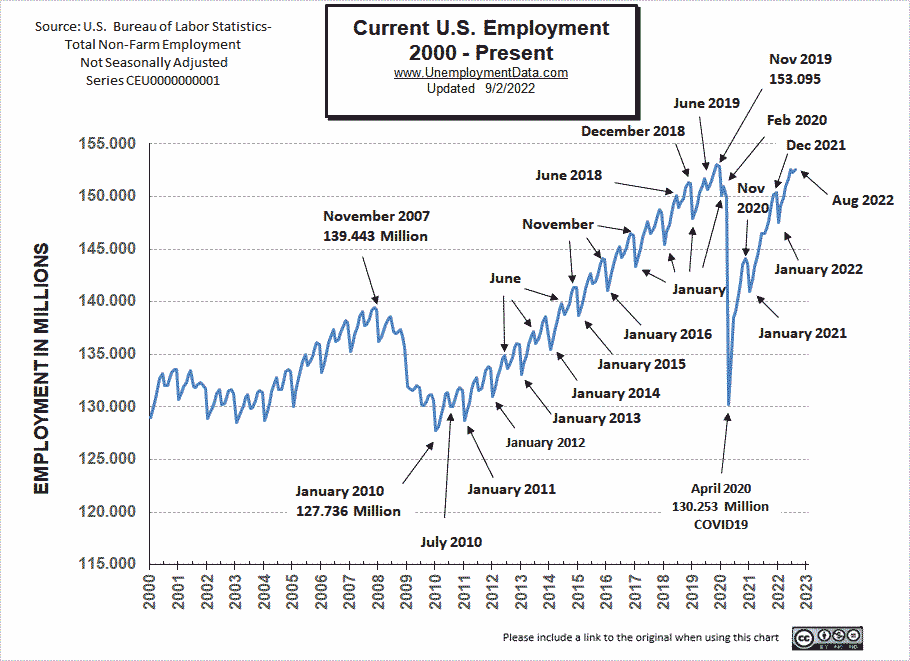
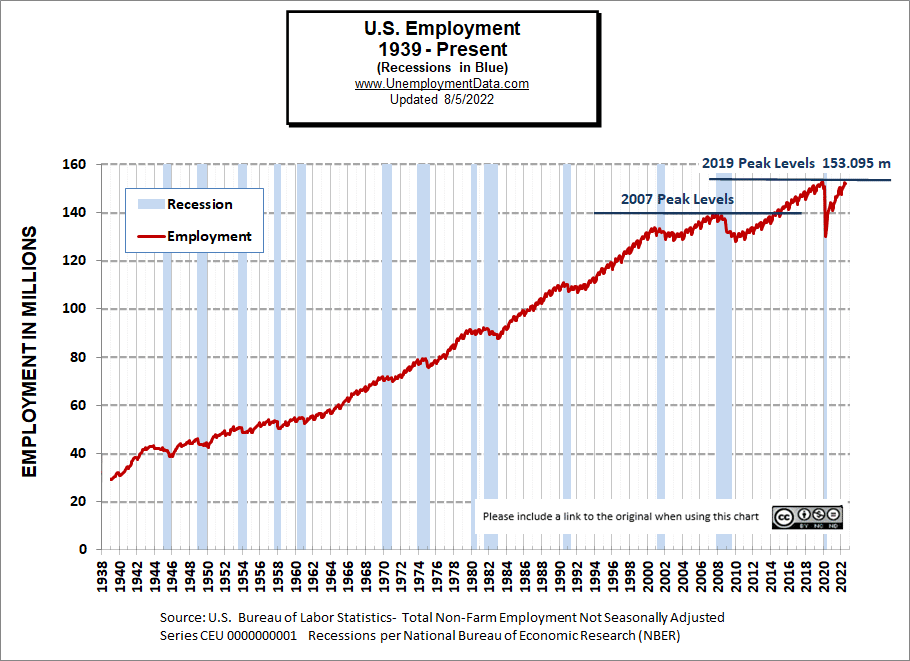
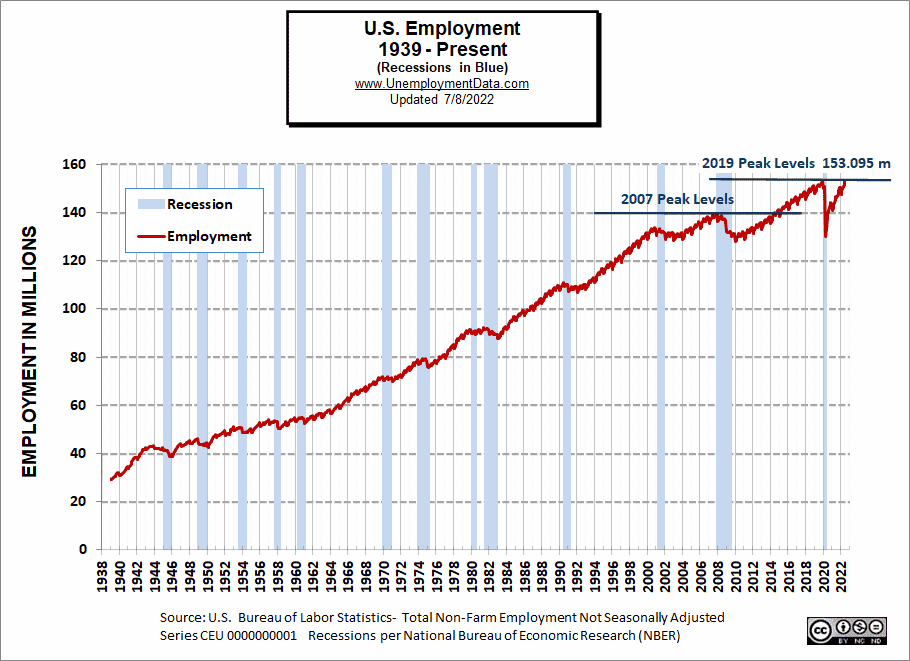
  • Unadjusted Employment rose from 152.836 million to 153.955 million
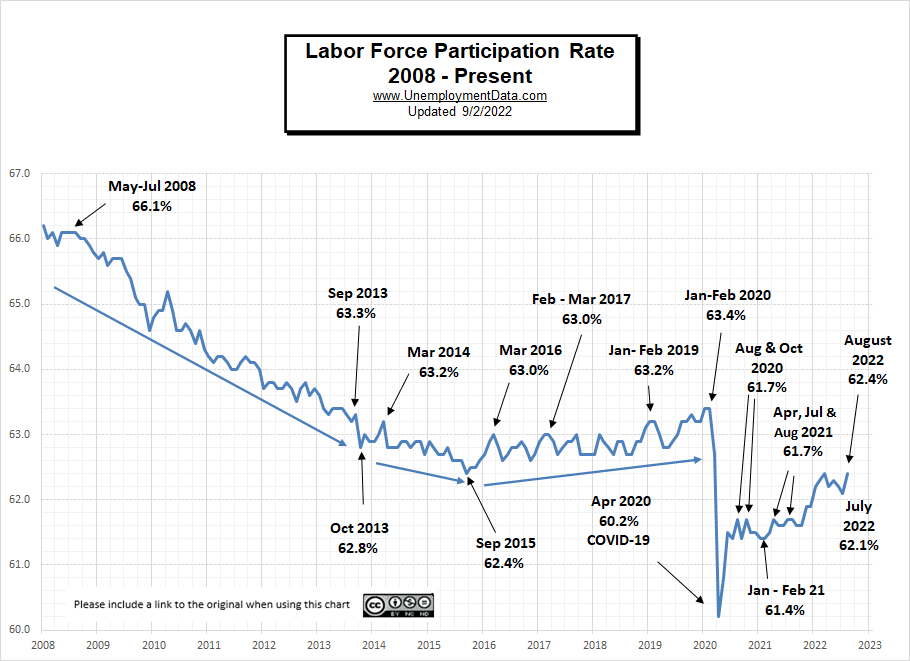
  • Labor Force Participation rose from 62.4% to 62.5%
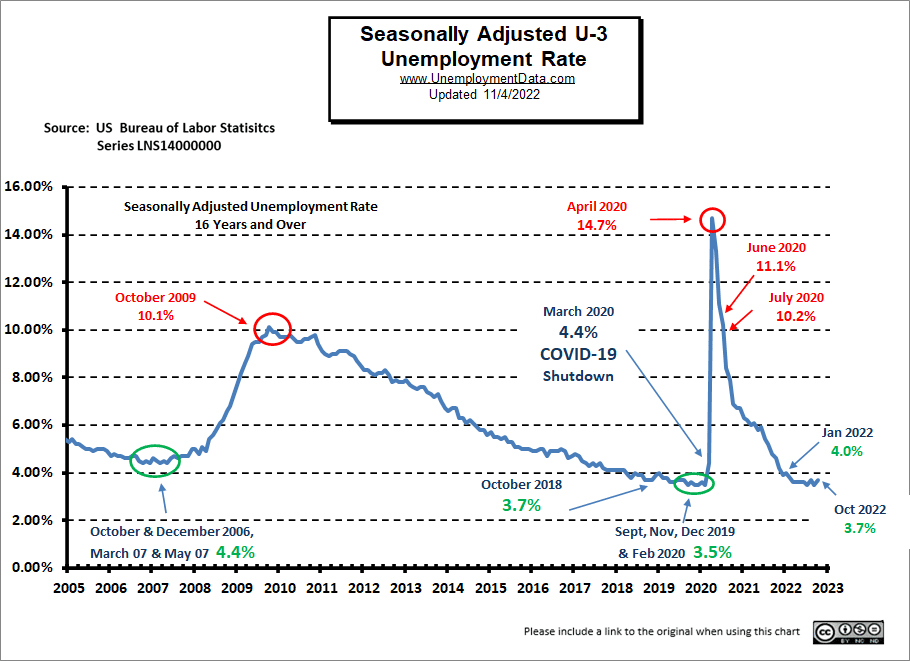
  • Adjusted U-3 rose from 3.4% to 3.6%
  • Unadjusted U-3 unchanged at 3.9%
  • Unadjusted U-6 fell from 7.4% to 7.3%


According to the Commissioner of the U.S. Bureau of Labor Statistics:

“Total nonfarm payroll employment rose by 311,000 in February, and the unemployment rate edged up to 3.6 percent, the U.S. Bureau of Labor Statistics reported today. Notable job gains occurred in leisure and hospitality, retail trade, government, and health care. Employment declined in information and in transportation and warehousing.”

You can read the full BLS report here.

As usual, they are talking about “Seasonally Adjusted Jobs”.

Looking at the Unadjusted Establishment Survey report, we see…

Originally the BLS reported employment of 152.844 million for January, which they adjusted down slightly to 152.836 million.

The current estimate for February is 153.955 million which is up 1.11 million from the original number and up 1.12 million from the revised numbers. According to the BLS, this increase didn’t change the unadjusted U-3 number and actually resulted in an increase in unemployment on a seasonally adjusted basis.

ADP® National Employment Report

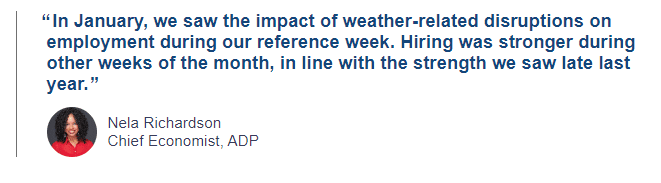
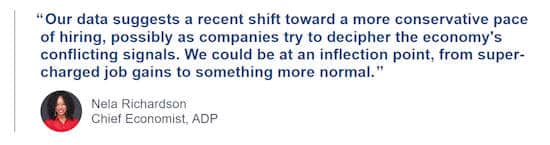
According to ADP In collaboration with Stanford Digital Economy Lab, private employment was up from January to February by 242,000.

ADP: Private employers added 242,000 jobs in February

Nela Richardson Feb 2023


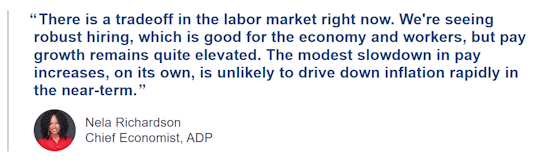
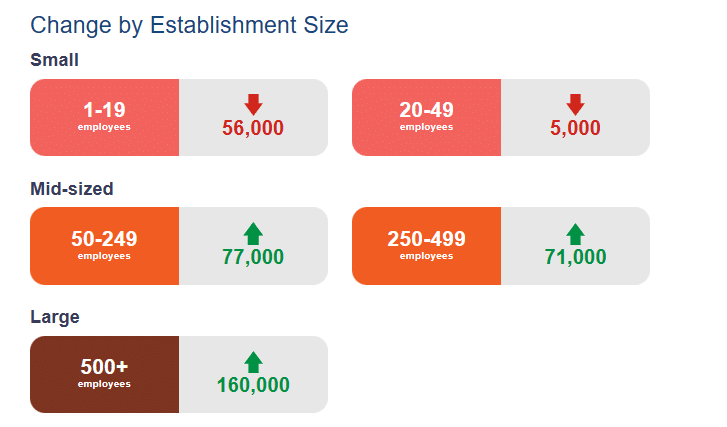
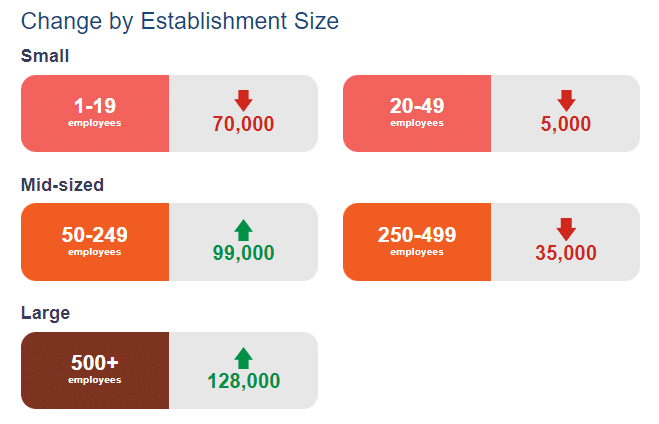
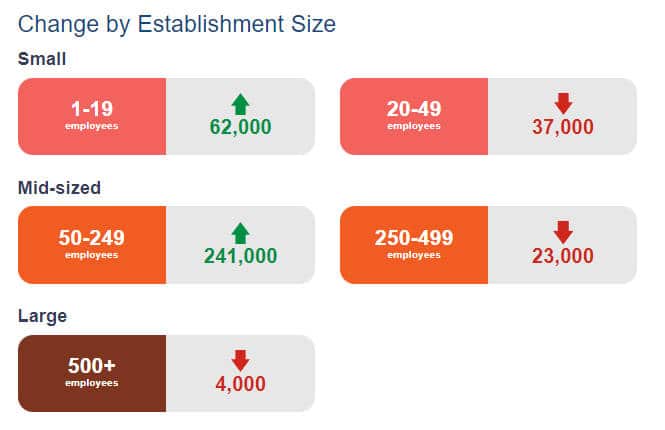
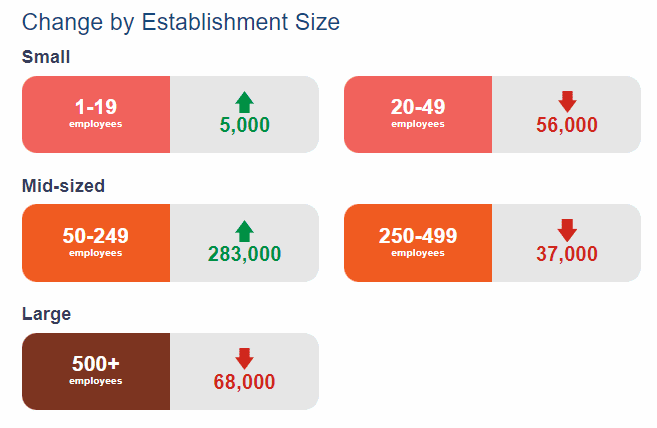
ADP also lists increases by “firm size” and they posted this comment:

  • Job gains are solid and wage growth remains elevated. A particular area of weakness is with small establishments, which shed jobs every month since August 2022.

But their December report showed small businesses gaining.

December Changes:

ADP Change by Establishment Size

February Changes:


Change by Est Size for Feb 2023

ADP Also Tracks Salary Changes:

[Read more…] about February 2023 Unemployment Report

Filed Under: BLS Tagged With: BLS, Bureau of Labor Statistics, employment, February 2023, Salary, unemployment

January Employment / Unemployment Report

February 4, 2023 by Tim McMahon

The U.S. Bureau of Labor Statistics (BLS) released its employment / unemployment report for January on February 3rd 2023.

Employment Down or Up? – Unemployment Down? 

Adj U3 Icon 3-4 dn


  • Unadjusted Employment fell from 155.349 million to 152.844
  • Labor Force Participation rose from 62.3% to 62.4%
  • Adjusted U-3 fell from 3.5% to 3.4%
  • Unadjusted U-3 ROSE from 3.3% to 3.9%
  • Unadjusted U-6 ROSE from 6.4% to 7.4%


According to the Commissioner of the U.S. Bureau of Labor Statistics:

“Total nonfarm payroll employment rose by 517,000 in January, and the unemployment rate changed little at 3.4 percent, the U.S. Bureau of Labor Statistics reported today. Job growth was widespread, led by gains in leisure and hospitality, professional and business services, and health care. Employment also increased in government, partially reflecting the return of workers from a strike.”

In addition, the BLS posted the following note:
 “Establishment survey data have been revised as a result of the annual benchmarking process, the NAICS 2022 conversion, and the updating of seasonal adjustment factors.| Also, household survey data for January 2023 reflect updated population estimates.”

You can read the full BLS report here.

As usual, they are talking about “Seasonally Adjusted Jobs”.

Looking at the Unadjusted Establishment Survey report, we see…
Originally the BLS reported employment of 154.771 million for December, which they adjusted up to 155.349 million. So, 578,000 additional jobs appeared for December.
I don’t know if it’s just me but, an additional half million jobs seems a bit exceptional, but perhaps in government work it’s just a rounding error.

The current estimate for January is 152.844 million which is down 1.9 million from the original number and down 2.5 million from the revised numbers. But after Seasonally Adjustment they report a half million increase! Typically, employment does fall off in January so some seasonal adjustment is justified but the half million increase in December seems a bit excessive.
We will see what happens next month.

ADP® National Employment Report

According to ADP In collaboration with Stanford Digital Economy Lab employment was up from December but by about 1/5th as much as the BLS reported. But if employment is up, why is the UNADJUSTED U3 and U6 down drastically? Could it be the extra 1.1 million people the BLS added to the Civilian population? December Civilian Population 264.844 million. January Civilian Population 265.962 million.

ADP: Private employers added 106,000 jobs in January

  • Employment was soft during our Jan. 12 reference week as the U.S. was hit with extreme weather. California was coping with record floods and back-to-back storms delivered ice and snow to the central and eastern U.S.

Nela Richardson January 2023ADP also lists increases by “firm size”.

Last month small and medium-sized companies were hiring while large corporations are downsizing. This month it was almost the opposite.

December Changes:

ADP Change by Establishment Size

January Changes:

Change by Est Size for January 2023

January 2023 Employment by Sector

The employment “bubble chart” is a quick and easy way to see how each sector performs on a seasonally adjusted basis. The Bubble’s Size tells us the total Employment for that industry (i.e., larger bubbles mean more people are employed in that sector).

The bubble’s location on the chart tells us that there has been a change in Employment Levels over the most recent month… A bubble further to the right indicates larger job growth. A bubble’s vertical location on the chart shows the average industry salary.

Average Weekly Wages Rose in January

Date Average Weekly Wage
January 2023 $1,146.14
December 2022 $1,125.73
November 2022 $1,129.01
October 2022 $1,124.01
September 2022 $1,119.87
August 2022 $1116.42
July 2022 $1,116.54
June 2022 $1,106.76
May 2022 $1,105.47
April 2022 $1,102.01
December 2021 $1,086.46

[Read more…] about January Employment / Unemployment Report

Filed Under: BLS Tagged With: BLS, employment, unemployment

December 2022- Employment and Unemployment by State

January 24, 2023 by Tim McMahon

The Bureau of Labor Statistics released its employment report (broken down by state) for the month of December 2022.

The lowest jobless rate was in Utah at 2.2 percent. North and South Dakota had the next lowest rates at 2.3 percent each. Alaska at 4.3%, and Pennsylvania at 3.9% set record lows since the BLS began recording (by state) in 1976. Nevada had the highest unemployment rate, 5.2 percent. 14 states had unemployment rates lower than the U.S. average of 3.5 percent. Washington D.C. and 11 states had rates higher than average, and 25 states had rates that were not appreciably different from that of the nation.

In December, seven states had over-the-month unemployment rate increases, the largest of which was in Nevada (+0.3 percentage point). Five states had over-the-month decreases, the largest of which was in Maryland (-0.3 percentage point). Thirty-eight states and the District of Columbia had jobless rates that were not notably different from those of a month earlier, though some had changes that were at least as large numerically as the significant changes.

unemployment by State Dec 2022
[Read more…] about December 2022- Employment and Unemployment by State

Filed Under: BLS Tagged With: 2023, December, unemployment, Unemployment December 2023

December 2022 Employment Report

January 7, 2023 by Tim McMahon

Is Employment Up or Down?


  • Unadjusted Employment fell from 155.015 million to 154.771
  • Labor Force Participation rose from 62.2% to 62.3%
  • Adjusted U-3 fell from 3.6% to 3.5%
  • Unadjusted U-3 fell from 3.4% to 3.3%
  • Unadjusted U-6 was unchanged at 6.4%


The U.S. Bureau of Labor Statistics (BLS) released its employment / unemployment report for December on January 6th2023.

According to the Commissioner of the U.S. Bureau of Labor Statistics:

“Total nonfarm payroll employment increased by 223,000 in December, and the unemployment rate edged down to 3.5 percent, the U.S. Bureau of Labor Statistics reported today. Notable job gains occurred in leisure and hospitality, health care, construction, and social assistance… The unemployment rate edged down to 3.5 percent in December and has remained in a narrow range of 3.5 percent to 3.7 percent since March.”

In addition, the BLS posted the following note:
“Seasonally adjusted household survey data have been revised using updated seasonal adjustment factors…”
They will also be making further annual adjustments next month.

You can read the full BLS report here.

As usual, they are talking about “Seasonally Adjusted Jobs”  rather than looking at the unadjusted results.

Looking at the unadjusted Current Employment Statistics program (formerly called the Establishment Survey report), we see…
Originally, the BLS reported employment of 154.990 million for November, which they adjusted up to 155.015 million. So, 25,000 additional jobs appeared for November.

The current estimate for December is 154.771 million, which is down 219,000 from the original November number and down 244,000 from the revised numbers.

According to the BLS’ unadjusted Current Population Survey (CPS), the labor force was 164.224 million in December. Of those, 158.872 million were employed, and 5.352 million were unemployed. November CPS employment was 158.749 million, so according to the Current Population Survey, employment increased.

So one set of numbers shows an increase in employment while the other shows a decrease. ADP says mostly up.

ADP® National Employment Report

According to ADP, In collaboration with Stanford Digital Economy Lab, employment was up from November to December.

Private employers added 235,000 jobs in December

  • Job resurgence was seen in the last two months of 2022, led by consumer-facing service industries. Hiring was strong across small and medium establishments, while large establishments saw a drop in employment of 151,000 jobs.

ADP Comment December 2022ADP also lists increases by “firm size”.

As we can see, small and medium-sized companies are still hiring, while large corporations are downsizing.

ADP Change by Establishment Size


December 2022 Employment by Sector

The employment “bubble chart” is a quick and easy way to see how each sector performs on a seasonally adjusted basis. The Bubble’s Size tells us the total Employment for that industry (i.e., larger bubbles mean more people are employed in that sector).

The bubble’s location on the chart tells us that there has been a change in Employment Levels over the most recent month… A bubble further to the right indicates larger job growth. A bubble’s vertical location on the chart shows the average industry salary.

In November, Leisure and Hospitality, Education, Construction, Manufacturing, and “Other” were the big gainers, while Retail was the big loser.

Average Weekly Wages Fell in December

$1,125.73 in December, $1,129.01 in November, $1,124.01 in October , $1,119.87 in September, $1116.42 in August, $1,116.54 in July, $1,106.76, in June, $1,105.47 in May and $1,102.01 in April, and $1,086.46 in December 2021. [Read more…] about December 2022 Employment Report

Filed Under: BLS Tagged With: BLS, December 2022, employment, unemployment

November Jobs Report

December 2, 2022 by Tim McMahon

Employment Up – Unemployment Unchanged

Current U-3 Unemployment Rate


  • Unadjusted Employment rose from 154.416 million to 154.990
  • Labor Force Participation is Down from 62.2% to 62.1%
  • Adjusted U-3 was unchanged at 3.7%
  • Unadjusted U-3 was unchanged at 3.4%
  • Unadjusted U-6 was Up from 6.3% to 6.4%


The U.S. Bureau of Labor Statistics (BLS) released its employment / unemployment report for November on December 2nd.

According to the Commissioner of the U.S. Bureau of Labor Statistics:

“Nonfarm payroll employment rose by 263,000 in November, and the unemployment rate was unchanged at 3.7 percent. Notable job gains occurred in leisure and hospitality, health care, and government. Employment declined in retail trade and in
transportation and warehousing. The November gain in nonfarm payroll employment was roughly in line with average growth over the prior 3 months (+282,000). Monthly job growth thus far in 2022 has averaged 392,000, compared with 562,000 per month in 2021.”

You can read the full BLS report here.

As usual, they are talking about “Seasonally Adjusted Jobs” from the “Household Survey” rather than looking at the results reported by actual companies in the BLS “Establishment Survey”.

Looking at the Establishment Survey report, we see…
Originally the BLS reported employment of 154.369 million for October, which they adjusted up to 154.416 million. So, 47,000 additional jobs appeared for October.

November gained an additional 574,000 jobs bringing the total up to 154.990 million.

ADP® National Employment Report

According to ADP, in collaboration with Stanford Digital Economy Lab

Private employers added 127,000 jobs in November

  • Job creation slowed by the most since January 2021, led by construction and other interest rate-sensitive sectors. Consumer-facing segments – including health care and hospitality – were bright spots.

ADP Economist


ADP also lists increases by “firm size”.

Last month (October) ADP posted these changes…

For November, the numbers definitely look worse, with virtually all the gains in mid-sized companies. People are becoming more risk-averse, so fewer small companies are being started. At some point, when jobs are scarce, starting your own business becomes the only option, so small company creation increases again. :

ADP Change by Establishment Size


November 2022 Employment by Sector

The employment “bubble chart” is a quick and easy way to see how each sector performs on a seasonally adjusted basis. The Bubble’s Size tells us the total Employment for that industry (i.e., larger bubbles mean more people are employed in that sector).

The bubble’s location on the chart tells us that there has been a change in Employment Levels over the most recent month… A bubble further to the right indicates larger job growth. A bubble’s vertical location on the chart shows the average industry salary.

In November, Leisure and Hospitality, Education, Construction, Manufacturing, and “Other” were the big gainers, while Retail was the big loser.

Average Weekly Wages Rose

$1,129.01 in November, $1,124.01 in October , $1,119.87 in September, $1116.42 in August, $1,116.54 in July, $1,106.76, in June, $1,105.47 in May and $1,102.01 in April, and $1,086.46 in December 2021. Surprisingly, Retail was the big loser, which is unusual for this time of year.  [Read more…] about November Jobs Report

Filed Under: BLS Tagged With: 2022, BLS, employment, jobs, November, unemployment

October 2022 BLS Employment Report

November 5, 2022 by Tim McMahon

Adj U3 Icon 3-7 up

Employment Up – Unemployment Also Up?

  • Unadjusted Employment rose from 153.197 million to 154.369
  • Labor Force Participation is Down from 62.3% to 62.2%
  • Adjusted U-3 was Up from 3.5% to 3.7%
  • Unadjusted U-3 was Up from 3.3% to 3.4%
  • Unadjusted U-6 was Down from 6.4% to 6.3%


The U.S. Bureau of Labor Statistics (BLS) released its employment / unemployment report for October on November 4th.

According to the Commissioner of the U.S. Bureau of Labor Statistics:

“Nonfarm payroll employment increased by 261,000 in October, and the unemployment rate rose to 3.7 percent. Notable job gains occurred in health care, professional and technical services, and manufacturing. Monthly job growth has averaged 407,000 thus
far in 2022, compared with 562,000 per month in 2021.”

You can read the full BLS report here.

As usual, they are talking about “Seasonally Adjusted Jobs” from the “Household Survey” rather than looking at the results reported by actual companies in the BLS “Establishment Survey”.

Looking at the Establishment Survey report, we see…
Originally the BLS reported employment of 153.073 million for September, which they adjusted up to 153.197 million. So, 124,000 additional jobs appeared for September.

October gained an additional 1,272,000 jobs bringing the total up to 154.369 million.

Initially, the market shot up under the news but as the day progressed the market lost most of its gains. 

See November FED Announcement Rocks Stock Market for more market info.

ADP® National Employment Report

According to ADP In collaboration with Stanford Digital Economy Lab

Private employers added 239,000 jobs in October

  • Employers created 239,000 jobs in October, up from a revised 192,000 in September as restaurants, retailers and the travel sector ramped up hiring in advance of the year-end holidays.

ADP 11-2022


ADP also lists increases by “firm size”.

At some point, it may look like small-size firms (i.e. 1-19 employees) are increasing, while everything else is decreasing, but that could simply be the result of people starting companies because they can’t find any other jobs (although this isn’t currently the case). Last month, there were increases across the board. This month’s results were mixed.


Unemployment

Looking at the chart for unemployment, we see that despite the increase in the number of people employed unemployment still ticked upward slightly.

Seasonally Adj U-3 Unemployment Rate 11-22

Employment –Establishment Survey

Looking at the chart for employment, we see that current employment (154.369 million) is now above the 2019 peak (153.095 million) although the civilian population is 5 million higher now.

Current Employment 11-4-22


See Current Employment for more info.

[Read more…] about October 2022 BLS Employment Report

Filed Under: BLS Tagged With: BLS, employment, October 2022, unemployment

August: Employment and Labor Force Participation Up

September 3, 2022 by Tim McMahon

The U.S. Bureau of Labor Statistics (BLS) released its employment / unemployment report for August on September 2nd.


Adj U3 Icon 3-7 up


  • Unadjusted Employment rose from 152.263 million to 152.572
  • Labor Force Participation Up from 62.1% to 62.4%
  • Adjusted U-3 was Up from 3.5% to 3.7%
  • Unadjusted U-3 was Unchanged at 3.8%
  • Unadjusted U-6 was Down from 7.2% to 7.0%


Looking Back:

In June, we reported a few Early Indicators of a brewing recession.

  • Labor Force Participation Down from 62.3% to 62.2%
  • Upturn in Uneducated Unemployment
  • Rising Unemployment among the newly unemployed
  • Average Weekly Hours among manufacturing workers falling

Since then, the BLS has changed the employment numbers for June from an initial 152.692 million for June. They adjusted down to 152.634 million in July and then down to 152.607 in August. So, a total of 85,000 jobs disappeared for June.

July’s Indicators

Originally they reported employment of  152.249 million jobs for July. They have adjusted that to 152.263 million , which is an increase of 14,000 jobs. For August, they are currently reporting 152.572 million,  an increase of 323,000 based on their original estimates or an increase of 309,000 based on their updated numbers.

But… August employment is still below June’s employment no matter which number for June they use.

On the Bright Side

Labor Force Participation is Up to 62.4% where it peaked in March.

Labor Force Participation Rate

In the News:

Trying to put a good spin on rising unemployment US. News says:

Lower US Job Gain in August Could Aid Fed’s Inflation Fight

The NY Times is beating the same drum:

Job Market Cooled but Was Still Strong in August

The monthly employment report suggested that the Federal Reserve might be able to tame inflation without causing a recession.

CNN follows along:

Yes, the unemployment rate rose. Here’s why that’s good news

CNBC focuses on race instead:
While all demographic groups saw the unemployment rate tick up slightly, it rose at a sharper pace for both Hispanic and Black workers to 4.5% and 6.4%, respectively.

ADP National Employment Report

In addition to the BLS, we can look at the Jobs Report generated by private companies like ADP Research Institute. According to their numbers, August employment was up 132,000 not the 300,000+ that the BLS reports.

  • Private employers created 132,000 jobs in August, a step down from the month before, when the economy created nearly 270,000 jobs. Payroll growth also slowed in July when compared to June of this year.

About the ADP Report:

The ADP National Employment Report is an independent estimate of the change in U.S. private sector employment and pay derived from actual, anonymous payroll data of client companies served by ADP, a leading provider of human capital management solutions. The report is produced by ADP Research Institute in collaboration with the Stanford Digital Economy Lab. The ADP National Employment Report is broadly distributed to the public each month, free of charge, as part of the company’s commitment to offering deeper insights of the U.S. labor market and providing businesses and governments with a source of credible and valuable information.

Current Employment

Current Employment Chart


According to the Commissioner of the U.S. Bureau of Labor Statistics:

“Nonfarm payroll employment increased by 315,000 in August, and the unemployment rate rose to 3.7 percent. Notable job gains occurred in professional and business services, health care, and retail trade. Total nonfarm employment increased by 5.8 million over the year, as the labor market continued to recover from the job losses of the pandemic-induced recession. This growth brings total nonfarm employment 240,000 above its February 2020 level before the onset of the coronavirus (COVID-19) pandemic.”

You can read the full BLS report here.

As usual, they are talking about “Seasonally Adjusted Jobs” from the “Household Survey” rather than looking at the results reported by actual companies in the BLS “Establishment Survey”.

Employment is approaching the 2019 peak, although the population is now several million higher.

Historical Employment with Recessions

Historical Employment Chart

[Read more…] about August: Employment and Labor Force Participation Up

Filed Under: BLS Tagged With: ADP, August 2022, BLS, employment, Labor Statistics, unemployment

July 2022 Jobs Report- Not as Rosy as They’d Have You Believe

August 6, 2022 by Tim McMahon

Typically July Jobs Reports aren’t that great anyway so “Seasonal Adjustments” correct for that but let’s dig a bit deeper today.

Current Seasonally Adjusted Unemployment


  • Adjusted U-3 was Down from 3.6% in June to 3.5% in July.
  • Unadjusted U-3 was Unchanged at 3.8% for June and July after being 3.4% in May.
  • Unadjusted U-6 went from 6.7% in May to 7.0% in June to 7.2% in July.
  • Unadjusted Employment FELL from 152.634 million to 152.249 million.
  • Average Weekly Wages Still Rising 

Looking Back:

Last month (for June) we reported the following “Early Indicators of a possible recession”

  • Labor Force Participation Down from 62.3% to 62.2%
  • Upturn in Uneducated Unemployment
  • Rising Unemployment among the newly unemployed
  • Average Weekly Hours among manufacturing workers falling

July’s Indicators

According to CNBC:

“Hiring in July was far better than expected, defying multiple other signs that the economic recovery is losing steam, the Bureau of Labor Statistics reported Friday.”

One of those “other signs” is the two consecutive quarters of falling GDP. This is definitely a sign of a slowing economy, but we have typically followed the National Bureau of Economic Research, i.e. NBER’s guidance of when a recession starts. Because that includes a variety of other factors (including unemployment) giving a fuller picture of the total economy, not just GDP. But NBER typically takes a while before they declare that a recession began months ago.

But… one reason the Employment situation is as good as it is, is because of the massive injection of FED funny money over the last two years which artificially boosted the economy.

According to CNN:

“The US economy has now regained all jobs lost during the pandemic, after a blowout July jobs report that showed a gain of 528,000 jobs, according to data released Friday by the Bureau of Labor Statistics. The massive monthly gain was more than double the 250,000 that economists were expecting, according to Refinitiv.”

According to the Commissioner of the U.S. Bureau of Labor Statistics:

“Nonfarm payroll employment increased by 528,000 in July, and the unemployment rate edged down to 3.5 percent. Job growth was widespread, led by gains in leisure and hospitality, professional and business services, and health care. In July, both total nonfarm employment and the unemployment rate returned to their February 2020 pre-pandemic levels. Private-sector employment is 629,000 higher than in February 2020, although several sectors have yet to recover. Government employment is 597,000 lower than its pre-pandemic level.”

You can read the full BLS report here.

As usual, they are talking about “Seasonally Adjusted Jobs” from the “Household Survey” rather than looking at the results reported by actual companies in the BLS “Establishment Survey”.

But looking at the Establishment Survey report we see…
Originally the BLS reported employment of 152.692 million for June which they adjusted this month down to 152.634 million. So, 58,000 jobs disappeared for June. So even if they just reported the same number as they originally did in June we would have a 58,000 job increase!

Now they are reporting 152.249 million jobs for July which is actually a decrease of 443,000 jobs based on their original estimates or a decrease of 385,000 based on their updated numbers. So employment is actually down, unadjusted U6 is UP, Unadjusted U3 is UP, and LFPR is Down, but somehow this is presented as a rosy report. 

The other factor in their rosy outlook is that employment is now back to pre-covid levels. But when we look at the Establishment Survey numbers we see that February 2020 (pre-covid) at 150.968 million is actually below the November 2019 peak of 153.095 million. So the current 152.249 million is still below the 2019 peak, and that doesn’t even count the roughly 4 million increase in documented population plus the untold millions of new “undocumented” residents.

Current Employment Chart

Historical Employment with Recessions

Historical Employment


[Read more…] about July 2022 Jobs Report- Not as Rosy as They’d Have You Believe

Filed Under: BLS Tagged With: employment, July 2022, unemployment

June 2022 BLS Jobs Report- Recession Indicators?

July 9, 2022 by Tim McMahon

Adj U3 Icon 3-6 flat

Early Indicators of possible recession appeared in the June jobs report, but you have to look closely to find them in reports by the mainstream media.

  • Adjusted U-3 was Unchanged at 3.6%
  • Unadjusted U-3 was Up from 3.4% to 3.8%
  • Unadjusted U-6 was Up from 6.7% to 7.0%
  • Unadjusted Employment rose from 150.964 to 151.773 million
  • Average Weekly Wages Still Rising 


Early Warning Negative Indicators

Early Indicators of a possible recession

  • Labor Force Participation Down from 62.3% to 62.2%
  • Upturn in Uneducated Unemployment
  • Rising Unemployment among the newly unemployed
  • Average Weekly Hours among manufacturing workers falling


According to the Commissioner of the U.S. Bureau of Labor Statistics:

“Total nonfarm payroll employment rose by 372,000 in June, and the unemployment rate remained at 3.6 percent, the U.S. Bureau of Labor Statistics reported today.
Notable job gains occurred in professional and business services, leisure and hospitality, and health care.

The unemployment rate was 3.6 percent for the fourth month in a row, and the number of unemployed persons was essentially unchanged at 5.9 million in June. These measures are little different from their values in February 2020 (3.5 percent and 5.7 million, respectively), prior to the coronavirus (COVID19) pandemic.”

You can read the full BLS report here.

As usual, they are talking about “Seasonally Adjusted Jobs” from the “Household Survey” rather than looking at the results reported by actual companies in the BLS “Establishment Survey.”

But looking at the Establishment Survey report, we see…
Initially, the BLS reported employment of 151.773 million for May, which they adjusted to 151.748 million. So 25,000 jobs disappeared in May. They are reporting 152.692 million jobs for June, which is an increase of 919,000 based on their original estimates or an increase of 944,000 based on their updated numbers. 

According to CNN:

The latest Job Openings and Labor Turnover Survey, released on Wednesday, showed there were 11.3 million job openings in May, or 1.9 positions for every job seeker, and historically low levels of layoffs… But, the BLS reported that initial jobless claims for the week ending July 2 totaled 235,000, an increase of 4,000 from the prior week’s reading and the highest level since mid-January…  New job cuts data released Thursday by Challenger, Gray & Christmas revealed that US employers announced 32,517 layoffs in June, a 58.8% increase from the same month last year, and the highest monthly total since February 2021. 

According to the Washington Post:

The strong job growth keeps pressure on the Fed to continue raising interest rates when it meets later this month. After years of keeping interest rates at or near zero, the central bank has so far hiked rates three times this year, by a total of 1.5 percentage points, in the hope of slowing the economy just enough to curb inflation, which is at 40-year highs, without pushing it into a deep recession.

Recession Ahead?

The Federal Reserve Bank of Atlanta estimated that the economy shrank by 1.2 percent in the second quarter, which would put the U.S. in a recession by one common definition i.e. two consecutive quarters of economic contraction. But the National Bureau of Economic Research, the nonprofit organization that is the official arbiter of recessions, also includes unemployment in their calculations, so according to their definition, there is no recession yet.

Employment is almost back to 2019 peak levels (although the civilian population is about 4 million higher now).

Historical Employment Chart


[Read more…] about June 2022 BLS Jobs Report- Recession Indicators?

Filed Under: BLS Tagged With: BLS, June 2022, unemployment

May 2022- Unemployment by State

June 18, 2022 by Tim McMahon

On Friday, June 17th, 2022, The U.S. Bureau of Labor Statistics (BLS) released its breakdown of the unemployment rates for each individual state for May.

In the chart below, the lightest colors represent the states with the lowest unemployment rates.

Unemployment By State May 2022Looking at the above map, we can see that the lowest unemployment states run diagonally across the country, starting in Florida and ending in Montana and Idaho. Conversely, the states with the highest unemployment are located in the North East, the South West, and West Coast.  Of course, minor exceptions exist, but generally, it holds.

May 2022 Unemployment Rate by State Table (Alphabetical)

State May 2022 Unemployment Rate May 2021 Unemployment Rate 12-month change
Alabama 2.7% 3.6% -0.9%
Alaska 4.7% 6.8% -2.1%
Arizona 3.2% 5.4% -2.2%
Arkansas 3.2% 4.4% -1.2%
California 4.3% 7.9% -3.6%
Colorado 3.5% 5.8% -2.3%
Connecticut 4.2% 6.7% -2.5%
Delaware 4.5% 5.7% -1.2%
District of Columbia 5.7% 6.9% -1.2%
Florida 3.0% 4.9% -1.9%
Georgia 3.0% 4.1% -1.1%
Hawaii 4.2% 5.9% -1.7%
Idaho 2.5% 3.7% -1.2%
Illinois 4.6% 6.5% -1.9%
Indiana 2.2% 4.0% -1.8%
Iowa 2.7% 4.5% -1.8%
Kansas 2.3% 3.4% -1.1%
Kentucky 3.8% 4.7% -0.9%
Louisiana 4.0% 5.9% -1.9%
Maine 3.2% 4.9% -1.7%
Maryland 4.0% 5.7% -1.7%
Massachusetts 3.9% 5.9% -2.0%
Michigan 4.3% 6.2% -1.9%
Minnesota 2.0% 3.4% -1.4%
Mississippi 4.0% 6.0% -2.0%
Missouri 3.1% 4.5% -1.4%
Montana 2.4% 3.6% -1.2%
Nebraska 1.9% 2.5% -0.6%
Nevada 4.9% 7.8% -2.9%
New Hampshire 2.1% 3.7% -1.6%
New Jersey 3.9% 6.6% -2.7%
New Mexico 5.1% 7.2% -2.1%
New York 4.4% 7.4% -3.0%
North Carolina 3.4% 5.0% -1.6%
North Dakota 2.6% 3.8% -1.2%
Ohio 3.9% 5.4% -1.5%
Oklahoma 2.8% 4.4% -1.6%
Oregon 3.6% 5.6% -2.0%
Pennsylvania 4.6% 6.7% -2.1%
Rhode Island 2.9% 6.0% -3.1%
South Carolina 3.3% 4.1% -0.8%
South Dakota 2.3% 3.2% -0.9%
Tennessee 3.3% 4.6% -1.3%
Texas 4.2% 5.9% -1.7%
Utah 2.0% 2.8% -0.8%
Vermont 2.3% 3.6% -1.3%
Virginia 3.0% 4.1% -1.1%
Washington 3.9% 5.5% -1.6%
West Virginia 3.5% 5.4% -1.9%
Wisconsin 2.9% 4.1% -1.2%
Wyoming 3.2% 4.7% -1.5%
Puerto Rico 6.2% 8.1% -1.9%

States with the Highest Unemployment Rates

The record for the highest unemployment goes as usual to the two that are not really “states,” i.e., Puerto Rico and D.C. at 6.2% and 5.7%, respectively. Next comes New Mexico at 5.1%, Nevada at 4.9%, Alaska at 4.7%, Illinois and Pennsylvania at 4.6%, Delaware at 4.5%, New York at 4.4%, and California and Michigan tied for 10th worst place at 4.3%. [Read more…] about May 2022- Unemployment by State

Filed Under: Unemployment Tagged With: 2022, BLS, May, State, unemployment

  • « Go to Previous Page
  • Page 1
  • Page 2
  • Page 3
  • Page 4
  • Page 5
  • Interim pages omitted …
  • Page 15
  • Go to Next Page »

Primary Sidebar

Rate Any Stock In Seconds

Get a detailed stock report showing its true value, safety score, and ideal timing to buy. Plus, receive a color coded Buy, Sell, or Hold recommendation.

Get Your Free Stock Analysis Here.

Recent Posts

  • February Employment Report for January 2026
  • Unemployment Report for December 2025
  • Unemployment Report for Nov. 2025
  • Delayed September 2025 Unemployment Report Released
  • No BLS Employment Data for October 2025 But ADP Says 42K New Jobs

Search Site

Resources

  • Bureau of Labor Statistics Current Population Survey Monthly survey of households conducted by the Bureau of Census for BLS. It provides data on the labor force, employment, unemployment, etc.
  • Capital Professional Services Providing web design and development and Internet marketing services
  • Elliott Wave University Using the Elliott Wave Principle to improve investment performance
  • Financial Trend Forecaster Featuring Moore Inflation Predictor, NYSE Rate of Change and NASDAQ Rate of change
  • InflationData.com Inflation calculators, databases, etc.
  • Intergalactic Web Designers Web design and development services

Articles by Category

Articles by Date

Disclaimer

At UnemploymentData.com we are not registered investment advisors and do not provide any individualized advice. Past performance is not necessarily indicative of future performance and future accuracy and profitable results cannot be guaranteed.

Privacy & Terms of Use

Privacy Statement & Terms of Use

Do Not Sell My Information

Copyright © 2026 · News Pro on Capital Professional Services, LLC. All rights reserved · Log in