The U.S. Bureau of Labor Statistics (BLS) released its employment / unemployment report for July on August 2nd, 2024.
Employment / Unemployment
![]()
- Seasonally Adjusted U3- 4.3% up from 4.1% in June
- Unadjusted U3- 4.5% up from 4.3% in June
- Unadjusted U6- 8.2% up from 7.7% in June
- Labor Force Participation Rate 62.7% up from 62.6%
- Employment 158.445 million down from 159.360 million
- Next data release September 6th, 2024
Summary:
Total Employed decreased in July, adjusted and Unadjusted Unemployment was up.
According to the Commissioner of the U.S. Bureau of Labor Statistics:
“The unemployment rate rose to 4.3 percent in July, and nonfarm payroll employment edged up by 114,000, the U.S. Bureau of Labor Statistics reported today. Employment continued to trend up in health care, in construction, and in transportation and warehousing, while information lost jobs.”
You can read the full BLS report here.
As usual, they are talking about “Seasonally Adjusted Jobs”.
Looking at the Unadjusted Establishment Survey report we see…
Originally the BLS reported employment of 159.392 million for June
which they then adjusted to 159.360 million in August.
They are currently reporting 158.445 million jobs for July which is actually a decrease of 947,000 jobs based on their original numbers. The LFPR was up at 62.7% but the Employment/Population Ratio was down from 60.1% to 60.0%.
Bad News for the Market?
On Wednesday (prior to the Jobs data release on Friday) the stock market reacted bullishly to FED Chairman Powell’s dovish speech with anticipation of a September rate cut. But then markets reversed course on Thursday on preliminary Employment numbers. But what they failed to recognize is that the worst months (highest unemployment) are usually January, June, and July. So a bad July doesn’t really signify much.
Adding to the market’s woes, Intel dropped a bombshell with its earnings report. The company announced plans to slash jobs and suspend dividends after missing earnings targets and delivering a disappointing sales forecast. Intel shares cratered over 25% in early trading, dragging other chip stocks down with it.
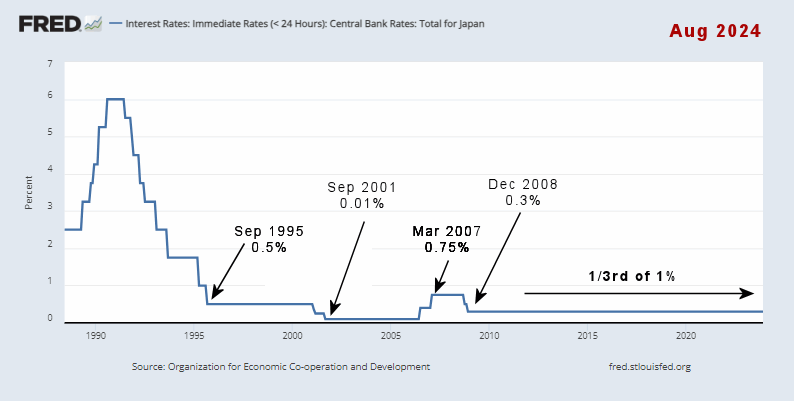
In other news, Israel is suspected of killing a Hamas leader inside Iran. So now the market also fears retaliation by Iran causing a war in the Middle East. In addition to these political problems, Japan is creating financial problems for the U.S. by raising interest rates while other countries are lowering them. As you can see from the chart below, Japan has had zero or near-zero interest rates for almost 30 years. For a brief stretch, their rates got all the way up to 3/4 of 1%! (Horror of Horrors). But since 2008 they have been below 1/3rd of 1%.
This has created what is called the “Carry Trade” where people could borrow Yen almost interest-free and invest that money in higher-yielding things like Nvidia or other NASDAQ stocks or even lower-risk things like U.S. Treasury Bills. However, with the Bank of Japan (BOJ) raising rates, the free money is drying up, which creates selling pressure on the NASDAQ.
The NYSE was down -1.79% on Friday after being down -1.16% on Thursday.
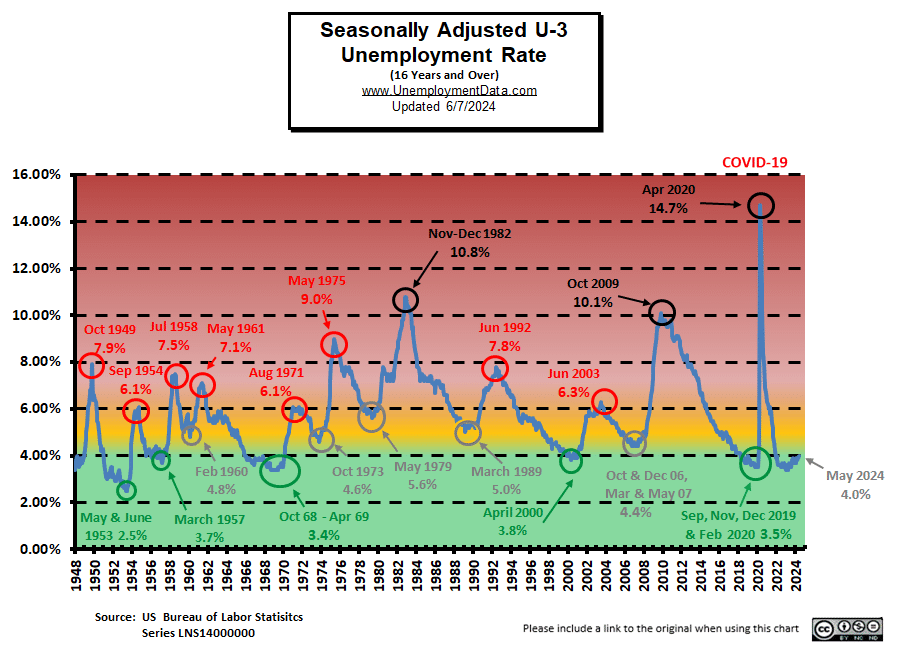
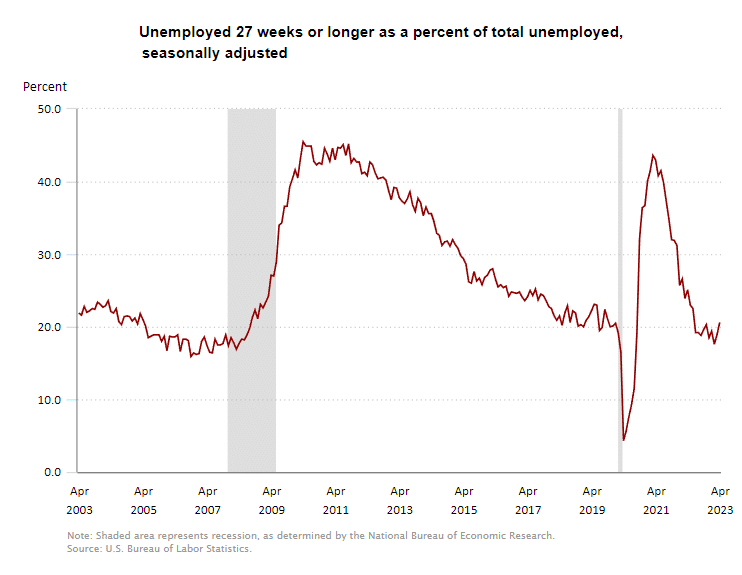
Current Unemployment Rate Chart
Seasonally Adjusted U3 Unemployment remains above the pre-COVID 2019 cyclical lows of 3.5%, but is approaching the yellow zone.