The U.S. Bureau of Labor Statistics (BLS) released its employment / unemployment report
for December on January 9th, 2026.
Employment / Unemployment
![]()
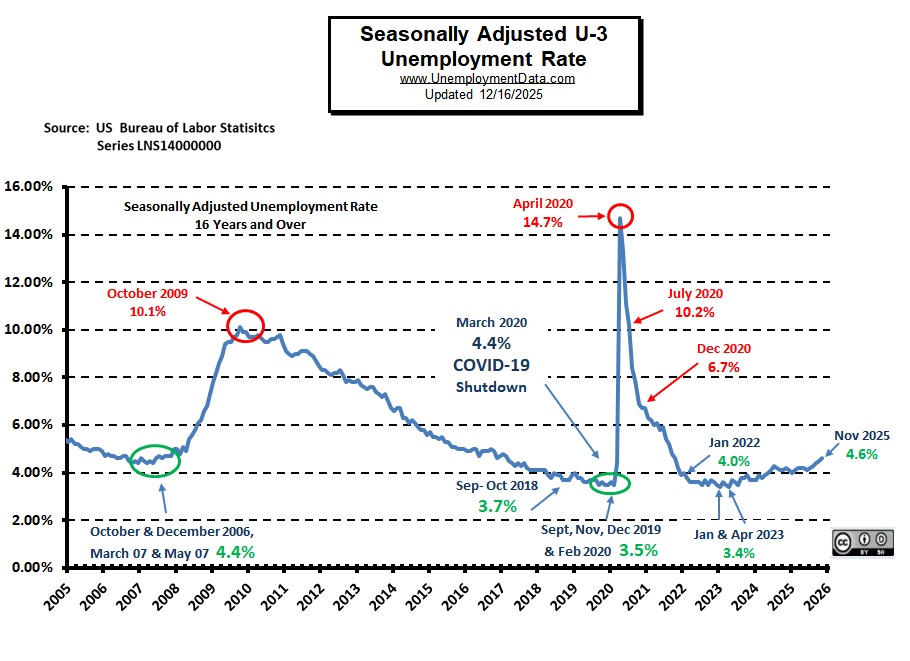
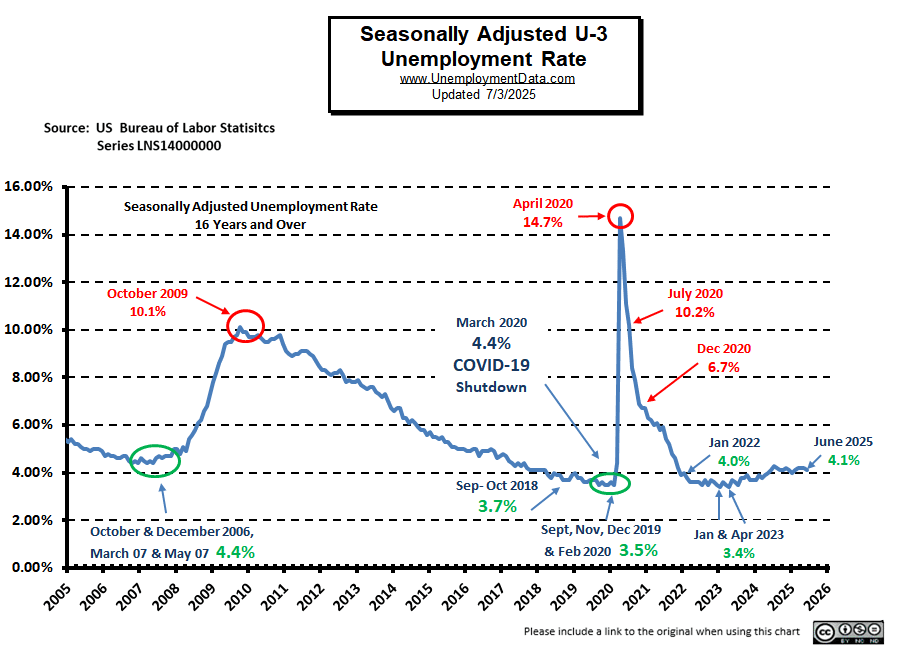
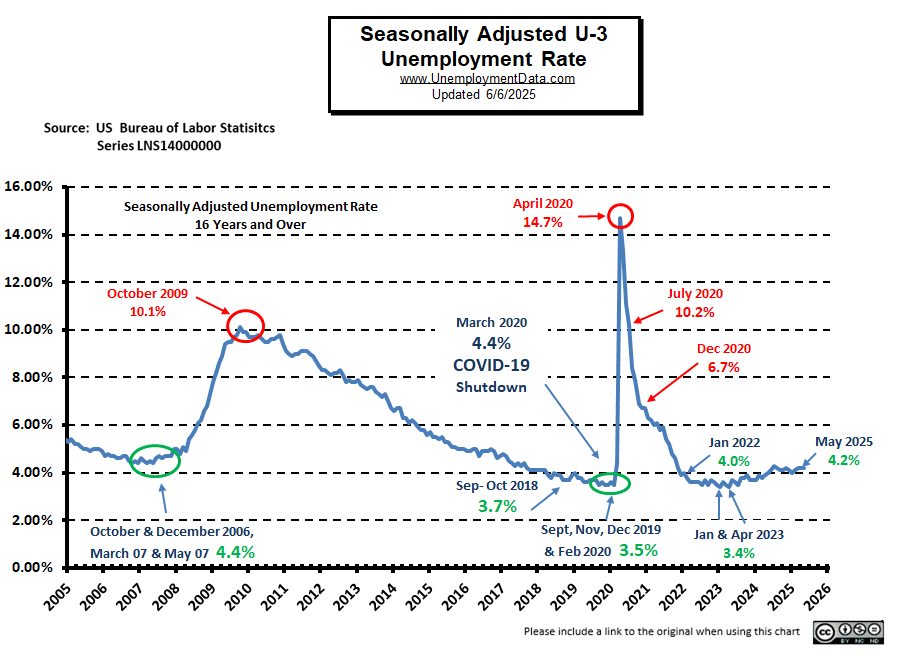
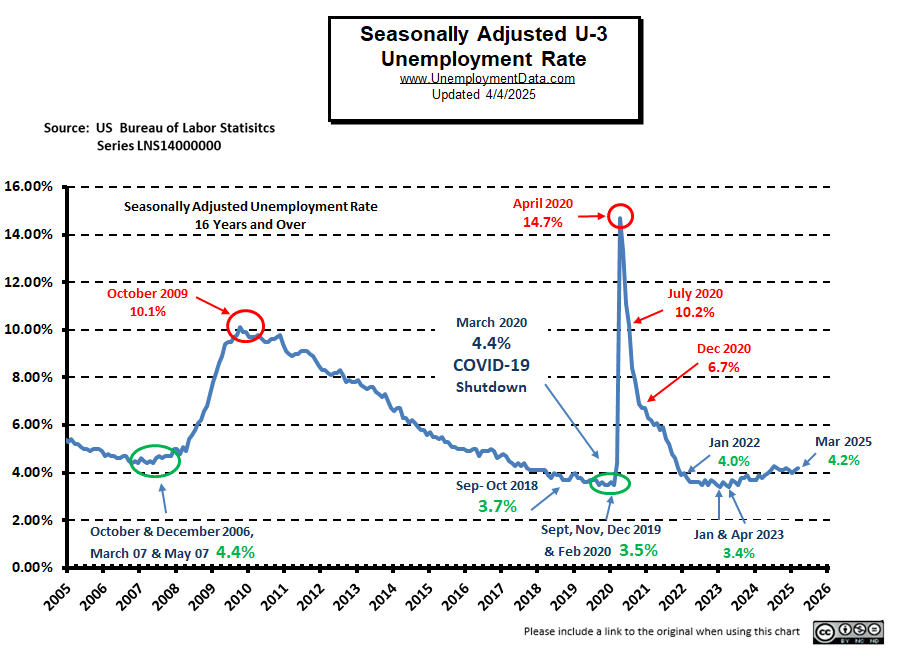
- Seasonally Adjusted U3- 4.4% in December
- Unadjusted U3- 4.1% down from 4.3% in November
- Unadjusted U6- 8.2% down from 8.4% in November
- Labor Force Participation Rate- 62.4%
- Employment- 160.448 million in December
- Employment- 160.640 million in November
- Next data release February 6, 2026
Summary:
Despite Seasonally Adjusted BLS statements, if we look at the Unadjusted Establishment Survey report, Total Employed decreased in December, but Unadjusted and Adjusted Unemployment also decreased. Labor Force Participation was also down slightly.
According to the Commissioner of the U.S. Bureau of Labor Statistics:
“Both total nonfarm payroll employment (+50,000) and the unemployment rate (4.4 percent) changed little in December, the U.S. Bureau of Labor Statistics reported today. Employment continued to trend up in food services and drinking places, health care, and social assistance. Retail trade lost jobs…
Since reaching a peak in January, federal government employment is down by 277,000, or 9.2 percent. (Employees on paid leave or receiving ongoing severance pay are counted as employed in the establishment survey.)… Over the past 12 months, average hourly earnings have increased by 3.8 percent. “
You can read the full BLS report here.
As usual, they are talking about “Seasonally Adjusted Jobs”.
Looking at the Unadjusted Establishment Survey report we see…
Originally, the BLS reported employment of 160.652 million for November,
which they adjusted slightly to 160.640 million jobs for November.
They are currently reporting 160.448 million jobs for December, which is actually a decrease of -204,000 jobs based on their original numbers.
The LFPR was down from 62.5% in November to 62.4% in December. [Read more…] about Unemployment Report for December 2025