• About WordPress
    • WordPress.org
    • Documentation
    • Learn WordPress
    • Support
    • Feedback
  • Log In
  • Skip to primary navigation
  • Skip to main content
  • Skip to primary sidebar
  • Home
  • Contact us
  • Related Sites
    • InflationData.com
    • Financial Trend Forecaster
    • Your Family Finances
    • Elliott Wave University
    • Optio Money
  • About
    • Terms of Use
    • Disclaimer & Disclosure
    • Privacy Statement
  • Sitemap
    • 2009-2010 Posts
    • 2011 Posts

UnemploymentData.com

Your Source for Employment and Unemployment Data

Unemployment
  • Charts
    • Current Unemployment Rate Chart
    • Current Employment Rate (Chart and Data)
    • Current Employment vs Unemployment Chart
    • Historical Employment Data
    • Employment Population Ratio
    • Misery Index
  • Unemployment
    • Historical Unemployment Rate Tables
    • What Is U-6 Unemployment?
    • Unadjusted vs. Seasonally Adjusted U-3 Unemployment Rate
    • BLS vs. Gallup Unemployment Numbers
    • Current U-6 Unemployment Rate
    • What is the Labor Force Participation Rate?
    • What is the Real Unemployment Rate?
  • Employment
    • Current Employment Rate (Chart and Data)
    • Historical Employment Data
    • Contacting a Live Person at the State Employment Commission
      • How to Talk to a Live Person at the Virginia Unemployment Commission
      • Florida’s FLUID Unemployment Program
    • Benefits
      • Insurance
      • Retirement
    • Careers
    • Employment Costs
    • Experience
    • Government
    • Job Hunting
      • Interview
      • Resume
  • Find Articles
  • Education
    • Skills
  • General
    • Small Business
      • Outsourcing
    • Success
You are here: Home / Archives for U-6 Unemployment

U-6 Unemployment

May Unemployment Still Low

June 8, 2019 by Tim McMahon

Adj U3 Icon 3-6 PercentThe U.S. Bureau of Labor Statistics (BLS) released their monthly unemployment survey results for  May on June 7th. Although Unemployment is still at record lows job creation is less than expected.

According to the U.S. Bureau of Labor Statistics:

The U.S. economy created 75,000 jobs in May and the seasonally adjusted unemployment rate held steady at 3.6 percent. However, economists projected a 175,000 jobs gain and instead only got 75,000 so they were disappointed but that didn’t stop the stock market with the DOW gaining over 1% in a single day.

According to the BLS Commissioner’s report for this month:

“ Nonfarm payroll employment edged up in May (+75,000), and the unemployment rate remained at 3.6 percent.
Employment continued to trend up in professional and business services and in health care… 
In May, 4.4 million people were working part time for economic reasons (also referred to as involuntary part-time workers),
down by 299,000 from the previous month and by 565,000 over the year.”

Key factors in the report were:
Employment in professional and business services increased by 33,000…
Health Care employment rose by 16,000…
Construction employment increased by 4,000…
Seasonally Adjusted U-3 Unemployment remains at its lowest rate since December 1969.

Of course the Commissioner is talking about “Seasonally Adjusted” jobs. In unadjusted terms April had 150.942 million jobs and May had 151.629 million for an actual increase of 687,000 jobs.

For more info see our Current Unemployment Chart and Current U.S. Employment Chart commentary:

Key May Employment and Unemployment Numbers

  • Adjusted U-3 Unemployment-   3.6% unchanged from April
  • Unadjusted U-3 Unemployment-  3.4% up from 3.3% in April but down from 3.9% in March and 4.1% in February, and 4.4% in January.
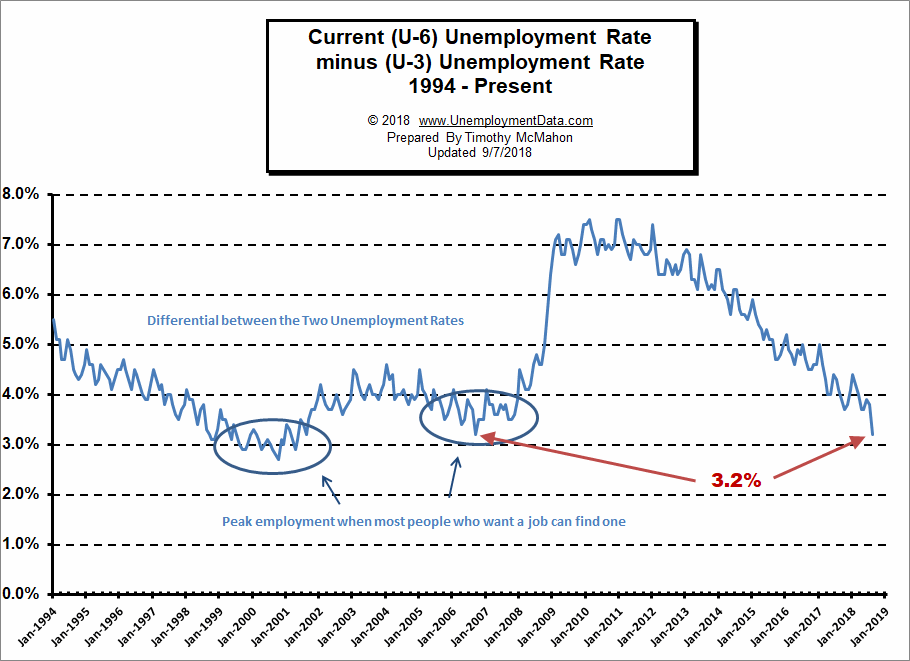
  • Unadjusted U-6 Unemployment-  6.7% down from 6.9% in April and 7.5% in March, 7.7% in February and 8.8% in January.
  • Unadjusted Employment (Establishment Survey)- 151.629 million up from 150.988 million in April, 149.862 million in March, 149.143 million in February and 148.295 million in January.
  • Labor Force Participation Rate- 62.8% unchanged from April.

Current Seasonally Adjusted U-3 levels are below the 3.8% lows of 2000. Prior to that we have to go all the way back to 1969 to see better unemployment levels than we have currently. If we break below 3.4% we have to go all the way back to 1953 to find lower levels and remember that was during the boom that followed WWII with a massive loss of the workforce due to the war so we probably won’t see levels that low again.

[Read more…] about May Unemployment Still Low

Filed Under: BLS Tagged With: BLS, Bubble, Charts, employment, Sector, U-3, U-6, U-6 Unemployment, unemployment

Full Employment is Near – Differential between U3 and U6 reaches September 2006 Lows

September 8, 2018 by Tim McMahon

Adj U3 Icon 3-9 unchangedCorrection: The differential was only 3.5% in August 2018 and 3.2% in September 2006 so we are only nearing the 2006 level not at the 2006 level.

The U.S. Bureau of Labor Statistics (BLS) released their monthly employment survey results for the month of August on September 7th .

The current “Seasonally Adjusted” Unemployment Rate for August (released September 7th) is 3.9% unchanged from last month. 

Looking back, Seasonally Adjusted U-3 started 2017 at 4.8% then it bounced around between 4.3% and 4.4% from April through October 2017, then it was 4.1% from October 2017 through March 2018. It was 3.9% in April, 3.8% in May, 4.0% in June, and 3.9% in July.

Typically Unemployment levels are worse in June and July so seasonally adjusting takes that into consideration.


Unadjusted
U-3

Unadjusted
U-3
2017 2018
May 4.1% 3.6%
June 4.5% 4.2%
July 4.6% 4.1%
August 4.5% 3.9%


Key August Employment and Unemployment Numbers

  • Adjusted U-3 Unemployment-   3.9% unchanged from July, down from 4.0% in June but above the 3.8% in May, it was 3.9% in April but still Below the 4.1% October 2017 – March 2018.
  • Unadjusted U-3 Unemployment-  3.9% down from 4.1% in July and 4.2% in June but still above the 3.6% in May, and 3.7% in April below the 4.1% in March.
  • Unadjusted U-6 Unemployment-   7.4% down from 7.9% in July, 8.1% in June, up slightly from record lows of 7.3% in May, and 7.4% in April. Below the 8.1% in March and 8.6% in February.
  • Employment 149.226 million up from 148.901 million in July.
  • August Labor Force Participation Rate 62.7% down from July LFPR 62.9%  

See Current Unemployment Chart for more info.

Full Employment is Near – Differential between U3 and U6 reaches September 2006 Lows

In August we saw a massive drop in the differential between U-3 and U-6 so perhaps we are getting closer to “full employment”  the lows on this chart are at 2.7% in October 2000 and 3.2% in September 2006. Since the current differential is once again 3.2% we have reached the lows of 2006. Back in January 2017 the media was saying that we were at “Full Employment” and we couldn’t expect anything better, manufacturing jobs would never come back etc. At that time I said we had a long way to go and that the differential between the U-6 and U-3 was nowhere near bottoming (the sign of full employment) at the time the differential was around 5%. See: Is the U.S. Really at “Full Employment”? But with the differential currently at 3.2% now we are at or very near that level. Since October 2000 reached a low of 2.7% we could still  go a bit lower.U6 minus U3 Unemployment

See Current U-6 Unemployment Rate for more info.

Employment by Sector

The employment “bubble chart” gives us a good representation of how each sector of the economy is doing (employment wise). As we can see from the chart below [Read more…] about Full Employment is Near – Differential between U3 and U6 reaches September 2006 Lows

Filed Under: BLS, Sector Tagged With: employment, Employment by Sector, full employment, Labor Force Participation Rate, LFPR, Sector, U-6 Unemployment, unemployment

Primary Sidebar

Search Site

Sponsored:

URGENT: These Stocks Stand Poised to Benefit from President Trump's Trade Wars!

As the Trump administration moves ahead with aggressive tariff policies on key imports, the mainstream media is scrambling.

This Free Report - which you can download now - reveals the names and ticker symbols of 5 Stock Poised to Benefit Most from President Trump's Tariff Wars.

Click Here to Download Your FREE Stock Report Now.

Recent Posts

  • April 2025 Employment / Unemployment Report
  • Would More Jobs Help Social Security?
  • March 2025- Employment / Unemployment Report
  • February 2025 Jobs Report
  • January 2025 BLS Employment Report

Resources

  • Bureau of Labor Statistics Current Population Survey Monthly survey of households conducted by the Bureau of Census for BLS. It provides data on the labor force, employment, unemployment, etc.
  • Capital Professional Services Providing web design and development and Internet marketing services
  • Elliott Wave University Using the Elliott Wave Principle to improve investment performance
  • Financial Trend Forecaster Featuring Moore Inflation Predictor, NYSE Rate of Change and NASDAQ Rate of change
  • InflationData.com Inflation calculators, databases, etc.
  • Intergalactic Web Designers Web design and development services
  • Your Family Finances

Articles by Category

Articles by Date

Disclaimer

At UnemploymentData.com we are not registered investment advisors and do not provide any individualized advice. Past performance is not necessarily indicative of future performance and future accuracy and profitable results cannot be guaranteed.

Privacy & Terms of Use

Privacy Statement & Terms of Use

Do Not Sell My Information

Copyright © 2025 · News Pro on Capital Professional Services, LLC. All rights reserved · Log in