
![]() On Friday January 5th the U.S. Bureau of Labor Statistics (BLS) released their monthly employment survey results for the month of December. Many of the numbers remained unchanged from November which was also unchanged from October.
On Friday January 5th the U.S. Bureau of Labor Statistics (BLS) released their monthly employment survey results for the month of December. Many of the numbers remained unchanged from November which was also unchanged from October.
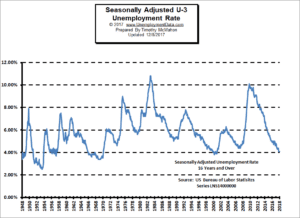
Unemployment
According to the BLS Seasonally Adjusted U-3 was 4.1% since October while Unadjusted U-3 was 3.9% for three months. Unadjusted U-6 unemployment which is a broader measure of Unemployment rose from 7.6% in October to 7.7% in November to 8.0% in December. This is still significantly better than a year ago when in November 2016 Unadjusted U-6 was 9% and December was 9.1%.
 Typically January sees an uptick in unemployment as all the seasonal employees get laid-off. So we would expect some sort of uptick next month.
According to the BLS Commissioner’s report for this month:
“Among the major worker groups, the unemployment rate for teenagers declined to 13.6 percent in December, offsetting an increase in November. In December, the unemployment rates for adult men (3.8 percent), adult women (3.7 percent), Whites (3.7 percent), Blacks (6.8 percent), Asians (2.5 percent), and Hispanics (4.9 percent) showed little or no change.”
See: Current Unemployment Rate Chart for more info.
Employment
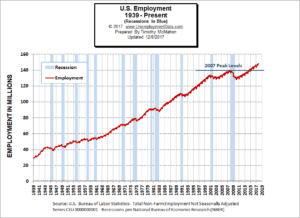 Back in October, employment was 147,952,000 in November it rose to 148,526,000 but then it fell slightly in December to 148,346,000 for a net loss from November to December of 180,000 jobs. The BLS Commissioner’s report however said, “Total nonfarm payroll employment rose by 148,000 in December…” That is because he is talking about “Seasonally Adjusted” jobs. Meaning that although actual jobs are down, they are down by 148,000 less than average for this time of year.
See Current Employment Commentary and Historical Employment Commentary
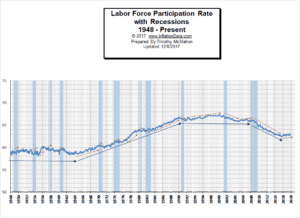
Labor Force Participation Rate
 You might be wondering if [Read more…] about December Retail Employment Down