• About WordPress
    • WordPress.org
    • Documentation
    • Learn WordPress
    • Support
    • Feedback
  • Log In
  • Skip to primary navigation
  • Skip to main content
  • Skip to primary sidebar
  • Home
  • Contact us
  • Related Sites
    • InflationData.com
    • Financial Trend Forecaster
    • Your Family Finances
    • Elliott Wave University
    • Optio Money
  • About
    • Terms of Use
    • Disclaimer & Disclosure
    • Privacy Statement
  • Sitemap
    • 2009-2010 Posts
    • 2011 Posts

UnemploymentData.com

Your Source for Employment and Unemployment Data

Unemployment
  • Charts
    • Current Unemployment Rate Chart
    • Current Employment Rate (Chart and Data)
    • Current Employment vs Unemployment Chart
    • Historical Employment Data
    • Employment Population Ratio
    • Misery Index
  • Unemployment
    • Historical Unemployment Rate Tables
    • What Is U-6 Unemployment?
    • Unadjusted vs. Seasonally Adjusted U-3 Unemployment Rate
    • BLS vs. Gallup Unemployment Numbers
    • Current U-6 Unemployment Rate
    • What is the Labor Force Participation Rate?
    • What is the Real Unemployment Rate?
  • Employment
    • Current Employment Rate (Chart and Data)
    • Historical Employment Data
    • Contacting a Live Person at the State Employment Commission
      • How to Talk to a Live Person at the Virginia Unemployment Commission
      • Florida’s FLUID Unemployment Program
    • Benefits
      • Insurance
      • Retirement
    • Careers
    • Employment Costs
    • Experience
    • Government
    • Job Hunting
      • Interview
      • Resume
  • Find Articles
  • Education
    • Skills
  • General
    • Small Business
      • Outsourcing
    • Success
You are here: Home / Archives for State

State

May 2022- Unemployment by State

June 18, 2022 by Tim McMahon

On Friday, June 17th, 2022, The U.S. Bureau of Labor Statistics (BLS) released its breakdown of the unemployment rates for each individual state for May.

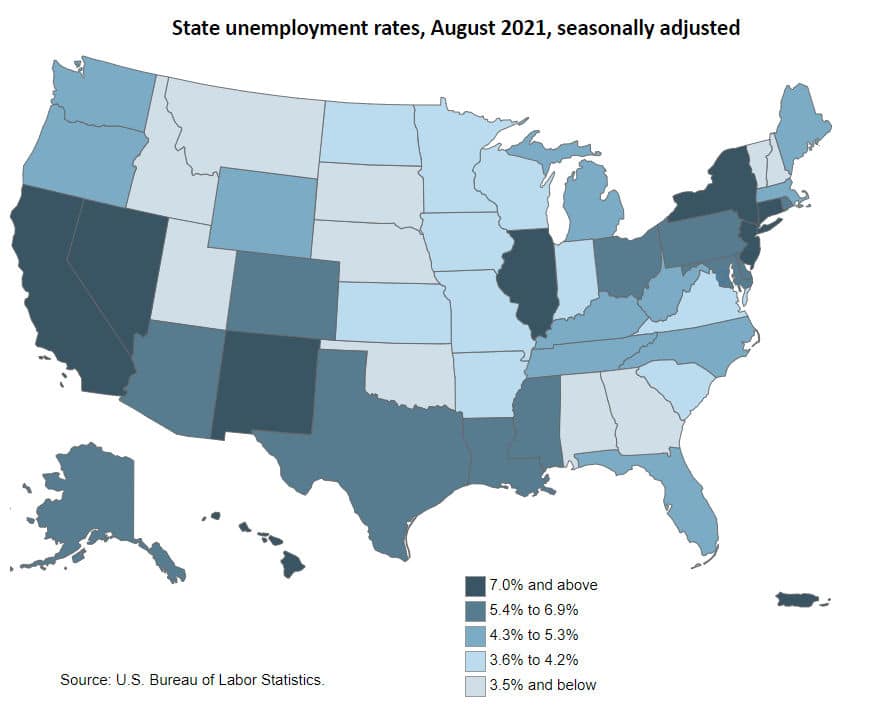
In the chart below, the lightest colors represent the states with the lowest unemployment rates.

Unemployment By State May 2022
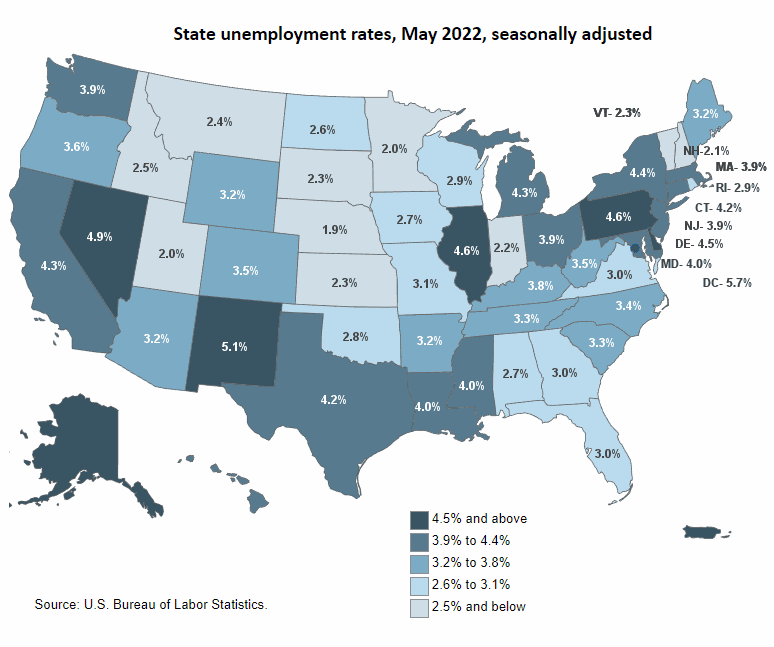
Looking at the above map, we can see that the lowest unemployment states run diagonally across the country, starting in Florida and ending in Montana and Idaho. Conversely, the states with the highest unemployment are located in the North East, the South West, and West Coast.  Of course, minor exceptions exist, but generally, it holds.

May 2022 Unemployment Rate by State Table (Alphabetical)

State May 2022 Unemployment Rate May 2021 Unemployment Rate 12-month change
Alabama 2.7% 3.6% -0.9%
Alaska 4.7% 6.8% -2.1%
Arizona 3.2% 5.4% -2.2%
Arkansas 3.2% 4.4% -1.2%
California 4.3% 7.9% -3.6%
Colorado 3.5% 5.8% -2.3%
Connecticut 4.2% 6.7% -2.5%
Delaware 4.5% 5.7% -1.2%
District of Columbia 5.7% 6.9% -1.2%
Florida 3.0% 4.9% -1.9%
Georgia 3.0% 4.1% -1.1%
Hawaii 4.2% 5.9% -1.7%
Idaho 2.5% 3.7% -1.2%
Illinois 4.6% 6.5% -1.9%
Indiana 2.2% 4.0% -1.8%
Iowa 2.7% 4.5% -1.8%
Kansas 2.3% 3.4% -1.1%
Kentucky 3.8% 4.7% -0.9%
Louisiana 4.0% 5.9% -1.9%
Maine 3.2% 4.9% -1.7%
Maryland 4.0% 5.7% -1.7%
Massachusetts 3.9% 5.9% -2.0%
Michigan 4.3% 6.2% -1.9%
Minnesota 2.0% 3.4% -1.4%
Mississippi 4.0% 6.0% -2.0%
Missouri 3.1% 4.5% -1.4%
Montana 2.4% 3.6% -1.2%
Nebraska 1.9% 2.5% -0.6%
Nevada 4.9% 7.8% -2.9%
New Hampshire 2.1% 3.7% -1.6%
New Jersey 3.9% 6.6% -2.7%
New Mexico 5.1% 7.2% -2.1%
New York 4.4% 7.4% -3.0%
North Carolina 3.4% 5.0% -1.6%
North Dakota 2.6% 3.8% -1.2%
Ohio 3.9% 5.4% -1.5%
Oklahoma 2.8% 4.4% -1.6%
Oregon 3.6% 5.6% -2.0%
Pennsylvania 4.6% 6.7% -2.1%
Rhode Island 2.9% 6.0% -3.1%
South Carolina 3.3% 4.1% -0.8%
South Dakota 2.3% 3.2% -0.9%
Tennessee 3.3% 4.6% -1.3%
Texas 4.2% 5.9% -1.7%
Utah 2.0% 2.8% -0.8%
Vermont 2.3% 3.6% -1.3%
Virginia 3.0% 4.1% -1.1%
Washington 3.9% 5.5% -1.6%
West Virginia 3.5% 5.4% -1.9%
Wisconsin 2.9% 4.1% -1.2%
Wyoming 3.2% 4.7% -1.5%
Puerto Rico 6.2% 8.1% -1.9%

States with the Highest Unemployment Rates

The record for the highest unemployment goes as usual to the two that are not really “states,” i.e., Puerto Rico and D.C. at 6.2% and 5.7%, respectively. Next comes New Mexico at 5.1%, Nevada at 4.9%, Alaska at 4.7%, Illinois and Pennsylvania at 4.6%, Delaware at 4.5%, New York at 4.4%, and California and Michigan tied for 10th worst place at 4.3%. [Read more…] about May 2022- Unemployment by State

Filed Under: Unemployment Tagged With: 2022, BLS, May, State, unemployment

December Unemployment Rates by State

February 1, 2022 by Tim McMahon

Unemployment rates fell in 42 states plus the District of Columbia from the previous month. Forty-Eight states along with D.C. had significantly lower unemployment rates than year-ago levels. Iowa and Maine’s unemployment rates have only fallen by -0.2% and -0.3% respectively.

California had the highest number of unemployed individuals at 1.238 million which gave them a 6.5% unemployment rate. The next highest number of unemployed was Texas with 712,828 unemployed and a 5.0% unemployment rate. Puerto Rico had the highest unemployment rate at 7.5%. And Nebraska had the lowest unemployment rate at 1.7%.

In the following chart, bubble size indicates the number of unemployed. The vertical axis indicates the percent change from a year ago, while the horizontal axis indicates the current unemployment rate (in percent).

Unemployment Rate by State Bubble Chart


State Unemployment Rate 12-month % Change Number of Unemployed
Alabama 3.1 -1.6 69,854
Alaska 5.7 -0.8 20,233
Arizona 4.1 -2.7 150,043
Arkansas 3.1 -1.8 42,609
California 6.5 -2.8 1,238,037
Colorado 4.8 -2.1 154,292
Connecticut 5.8 -2.4 105,215
Delaware 5.0 -0.9 24,609
District of Columbia 5.8 -3.0 23,741
Florida 4.4 -0.7 466,176
Georgia 2.6 -2.7 135,906
Hawaii 5.7 -4.6 37,057
Idaho 2.4 -1.4 22,088
Illinois 5.3 -2.7 333,136
Indiana 2.7 -1.9 88,240
Iowa 3.5 -0.2 57,907
Kansas 3.3 -1.4 49,796
Kentucky 3.9 -1.7 78,817
Louisiana 4.8 -3.1 98,295
Maine 4.7 -0.3 31,806
Maryland 5.0 -1.8 156,473
Massachusetts 3.9 -4.5 145,093
Michigan 5.6 -2.6 265,115
Minnesota 3.1 -1.6 93,906
Mississippi 4.5 -2.1 56,792
Missouri 3.3 -1.1 101,988
Montana 2.5 -1.7 13,689
Nebraska 1.7 -1.7 17,128
Nevada 6.4 -1.8 99,409
New Hampshire 2.6 -1.2 19,561
New Jersey 6.3 -1.4 280,211
New Mexico 5.8 -2.8 55,640
New York 6.2 -2.5 572,626
North Carolina 3.7 -2.4 188,391
North Dakota 3.1 -1.6 12,297
Ohio 4.5 -1.1 256,392
Oklahoma 2.3 -2.2 42,758
Oregon 4.1 -2.2 89,349
Pennsylvania 5.4 -1.7 337,133
Rhode Island 4.8 -3.1 26,684
South Carolina 3.5 -2.1 85,090
South Dakota 2.6 -0.7 12,173
Tennessee 3.8 -1.8 127,341
Texas 5.0 -1.9 712,828
Utah 1.9 -1.4 31,817
Vermont 2.5 -1.0 7,972
Virginia 3.2 -2.4 136,557
Washington 4.5 -1.8 176,857
West Virginia 3.7 -3.0 28,903
Wisconsin 2.8 -1.2 86,197
Wyoming 3.3 -1.9 9,717
Puerto Rico 7.5 -1.7 82,653

Nebraska had the lowest jobless rate in December, at 1.7 percent, followed by Utah, 1.9 percent. The rates in the following 12 states set new series lows (since 1976): Arkansas (3.1 percent), Georgia (2.6 percent), Idaho (2.4 percent), Indiana (2.7 percent), Kentucky (3.9 percent), Mississippi (4.5 percent), Montana (2.5 percent), Nebraska (1.7 percent), Oklahoma (2.3 percent), Utah (1.9 percent), West Virginia (3.7 percent), and Wisconsin (2.8 percent). California and Nevada had the highest unemployment rates, 6.5 percent, and 6.4 percent, respectively.

Editor’s Note: It is possible that part of the reason that the unemployment rate is so low is that people have withdrawn from the workforce due to COVID fears, homeschooling, or other reasons.

In total, 17 states and the District of Columbia had unemployment rates higher than the U.S. figure of 3.9 percent, 16 states had lower rates, and 17 states had rates that were not appreciably different from that of the nation.

Nonfarm Payroll Employment

Nonfarm payroll employment increased in 17 states and was essentially unchanged in 33 states and the District of Columbia in December 2021. The largest job gains occurred in California (+50,700), Texas (+50,000), and New York (+45,300). The largest percentage increases occurred in Iowa and West Virginia (+0.8 percent each), followed by Massachusetts, Missouri, and Montana (+0.6 percent each).

Over the year, nonfarm payroll employment increased in 48 states and the District of Columbia and was essentially unchanged in 2 states. The largest job increases occurred in California (+954,400), Texas (+694,400), and Florida (+479,300). The largest percentage increases occurred in Nevada (+7.4 percent), Hawaii (+7.1 percent), and Massachusetts (+6.6 percent).

Filed Under: Unemployment Tagged With: December 2021, employment, State, unemployment

Got A New Job Out Of State? How To Find A New Home Fast

October 21, 2021 by Tim McMahon

If your career is taking you to a new job out of state, you’ll have many details that will need to be worked out in a short amount of time. One of the biggest is finding a new home, which can be challenging even under the best of circumstances. But with the current seller’s market in many areas of the country, finding an affordable home can be difficult.

However, you can solve this problem far quicker than you ever anticipated with some careful planning and determination.

Start Looking at Online Listings

Even if you don’t have a significant amount of time before relocating for your new job, one of the fastest ways to get started on the hunt is by checking online listings. Go online and start looking at listings of homes in the area to which you are moving. Since the pandemic, more agencies are offering homes via virtual tours, so you may be able to find the home you want at a reasonable price while sitting at your computer.

Contact a Local Real Estate Agent

If you aren’t comfortable [Read more…] about Got A New Job Out Of State? How To Find A New Home Fast

Filed Under: General Tagged With: job, Relocating, State

Blue State Unemployment is 33.33% Higher Than Red States

September 18, 2021 by Tim McMahon

Unemployment by State- August 2021

The U.S. Bureau of Labor Statistics releases the Unemployment rates for the country on the first Friday of the month. A couple of weeks later they release the breakdown for each of the fifty U.S. states. On September 17th 2021, they released the individual state unemployment numbers for August 2021.

According to the report, “Unemployment rates were lower in August in 15 states and the District of Columbia and stable in 35 states, the U.S. Bureau of Labor Statistics reported today. Forty-nine states and the District had jobless rate decreases from a year earlier and one state was little changed. The national unemployment rate, 5.2 percent, declined by 0.2 percentage point over the month and was 3.2 points lower than in August 2020. Nonfarm payroll employment increased in 11 states, decreased in 3 states, and was essentially unchanged in 36 states and the District of Columbia in August 2021. Over the year, 49 states and the District added nonfarm payroll jobs and 1 state was essentially unchanged.”


State Unemployment Rates


Seasonally Adjusted State Unemployment Levels

The following table provides [Read more…] about Blue State Unemployment is 33.33% Higher Than Red States

Filed Under: Unemployment Tagged With: August Unemployment, Political Party, State, unemployment

Unemployment Rate by State April 2020

May 23, 2020 by Tim McMahon

On May 22nd 2020, the U.S. Bureau of Labor Statistics released the Seasonally Adjusted Unemployment rates for each of the fifty U.S. states but “Due to the effects of the pandemic and efforts to contain the virus, Puerto Rico was not able to conduct normal data collection for its household survey in March or April 2020.”

According to the May 8th BLS data, April’s overall U.S. Seasonally Adjusted Unemployment Rate was 14.7% in today’s release we can see that some states had significantly higher rates with Nevada having 28.2% Unemployment, and Hawaii and Michigan having 22.3% and 22.7% unemployment respectively. At first blush, we might consider Hawaii and Nevada as understandable due to their high reliance on tourism but Michigan doesn’t have high tourism. And if high tourism is the cause for Hawaii and Nevada why does a high tourism state like Florida have “only” 12.9% unemployment?

By looking at the map we can see the high unemployment states are clustered in the Northeast and run down to Louisiana (which got hit with a double whammy of both the Coronavirus and falling oil prices). Other hard-hit areas are the West Coast and Hawaii.

Seasonally Adjusted Unemp by state Map April 2020

State Unemployment Levels

The following table provides [Read more…] about Unemployment Rate by State April 2020

Filed Under: General Tagged With: April 2020, Governor, Legislature, Party, State, unemployment

Unemployment By State and Political Party

July 19, 2019 by Tim McMahon

Unemployment rates were lower in June in 6 states and stable in 44 states and the District of Columbia, the U.S. Bureau of Labor Statistics reported today. Three states had jobless rate decreases from a year earlier and 47 states and the District had little or no change.

Vermont had the lowest unemployment rate in June, 2.1 percent. The rates in Alabama (3.5 percent), Arkansas (3.5 percent), New Jersey (3.5 percent), and Texas (3.4 percent) set new series lows. (All state series begin in 1976.) Alaska and Puerto Rico had the highest jobless rates, at 6.4 and 8.4 percent respectively. In total, 13 states had unemployment rates lower than the U.S. figure of 3.7 percent, 9 states and the District of Columbia had higher rates, and 28 states had rates that were not appreciably different from that of the nation.

State Unemployment Rates

Table of U.S. State Political Party statistics as of January 2019

I’ve sorted the following table by political party. If we look at it this way, we can see that [Read more…] about Unemployment By State and Political Party

Filed Under: Unemployment Tagged With: Democrat, Republican, State, unemployment

Arkansas, California, Idaho, South Carolina, Texas and Washington Set New Unemployment Lows in September

October 20, 2018 by Tim McMahon

The U.S. Bureau of Labor Statistics reported on Unemployment rates by state on Friday October 19th. Seasonally adjusted unemployment rates for September fell over the previous month in 9 states, were higher in 4 states, and stable in 37 states and the District of Columbia.

Nonfarm payroll employment increased in 1 state, decreased in 9 states, and was stable in 37 states and D.C.

In the following map we can see the states with the lowest unemployment are light colored while the higher unemployment states are darker colored.


Unemployment by State Sept 2018

Unemployment

Arkansas, California, Idaho, South Carolina, Texas and Washington Set New Series Lows

Hawaii had the lowest seasonally adjusted unemployment rate in September, at 2.2%. Arkansas (3.5%), California (4.1%), Idaho (2.7%), South Carolina (3.3%), Texas (3.8%), and Washington (4.4%)  set a new series low since tracking began in 1976. At 6.5% Alaska had the highest jobless rate, not counting Puerto Rico’s 8.4% which is down 2.2% from year ago levels. In total, 13 states had unemployment rates lower than the U.S. figure of 3.7 percent, 12 states plus the District of Columbia and Puerto Rico had higher rates, and 25 states had [Read more…] about Arkansas, California, Idaho, South Carolina, Texas and Washington Set New Unemployment Lows in September

Filed Under: BLS Tagged With: Alaska, Arkansas, California, Florida, Idaho, Oklahoma, South Carolina, State, Texas, unemployment, Washington

Unemployment Rates by State July 2018

August 17, 2018 by Tim McMahon

According to today’s U.S. Bureau of Labor Statistics report on Unemployment rates by state, Seasonally adjusted unemployment rates for July fell over the previous month in 11 states, were higher in 2 states, and stable in 37 states and the District of Columbia. Ten states saw jobless rate decreases from July 2017 levels and 40 states and D.C.  had little or no change.

Nonfarm payroll employment increased in 6 states in July 2018, decreased in 1 state, and was virtually unchanged in 43 states and D.C. Over the year, 34 states added nonfarm payroll jobs and 16 states and D.C. were essentially unchanged.

In the following map we can see the states with the lowest unemployment are light colored while the higher unemployment states are darker colored.

Unemployment by State July 2018

Unemployment

“Oregon lowest unemployment since 1976”

Hawaii had the lowest seasonally adjusted unemployment rate in July, at 2.1%. At 3.9% Oregon  set a new series low since tracking began in 1976. At 6.9% Alaska had the highest jobless rate, not counting Puerto Rico’s 9.1%. In total, 15 states had unemployment rates lower than the U.S. figure of 3.9 percent, 10 states plus the District of Columbia and Puerto Rico had higher rates, and 25 states had [Read more…] about Unemployment Rates by State July 2018

Filed Under: BLS Tagged With: BLS, State, unemployment

Unemployment By State

January 18, 2018 by Tim McMahon

According to the U.S. Bureau of Labor Statistics’ most recent data broken down by state (released in December for the month of November), Hawaii had the lowest unemployment at 2.0% followed by several Western States including North Dakota (2.6%), Nebraska (2.7%), Colorado, Idaho and Iowa all at 2.9%.  Somehow New Hampshire managed to also be among the lowest also at 2.7% with Vermont at 2.9%.

Although California has been touted as having the fastest growing labor force it ranked number 35 in unemployment rates with unemployment at 4.6% well below the national average of 4.1%.

Unemployment by State

The following table lists the  [Read more…] about Unemployment By State

Filed Under: Unemployment Tagged With: State, Unemployment by State, unemployment rate

Primary Sidebar

Search Site

Sponsored:

URGENT: These Stocks Stand Poised to Benefit from President Trump's Trade Wars!

As the Trump administration moves ahead with aggressive tariff policies on key imports, the mainstream media is scrambling.

This Free Report - which you can download now - reveals the names and ticker symbols of 5 Stock Poised to Benefit Most from President Trump's Tariff Wars.

Click Here to Download Your FREE Stock Report Now.

Recent Posts

  • April 2025 Employment / Unemployment Report
  • Would More Jobs Help Social Security?
  • March 2025- Employment / Unemployment Report
  • February 2025 Jobs Report
  • January 2025 BLS Employment Report

Resources

  • Bureau of Labor Statistics Current Population Survey Monthly survey of households conducted by the Bureau of Census for BLS. It provides data on the labor force, employment, unemployment, etc.
  • Capital Professional Services Providing web design and development and Internet marketing services
  • Elliott Wave University Using the Elliott Wave Principle to improve investment performance
  • Financial Trend Forecaster Featuring Moore Inflation Predictor, NYSE Rate of Change and NASDAQ Rate of change
  • InflationData.com Inflation calculators, databases, etc.
  • Intergalactic Web Designers Web design and development services
  • Your Family Finances

Articles by Category

Articles by Date

Disclaimer

At UnemploymentData.com we are not registered investment advisors and do not provide any individualized advice. Past performance is not necessarily indicative of future performance and future accuracy and profitable results cannot be guaranteed.

Privacy & Terms of Use

Privacy Statement & Terms of Use

Do Not Sell My Information

Copyright © 2025 · News Pro on Capital Professional Services, LLC. All rights reserved · Log in