
Highlights from the August 6th Bureau of Labor Statistics (BLS) employment / unemployment report for July.
![]()
- Unadjusted U-3 was Down from 6.1% to 5.7%
- Adjusted U-3 was Down from 5.9% to 5.4%
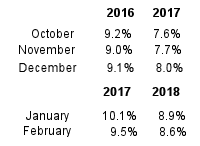
- Unadjusted U-6 was Down from 10.1% to 9.6%
- Labor Force Participation UP from 61.6% to 61.7%
- Unadjusted Employment fell from 146.603 million to 146.470 million
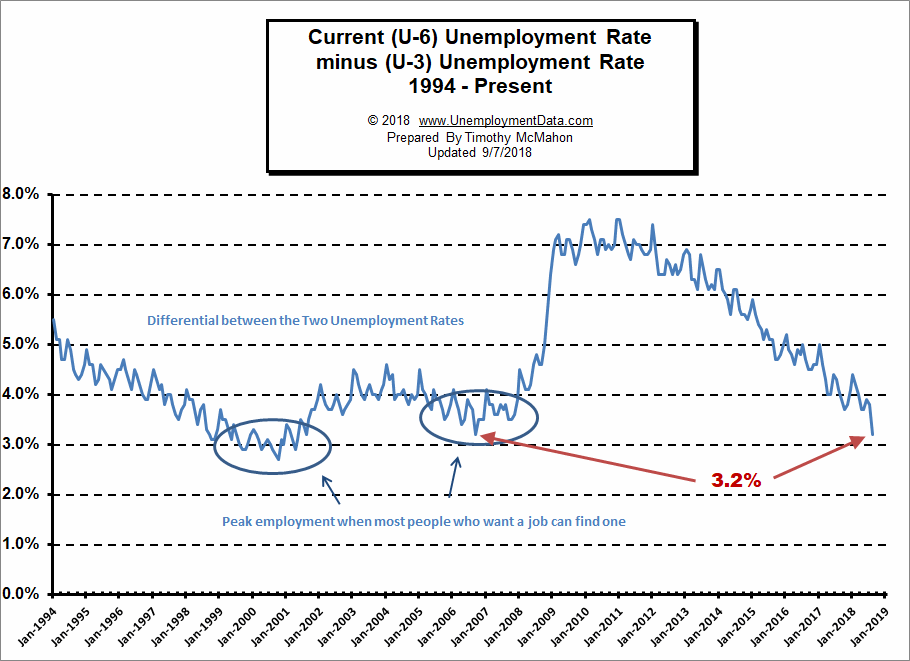
 Looking at the broader measure of
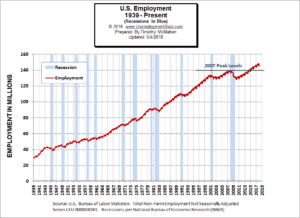
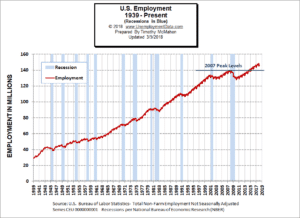 Over the last month, the actual number of people working (not seasonally adjusted) has increased by
 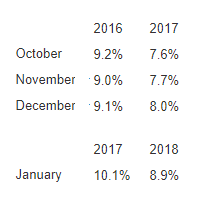 Over the same period, Unadjusted U-6 unemployment which is a broader measure of Unemployment including discouraged workers, climbed steadily.
 Over the last month, the actual number of people working (not seasonally adjusted) has decreased by